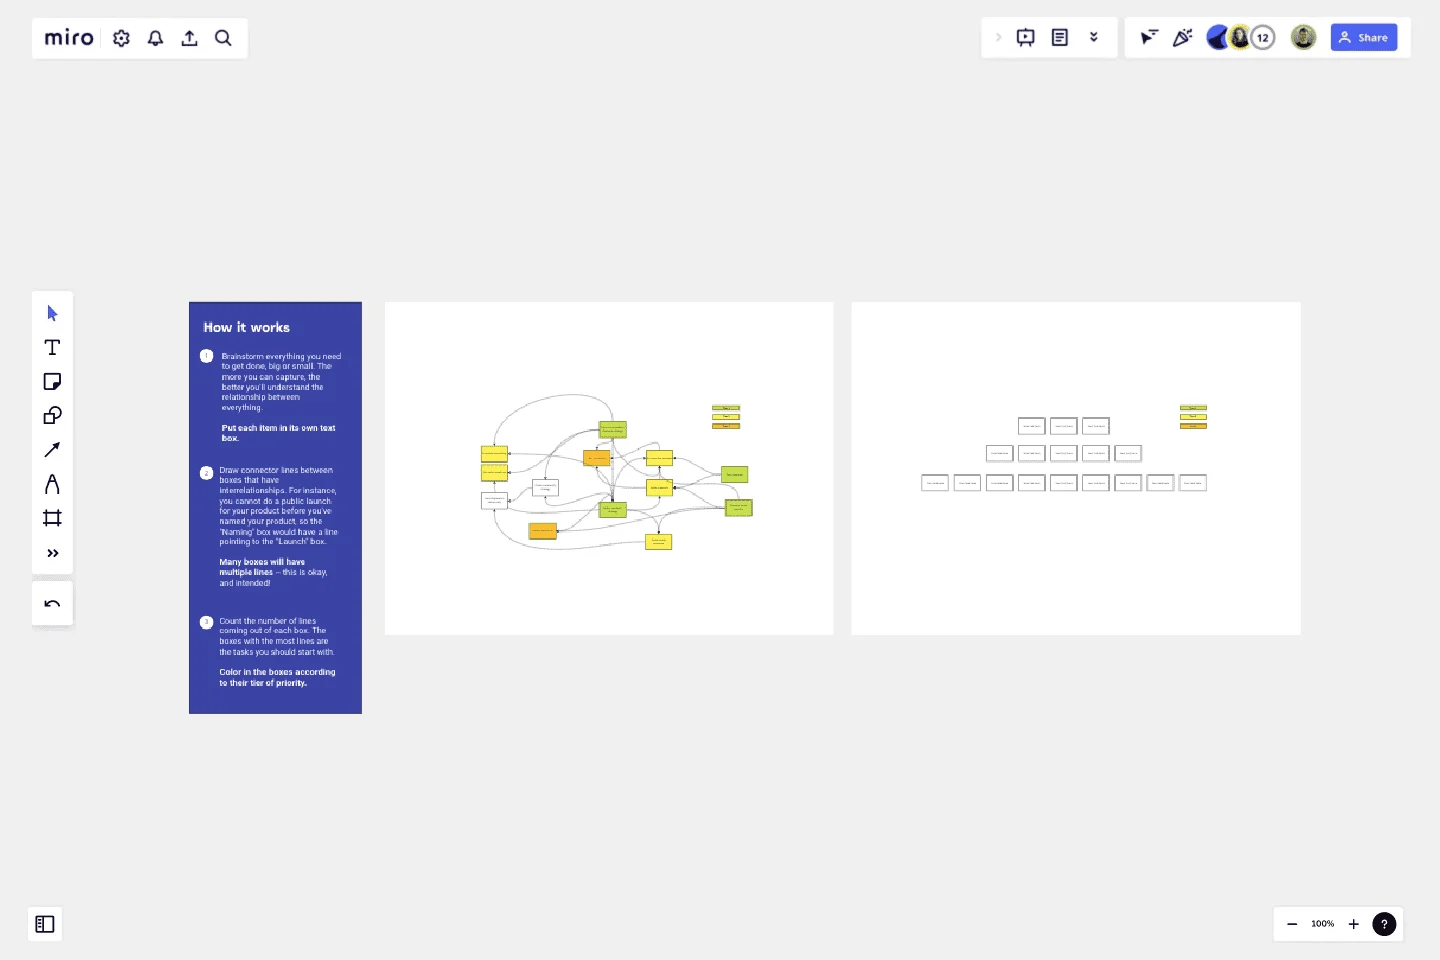
Interrelationship Diagram
Great for new projects, upcoming launches, brand-new businesses, and getting unstuck in general.
This template is for anyone working through a complex project and struggling to understand where to begin. An interrelationship diagram will help you see how all your tasks relate to one another and where to prioritize your time first. By connecting the dots between tasks, you can see which ones are the most critical and interdependent.
This template was created by Kevan Lee.
Get started with this template right now.
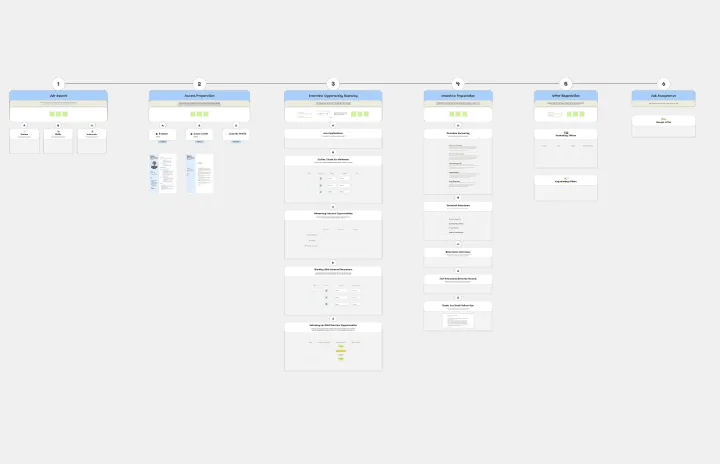
Job Search Process Diagram
Works best for:
Diagramming
The Job Search Process Diagram template offers a visual tool for mapping out the steps and stages involved in the job search process. It provides a structured framework for organizing tasks, tracking progress, and managing resources. This template enables job seekers to streamline their job search efforts, stay organized, and increase their chances of success. By promoting clarity and efficiency, the Job Search Process Diagram empowers individuals to navigate the job market effectively and achieve their career goals.
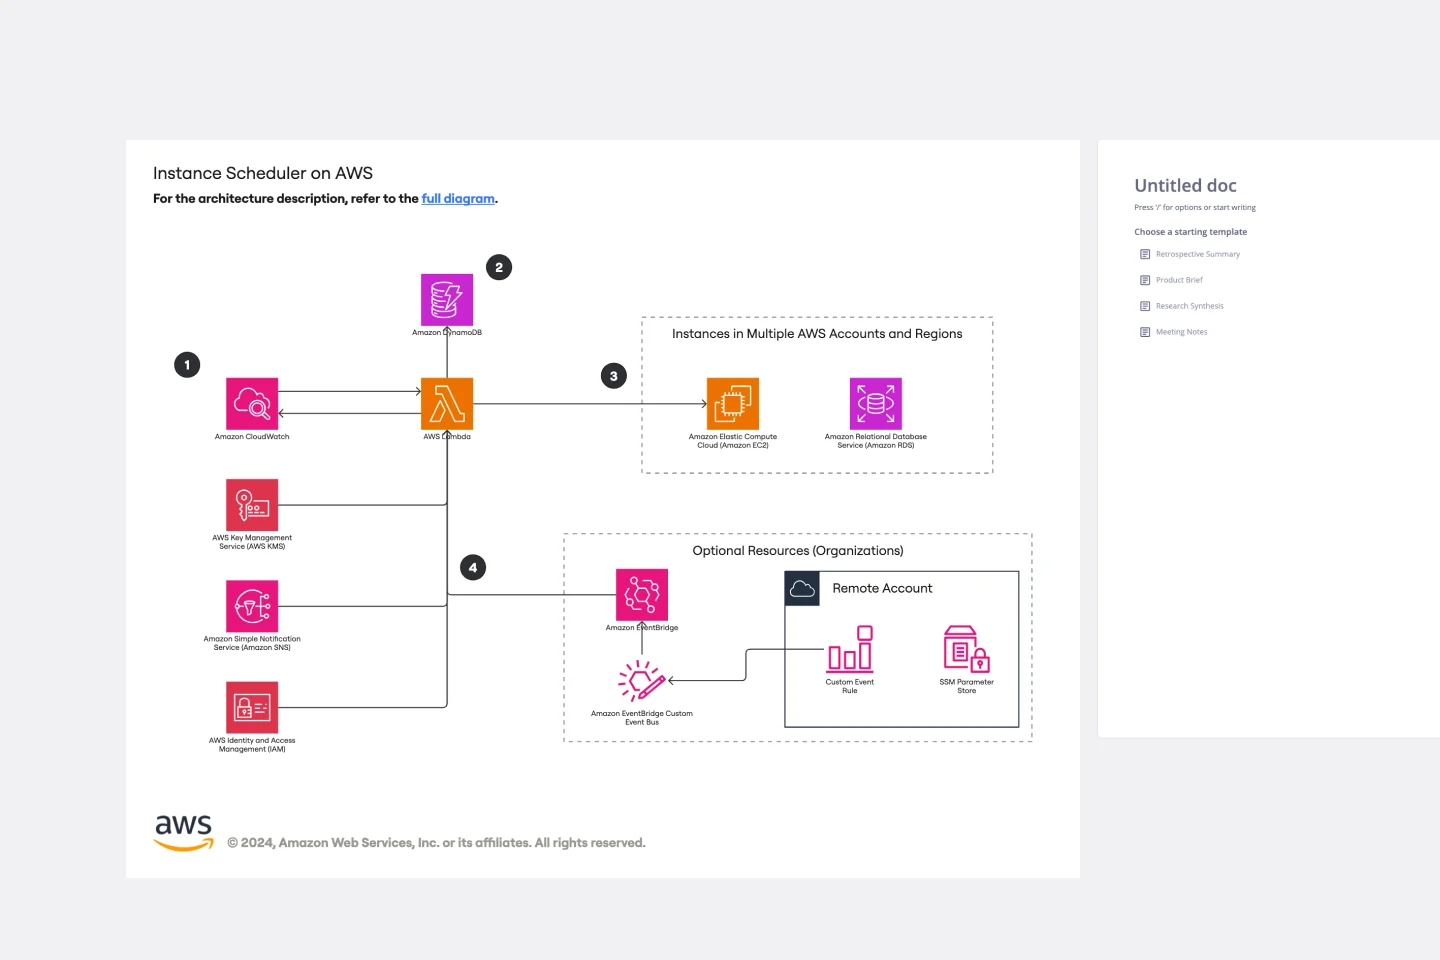
Instance Scheduler on AWS Template
Works best for:
AWS
The Instance Scheduler on AWS template is a strategic tool designed to enhance the efficiency and cost-effectiveness of managing AWS resources. It serves as a guide for automating the scheduling of Amazon EC2 and Amazon RDS instances, ensuring that these resources are operational only when necessary. This approach not only simplifies the management of instance schedules but also significantly reduces cloud computing costs by avoiding unnecessary runtime.
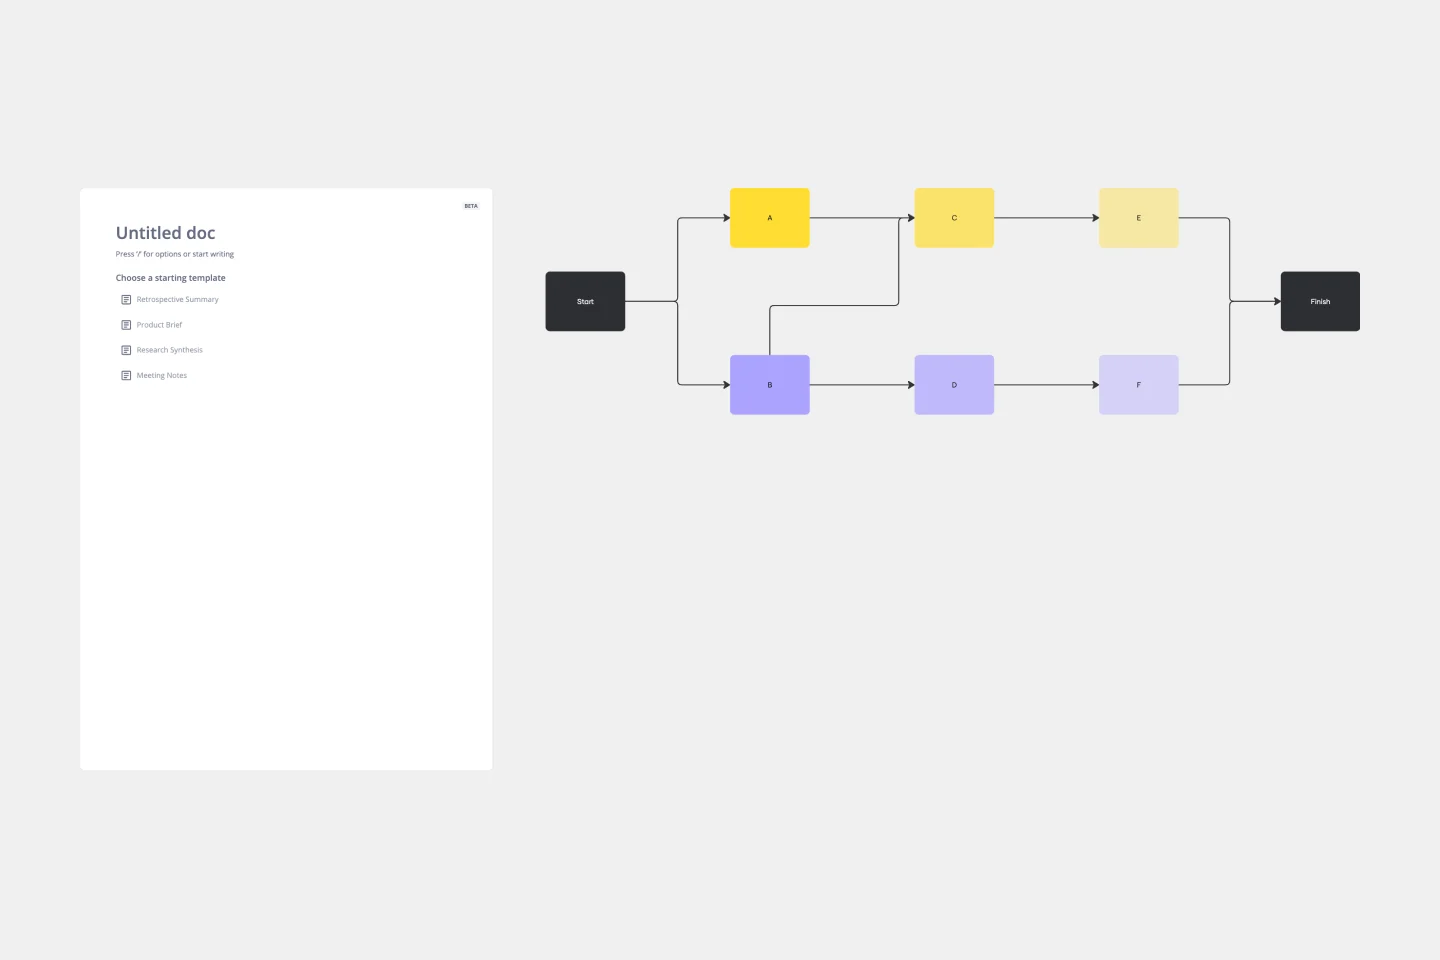
Precedence Diagram
Works best for:
Diagramming, Mapping
The Precedence Diagram Template offers a visual tool that maps out project activities and their interrelated sequences. This diagram empowers teams to recognize and anticipate workflow structures by illustrating the connections and dependencies among tasks.
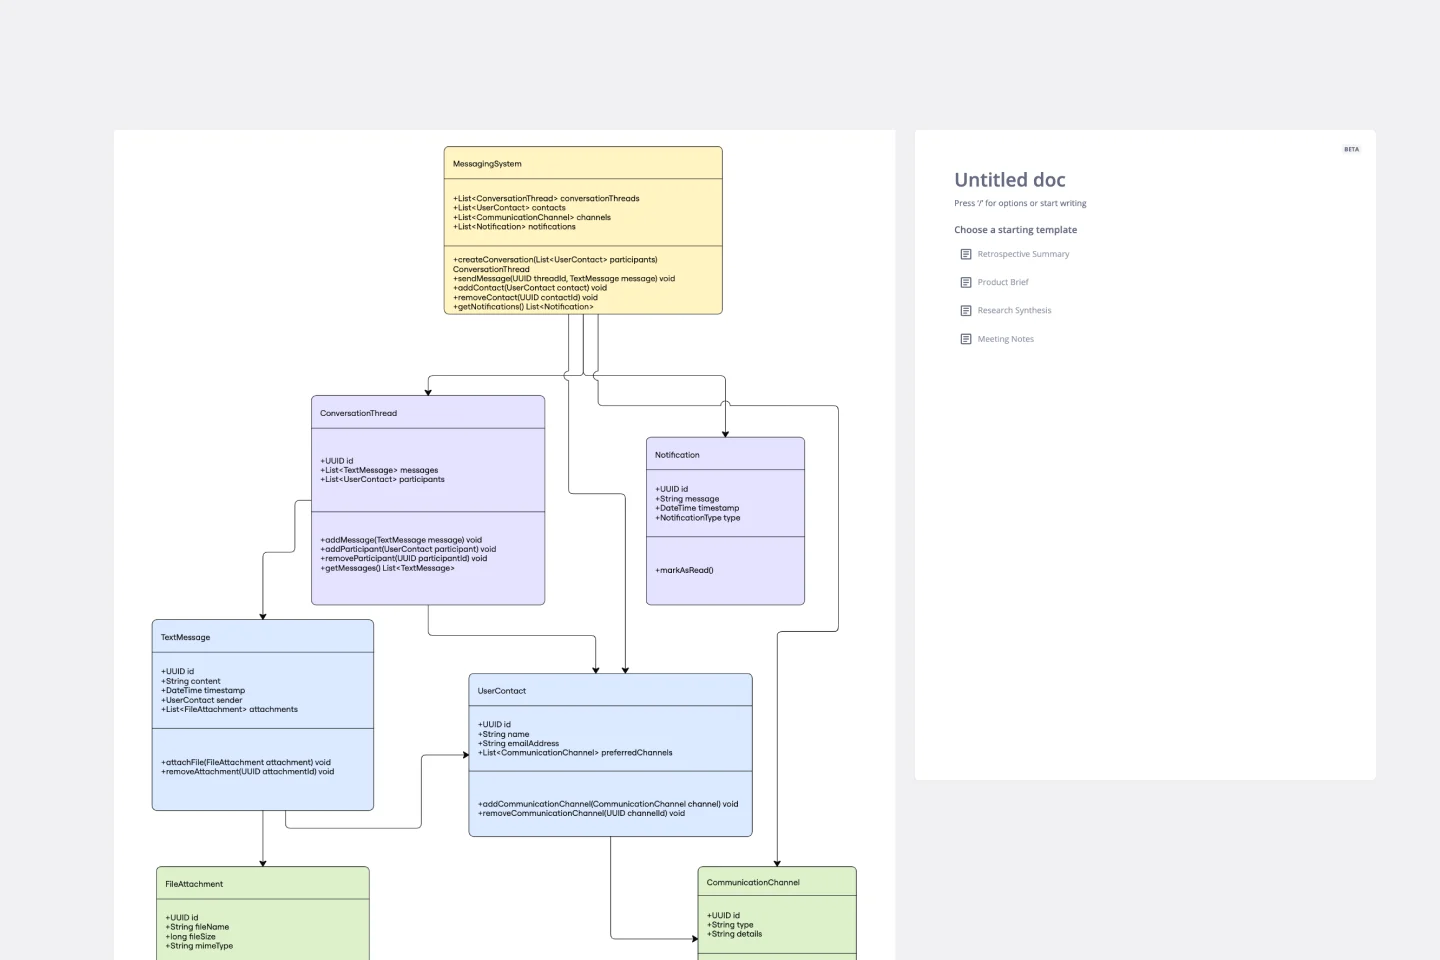
UML Class Messaging System Template
Works best for:
UML
The UML Class Messaging System Template streamlines the process of designing and analyzing messaging systems. It allows users to visually map out the structure of a system by detailing classes, their attributes, operations, and the relationships among objects. This template is particularly useful for illustrating the functionality of a messaging system, including the management of text messages, conversation threads, user contacts, notifications, and channels. It offers a clear visual representation of how all these elements interact within the system, making it an invaluable resource for developers, designers, and stakeholders aiming to enhance communication and reduce errors in the development phase.
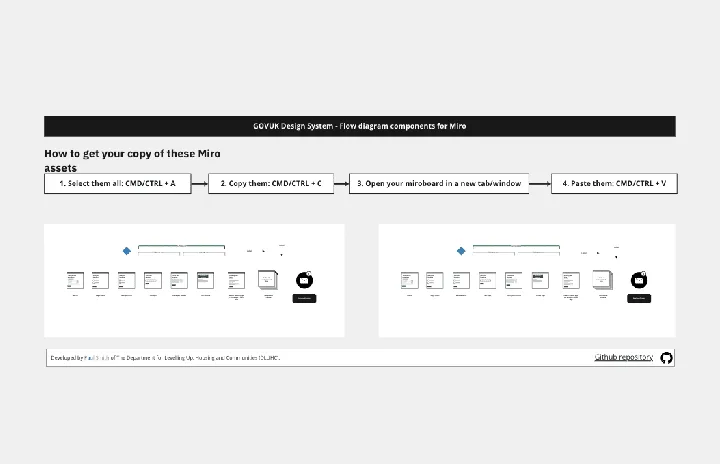
Flow Diagrams
Works best for:
Diagramming
The Flow Diagrams template offers a versatile tool for visualizing processes, workflows, and systems. It provides a range of shapes and connectors for creating flowcharts, process maps, and data flow diagrams. This template enables teams to represent complex systems and processes in a clear and structured manner, facilitating communication and decision-making. By promoting visual clarity and understanding, Flow Diagrams empower teams to analyze and optimize processes effectively, driving efficiency and productivity.
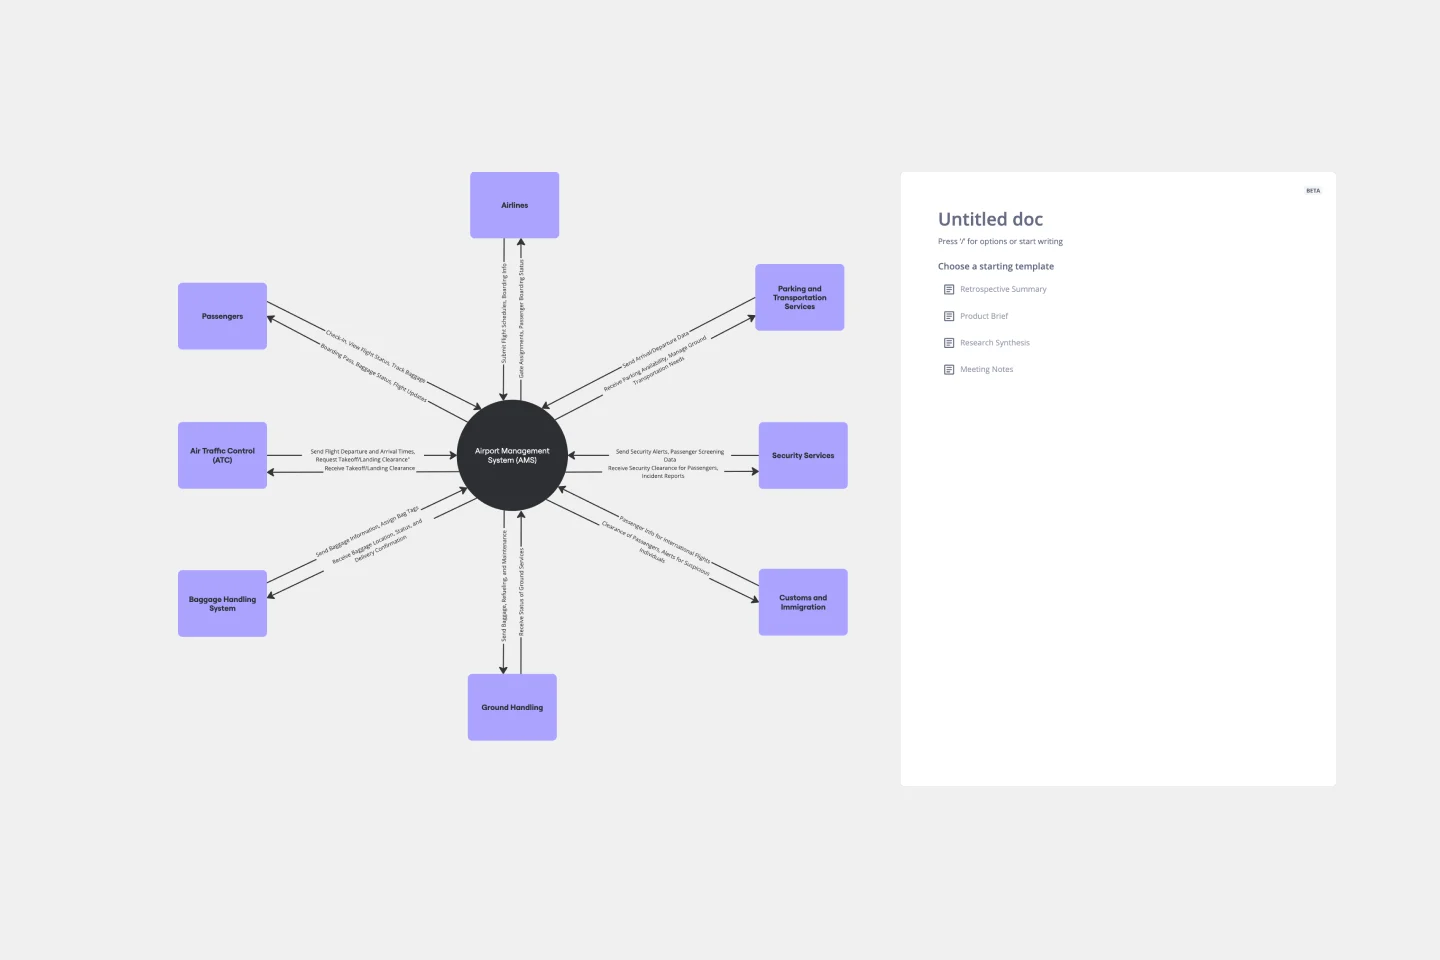
Context Diagram Template
Works best for:
Business Management, Mapping, Diagrams
A context diagram is a perfect tool to view an entire system as a single process and understand how external factors interact with it. These external factors can include customers, developers, management, and more. The Context Diagram Template is your tool for creating this diagram.