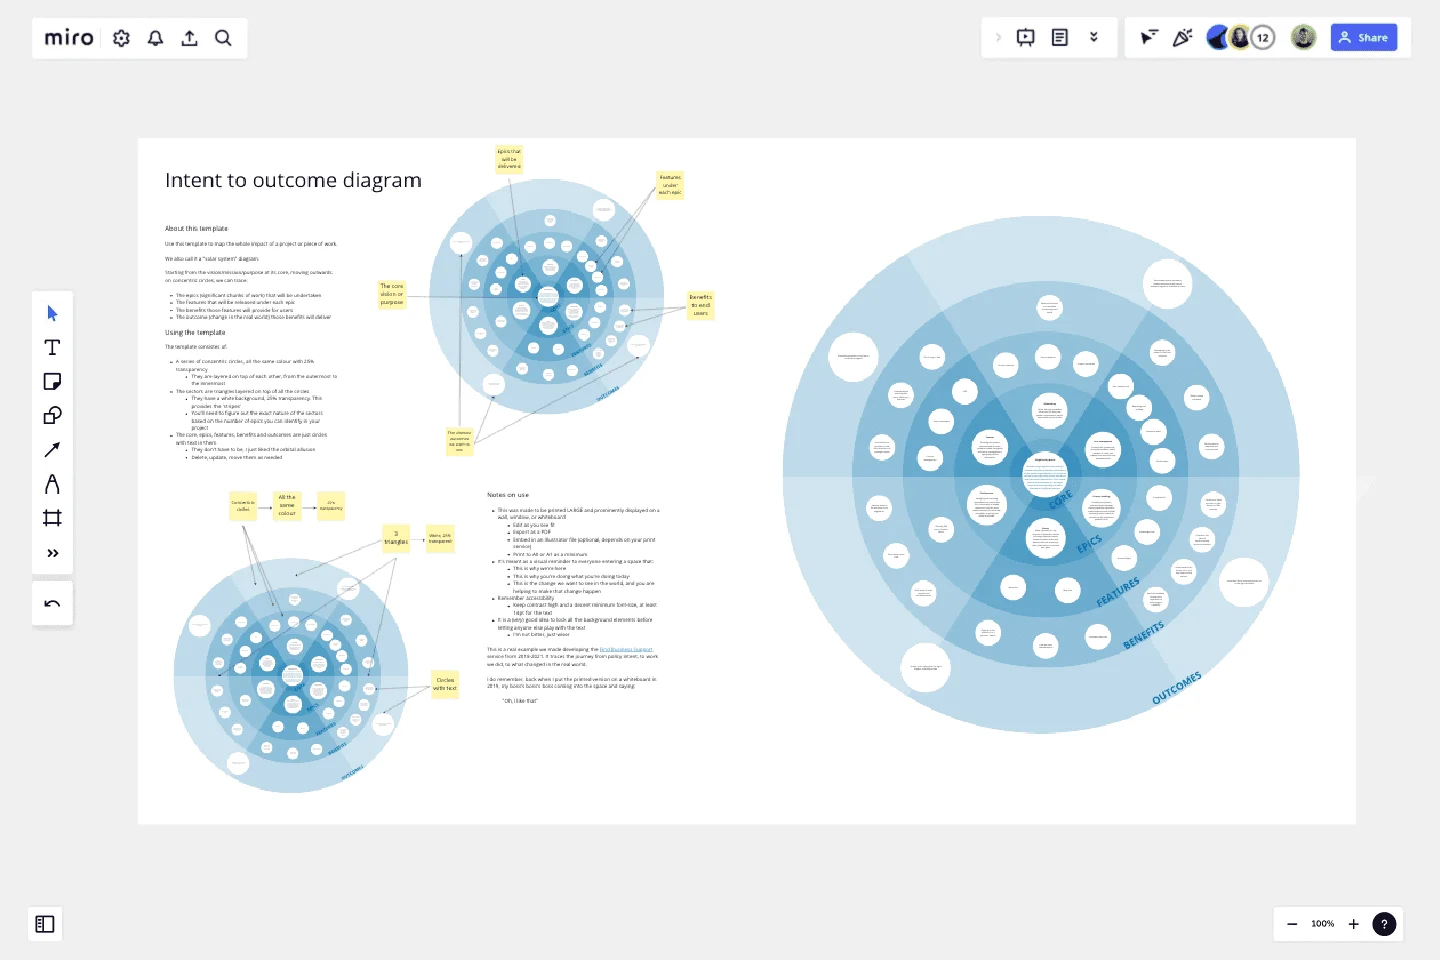
Intent to Outcome Diagram
Use this template to map the whole impact of a project or piece of work.
Starting from the vision/mission/purpose at its core, moving outwards on concentric circles, we can trace:
The epics (significant chunks of work) that will be undertaken
The features that will be released under each epic
The benefits those features will provide for users
The outcome (change in the real world) those benefits will deliver
This template was created by David O'Brien.
Get started with this template right now.
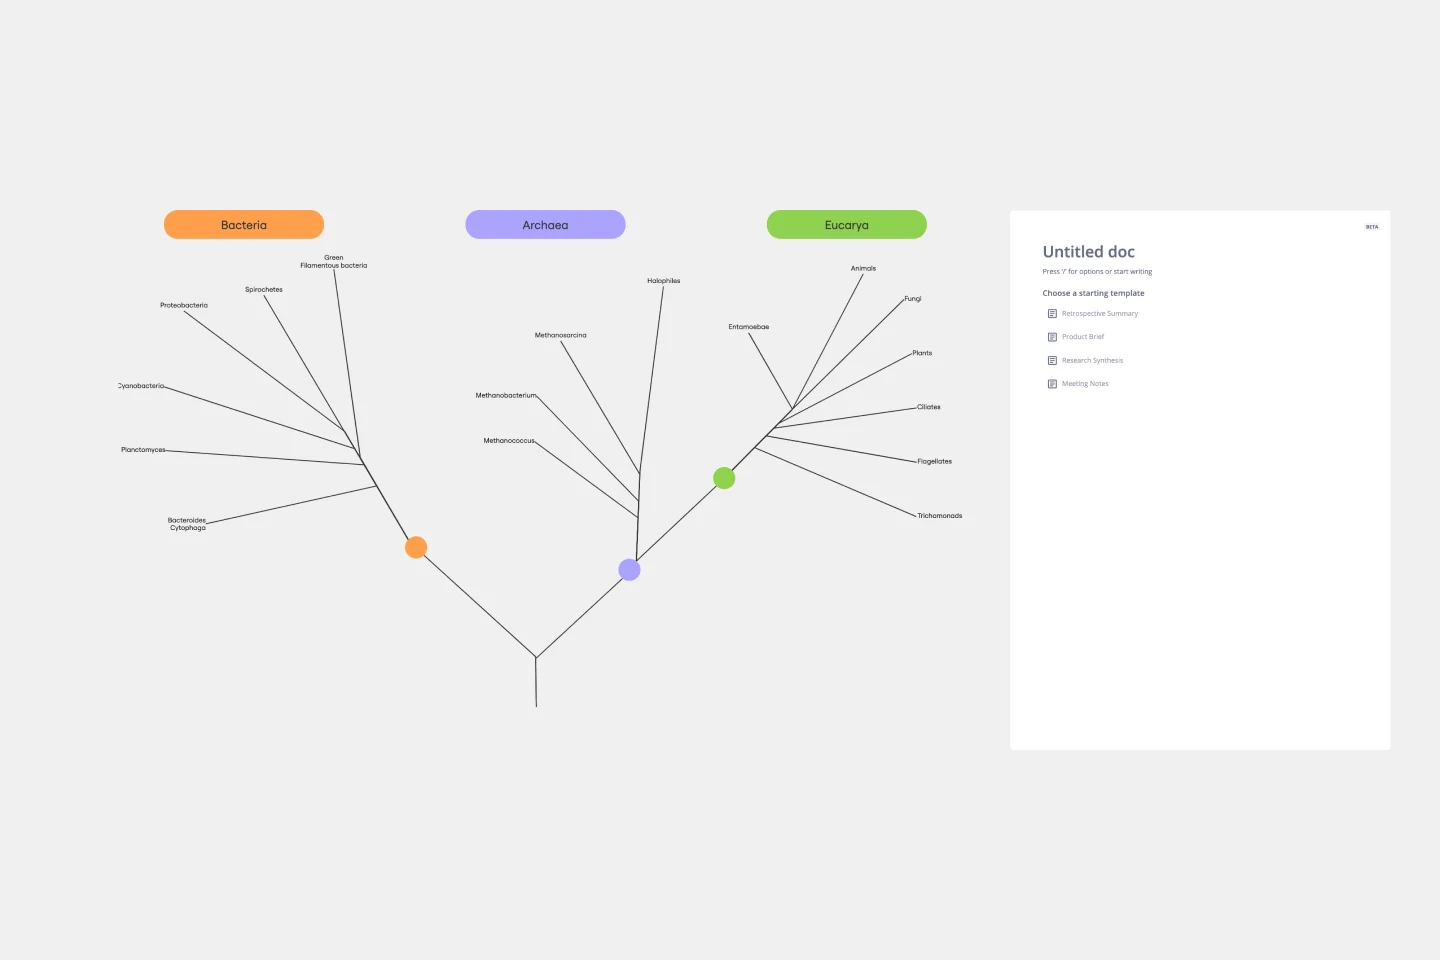
Phylogenetic Tree Template
Works best for:
Diagramming
The Phylogenetic Tree Template is a powerful tool that allows scientists and researchers to visualize evolutionary relationships between species. It is a visual representation of the history of the evolution of life on Earth and helps users identify the relationships between other organisms and their ancestors. The key benefit of this template is that it organizes complex data and makes it more understandable to everyone. Additionally, it offers an efficient way to collect and analyze data, saving time and effort and enabling users to identify significant patterns and relationships in the data.
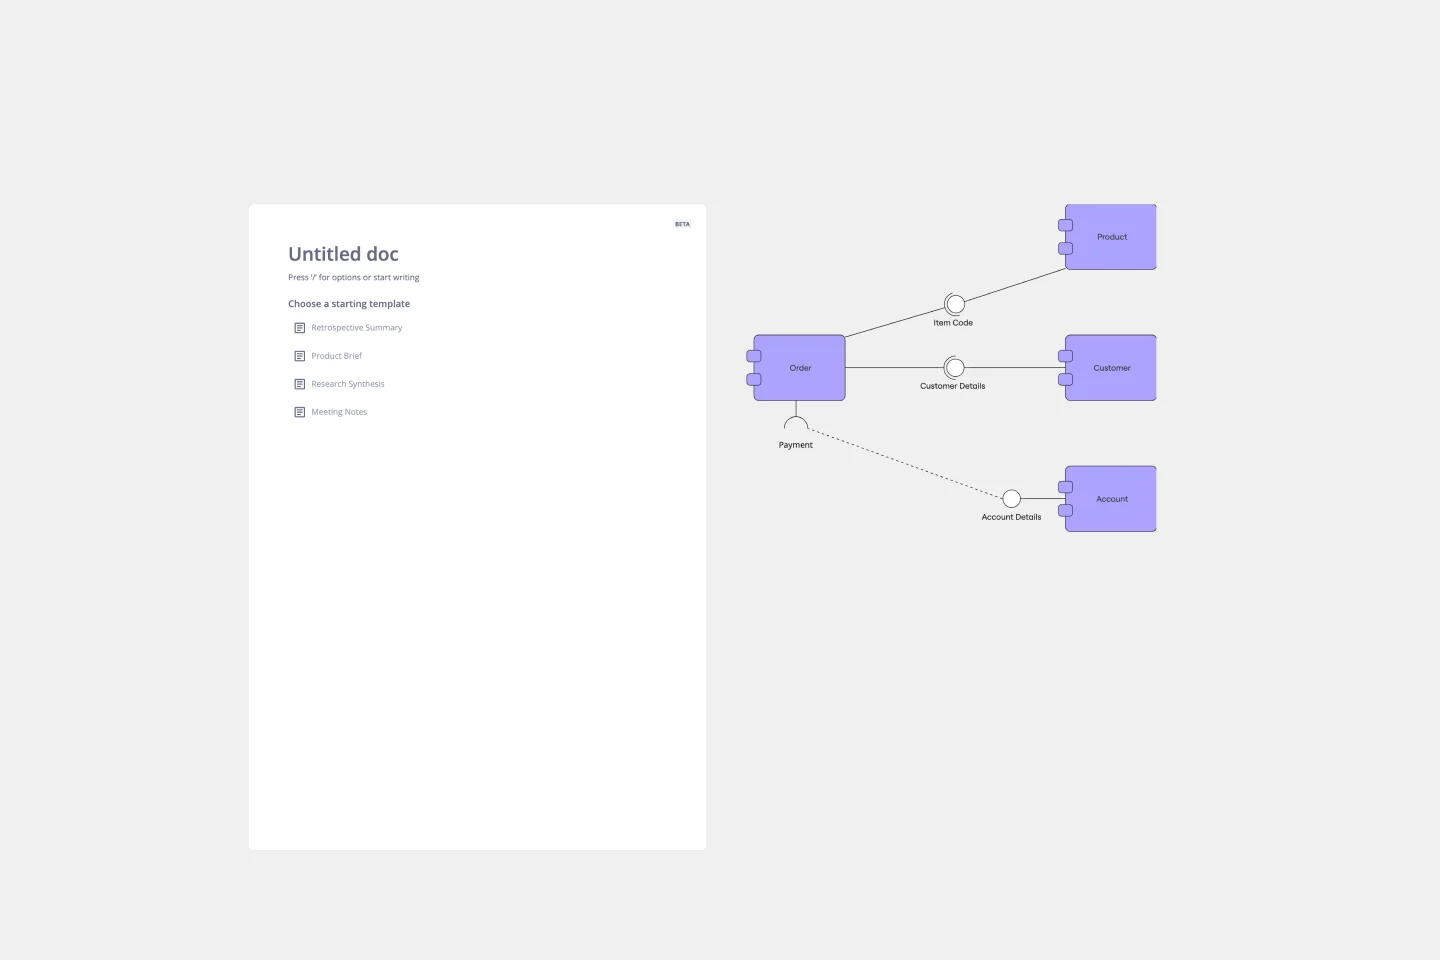
UML Component Diagram Template
Works best for:
Mapping, Diagrams, Software Development
Use our Component Diagram template to show how a system’s physical components are organized and wired together. Visualize implementation details, make sure planned development matches system needs, and more — all in a collaborative environment.
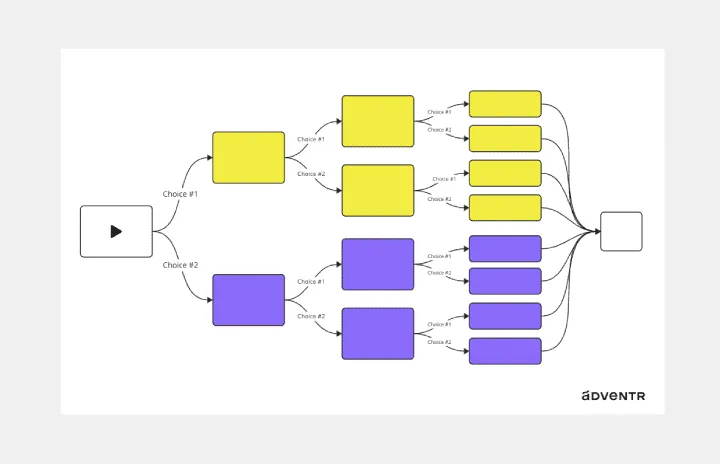
Interactive Video Storyboard Canvas
Works best for:
Diagramming
The Interactive Video Storyboard Canvas template offers a visual framework for planning and storyboarding interactive video content. It provides elements for outlining scenes, defining interactions, and visualizing user pathways. This template enables teams to design engaging and immersive video experiences, facilitating collaboration and alignment among content creators and stakeholders. By promoting creativity and interactivity, the Interactive Video Storyboard Canvas empowers teams to create compelling video narratives that captivate audiences and drive engagement.
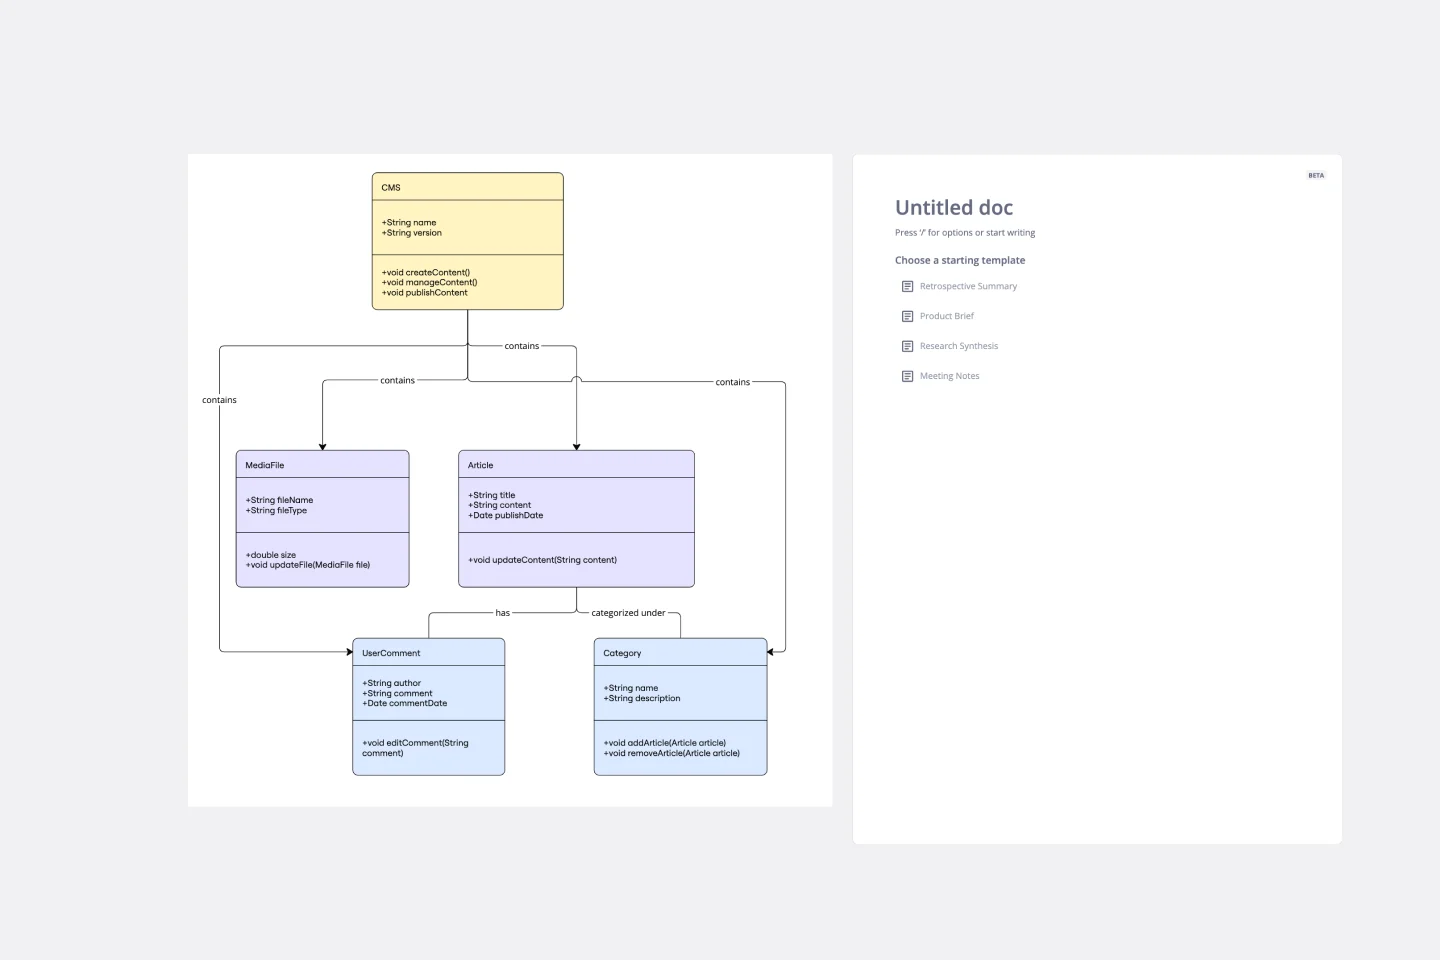
UML Class Content Management System (CMS) Template
Works best for:
UML
The UML Class Content Management System CMS Template simplifies documenting and designing the architecture of a Content Management System. It allows for the creation of UML class diagrams to visualize the structure of a CMS. Teams can efficiently map out key classes and their interactions, such as how users create, manage, and publish digital content. The template's integration into Miro's collaborative platform allows for real-time teamwork, customization, and easy sharing of feedback. This streamlines the documentation process and is valuable for software development projects aiming to develop or refine a CMS.
Person Api Uml
Works best for:
Diagramming
The Person Api Uml template offers a visual framework for designing and modeling Person API structures and interactions. It provides elements for defining entities, attributes, and relationships within a Person API system. This template enables teams to visualize and communicate the structure and behavior of Person APIs, facilitating collaboration and alignment among stakeholders. By promoting clarity and consistency in API design, the Person Api Uml template empowers teams to build robust and interoperable Person API solutions.
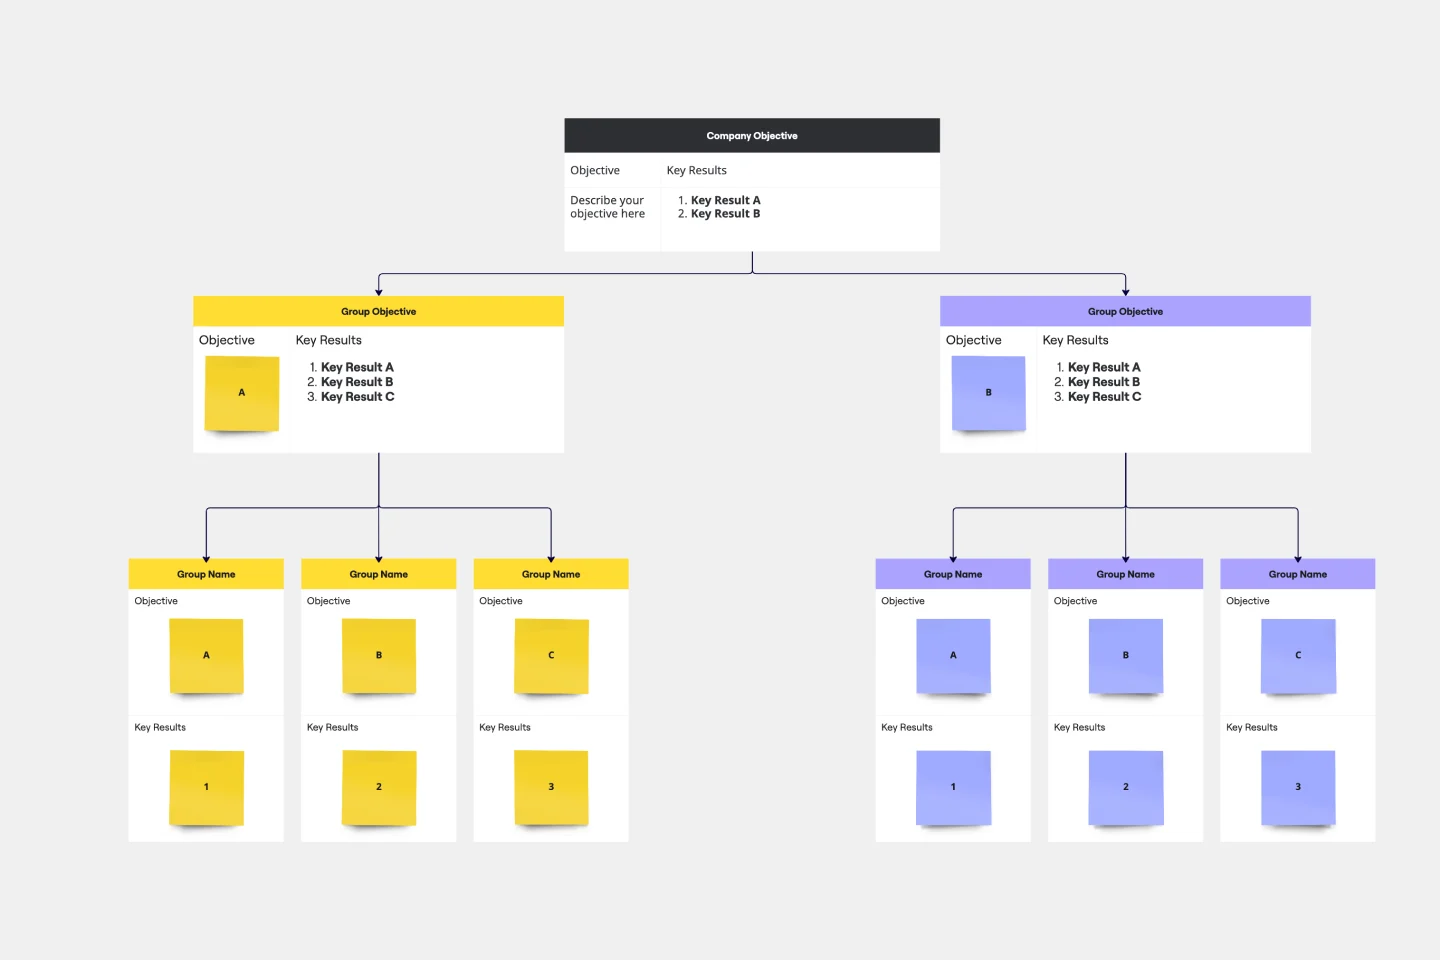
Objectives and Key Results (OKRs) Template
Works best for:
Leadership, Strategic Planning, Project Planning
Clarity, focus, and structure — those are the key ingredients to feeling confident in your company’s directions and decisions, and an OKR framework is designed to give them to you. Working on two main levels — strategic and operational — OKRs (short for objectives and key results) help an organization’s leaders determine the strategic objectives and define quarterly key results, which are then connected to initiatives. That’s how OKRs empower teams to focus on solving the most pressing organizational problems they face.