Insightful Venn
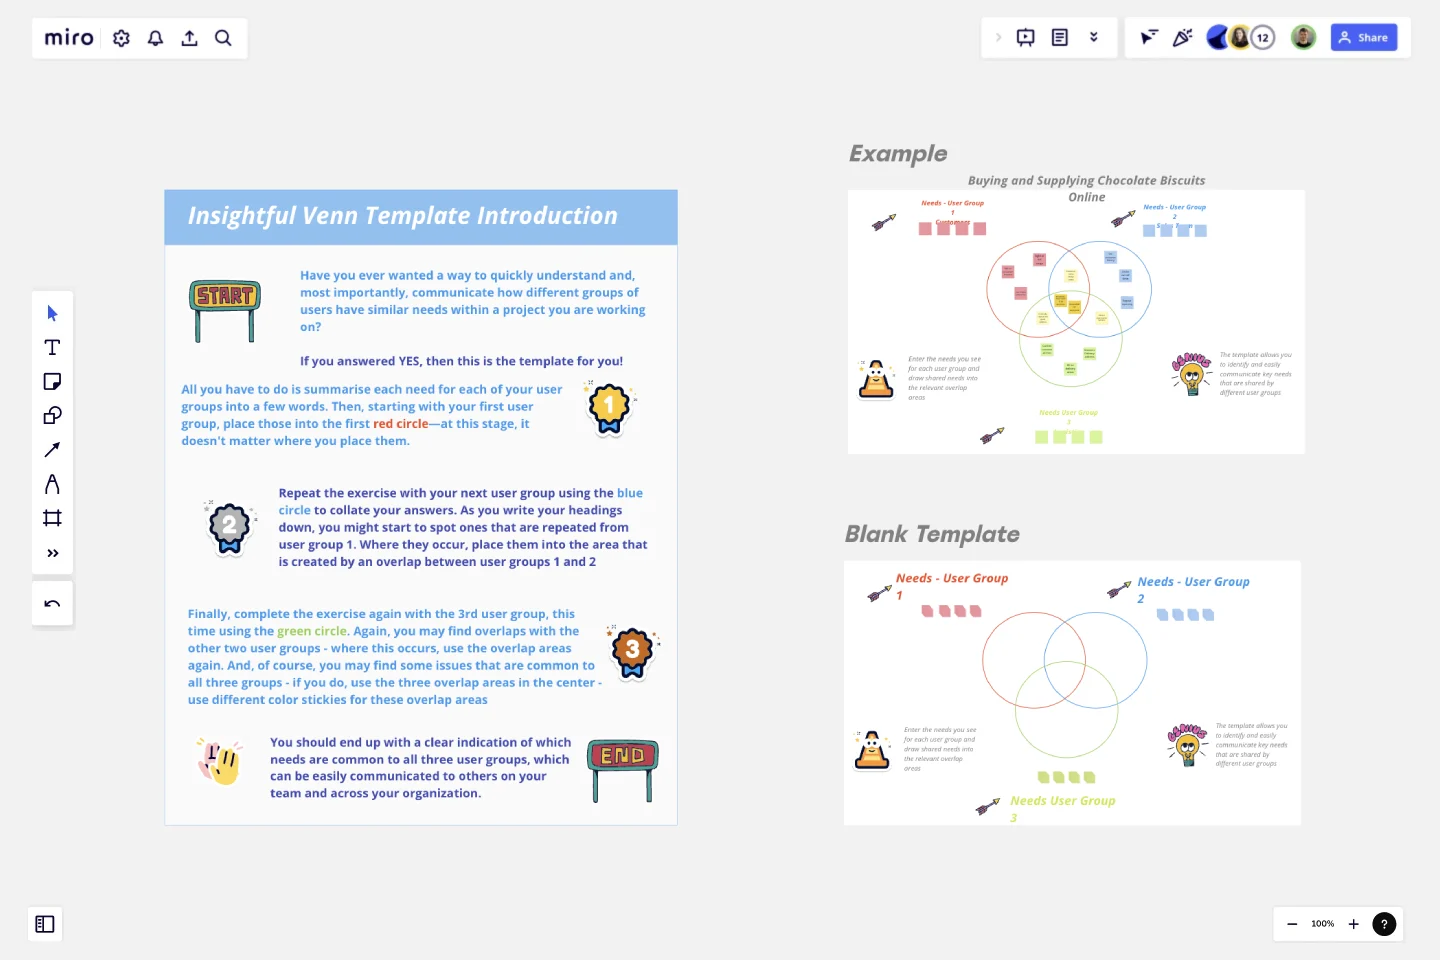
Have you ever wanted a way to quickly understand and, most importantly, communicate how different groups of users have similar needs within a project you are working on?
If you answered YES, then this is the template for you!
All you have to do is summarise each need for each of your user groups into a few words. Then, starting with your first user group, place those into the first red circle—at this stage, it doesn't matter where you place them.
Repeat the exercise with your next user group using the blue circle to collate your answers. As you write your headings down, you might start to spot ones that are repeated from user group 1. Where they occur, place them into the area that is created by an overlap between user groups 1 and 2.
Finally, complete the exercise again with the 3rd user group, this time using the green circle. Again, you may find overlaps with the other two user groups - where this occurs, use the overlap areas again. And, of course, you may find some issues that are common to all three groups - if you do, use the three overlap areas in the center - use different color stickies for these overlap areas.
You should end up with a clear indication of which needs are common to all three user groups, which can be easily communicated to others on your team and across your organization.
This template was created by Mark Hirst.
Get started with this template right now.
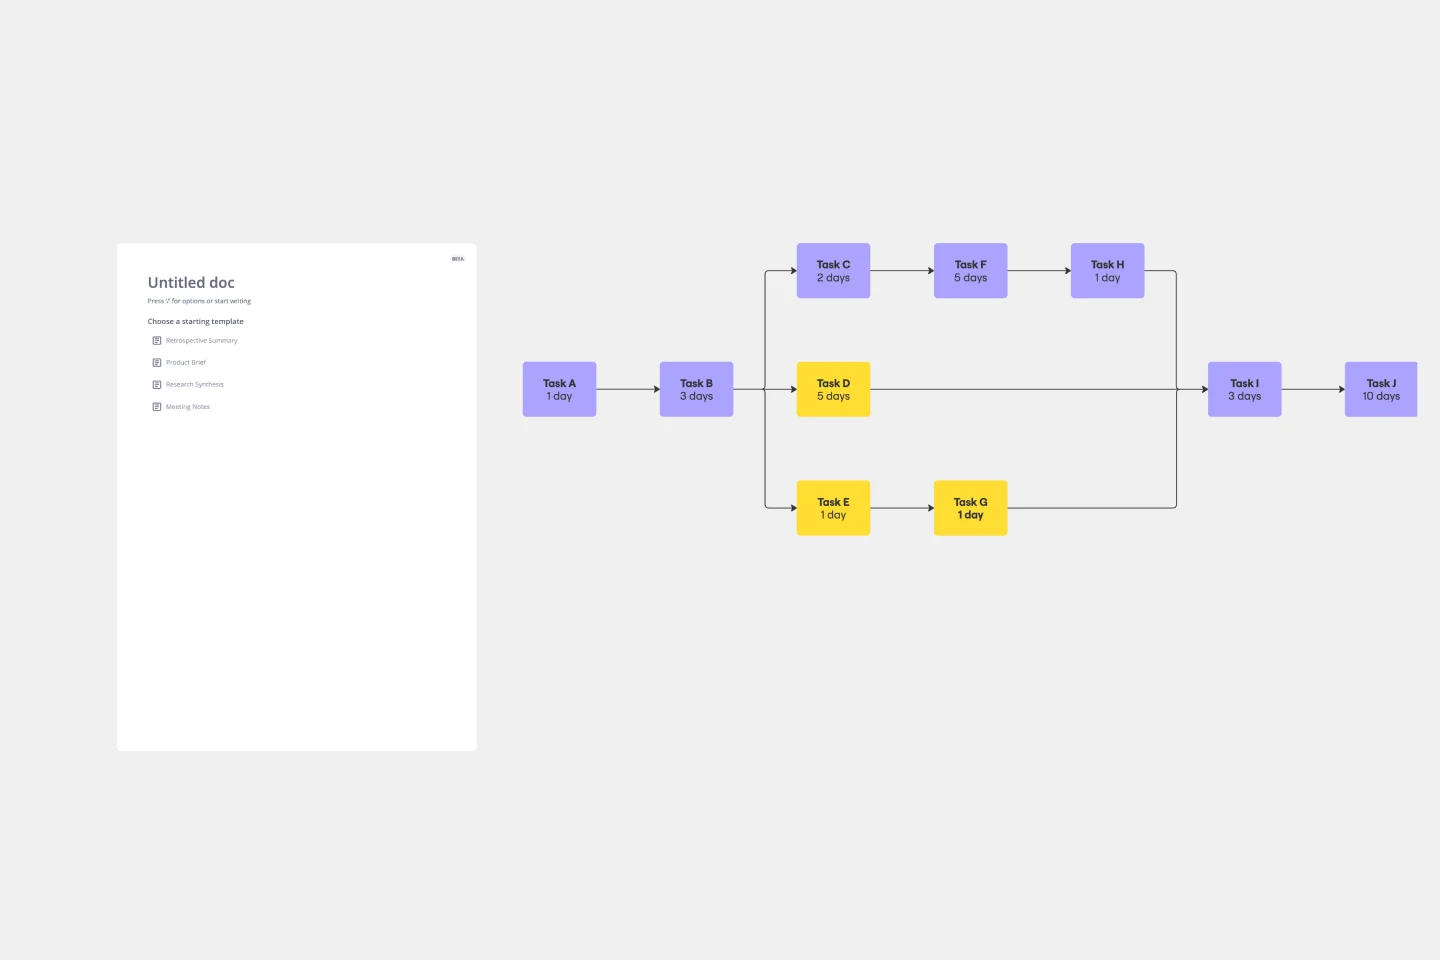
Critical Path Method Template
Works best for:
Diagramming, Project Management
Elevate your project management game with the Critical Path Method Template—an indispensable tool that brings clarity and precision to your project timelines. The template instantaneously adjusts as you edit tasks and dependencies, ensuring that your critical path is consistently up-to-date. This capability not only simplifies the complex process of project scheduling but also empowers your team to proactively respond to evolving project dynamics, fostering adaptability and efficiency throughout the project lifecycle.
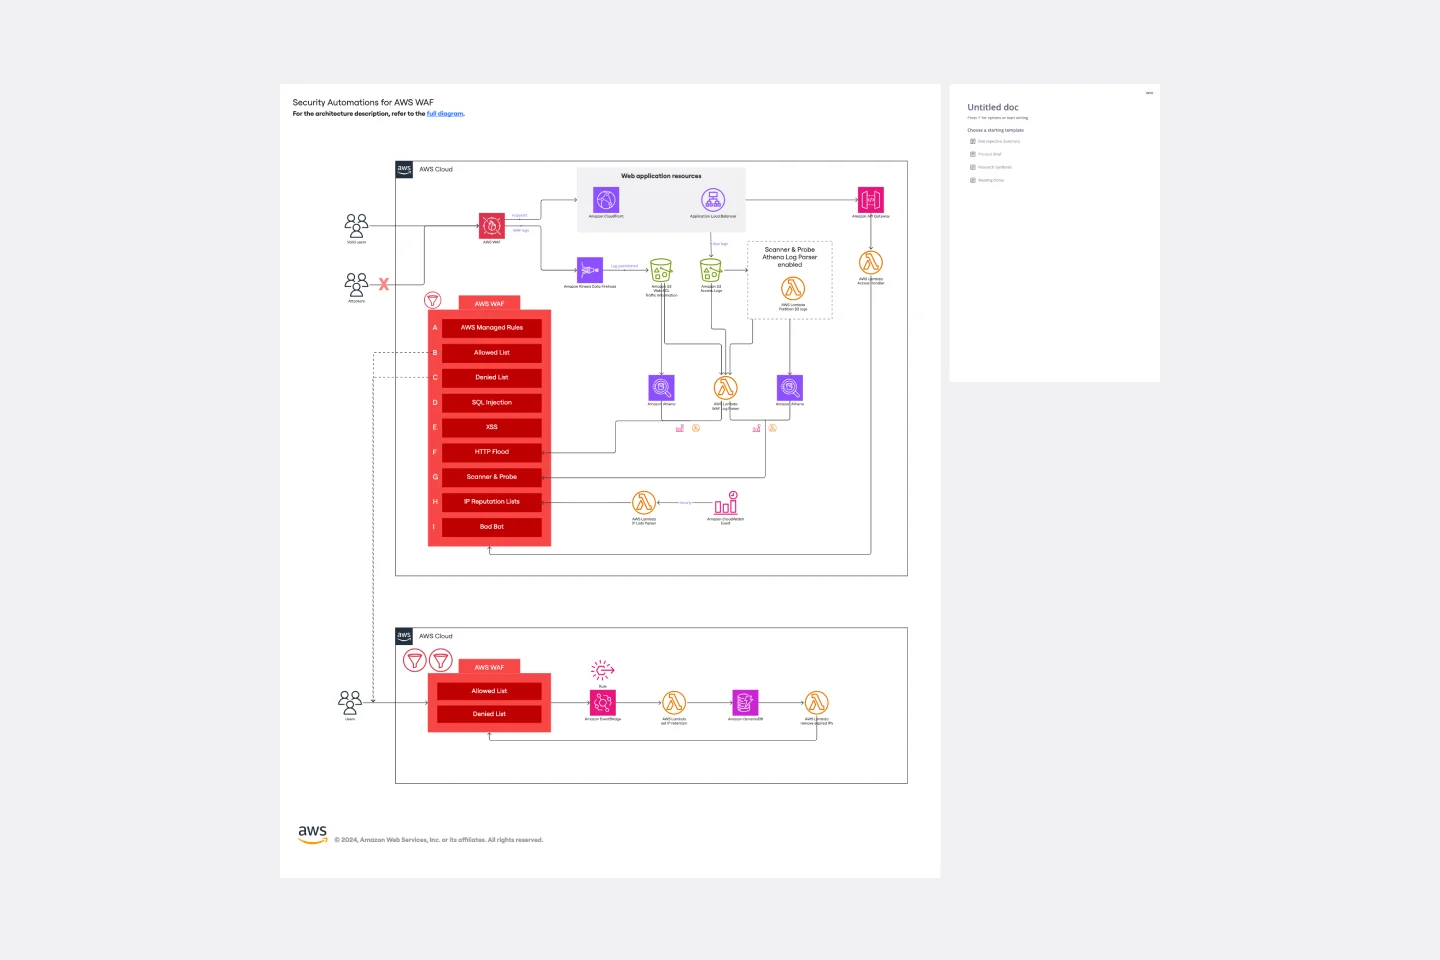
Security Automations for AWS WAF Template
The Security Automations for AWS WAF template is designed to streamline the process of enhancing the security of your AWS applications. It allows teams to collaboratively design, visualize, and refine AWS WAF configurations to protect against common web exploits effectively. This template includes various components such as automated deployment pipelines, instance schedulers, and serverless image handlers, providing a robust framework for managing AWS WAF security automations. By using this template, teams can improve collaboration, achieve a clear visual representation of their AWS WAF configurations, enhance efficiency in managing AWS WAF rules, and customize the template to meet specific application security needs.
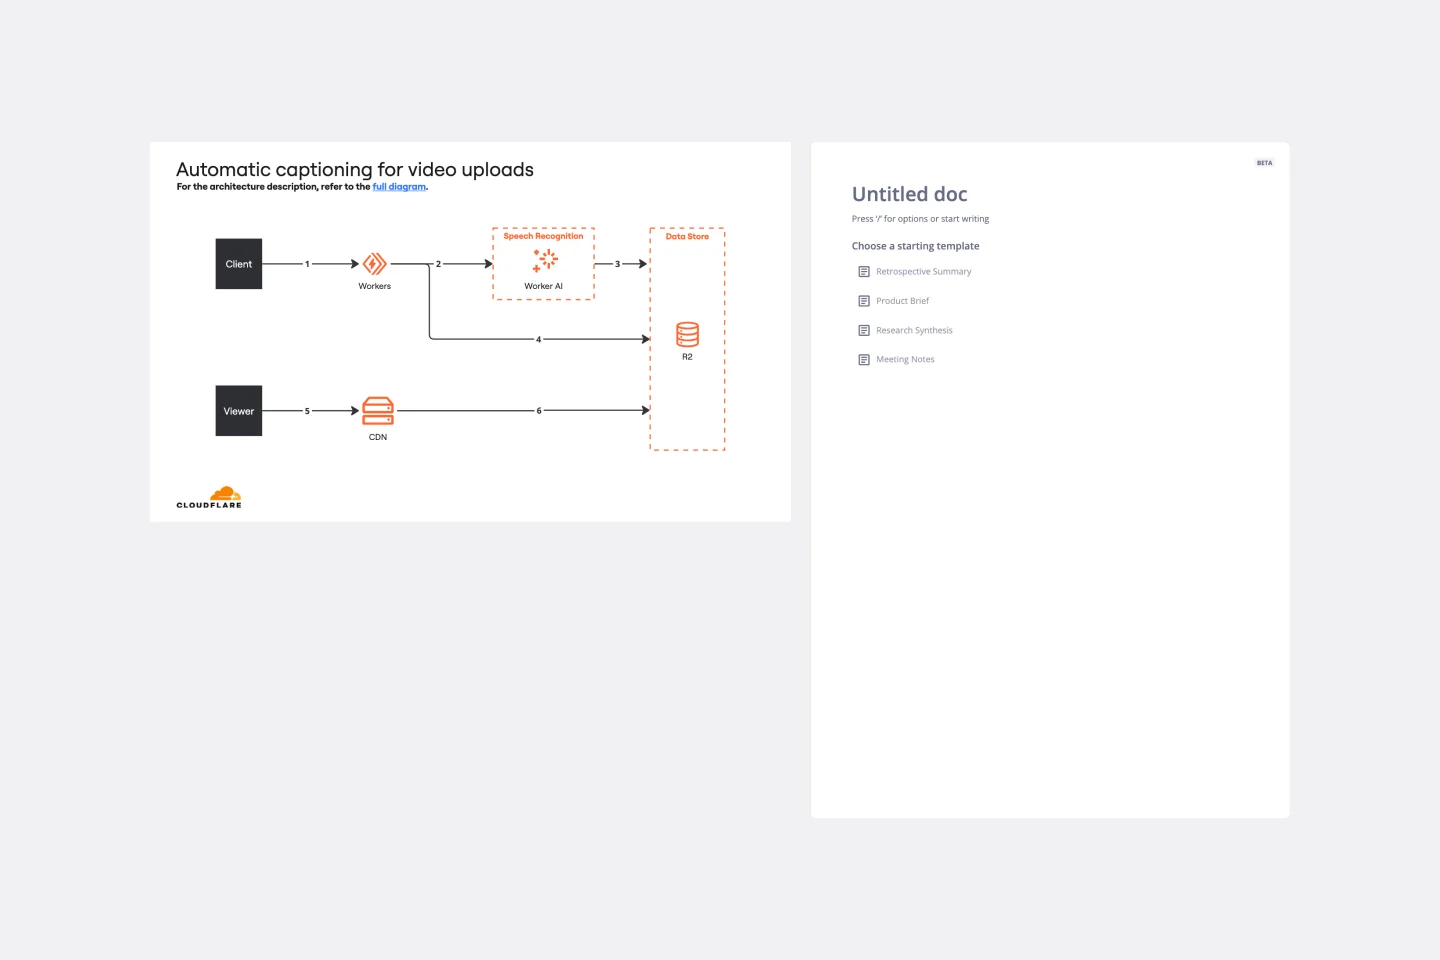
Cloudflare Automatic Captioning for Video Template
The Cloudflare Automatic Captioning for Video Template in Miro is a powerful tool designed to enhance the accessibility and engagement of video content. By leveraging Cloudflare's technology, this template helps outline the captioning process for videos. It not only makes content accessible to a broader audience, including those who are deaf or hard of hearing but also boost viewer engagement by making videos consumable in sound-sensitive environments or by individuals who prefer reading along.
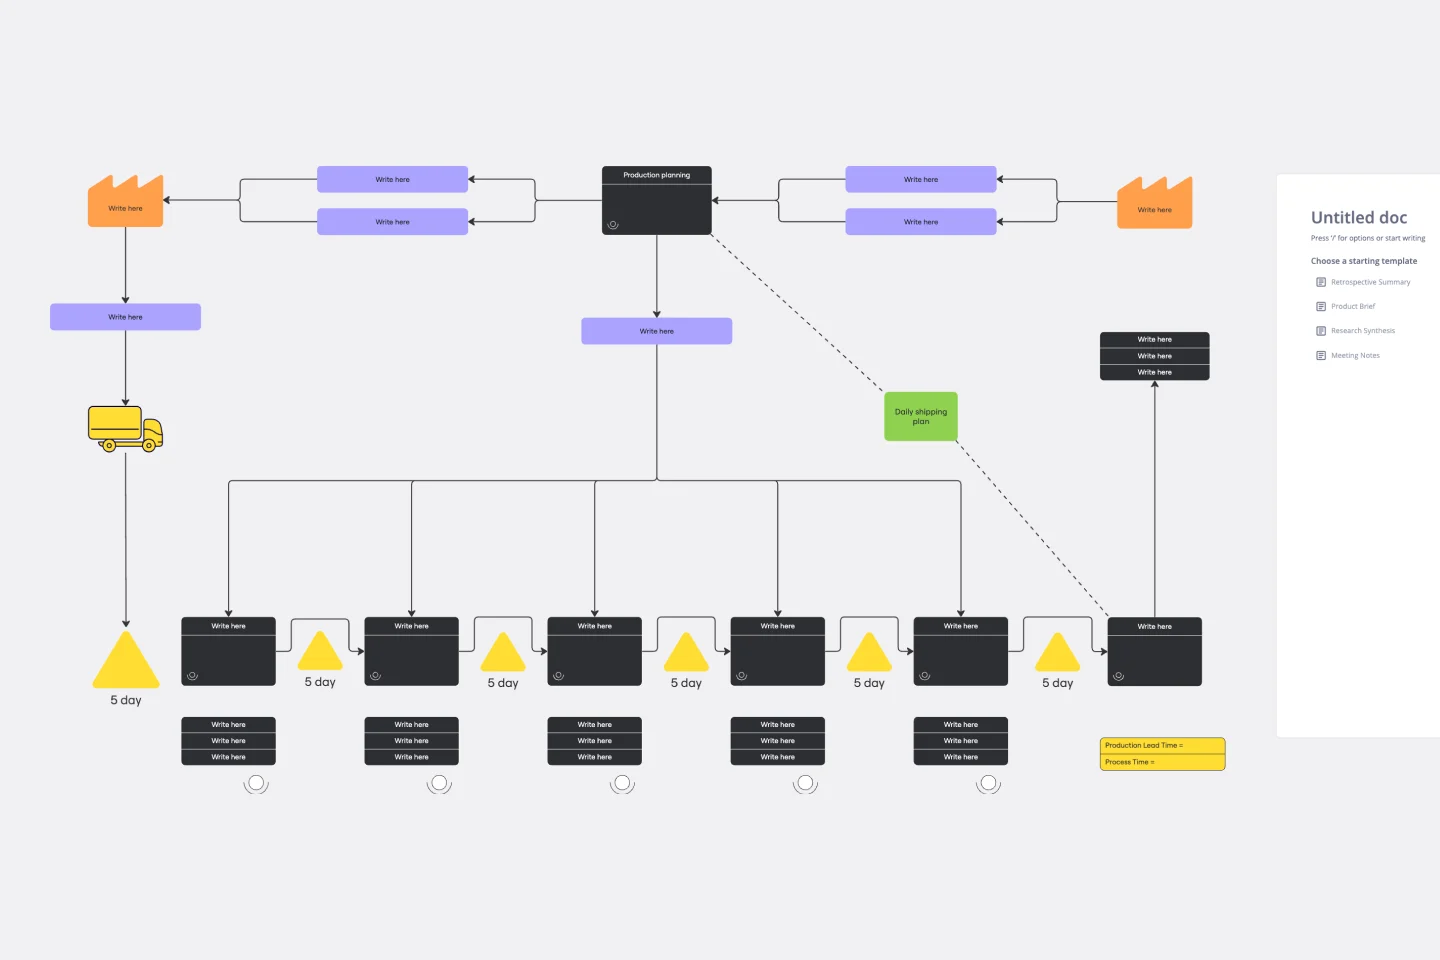
Value Stream Mapping Template
Works best for:
Project Management, Strategic Planning, Mapping
A value stream map can help you refocus your business on steps that actually provide value to your customers, cutting out wasteful and inefficient processes. With this template, you and your process team can collaborate on a value stream map today.
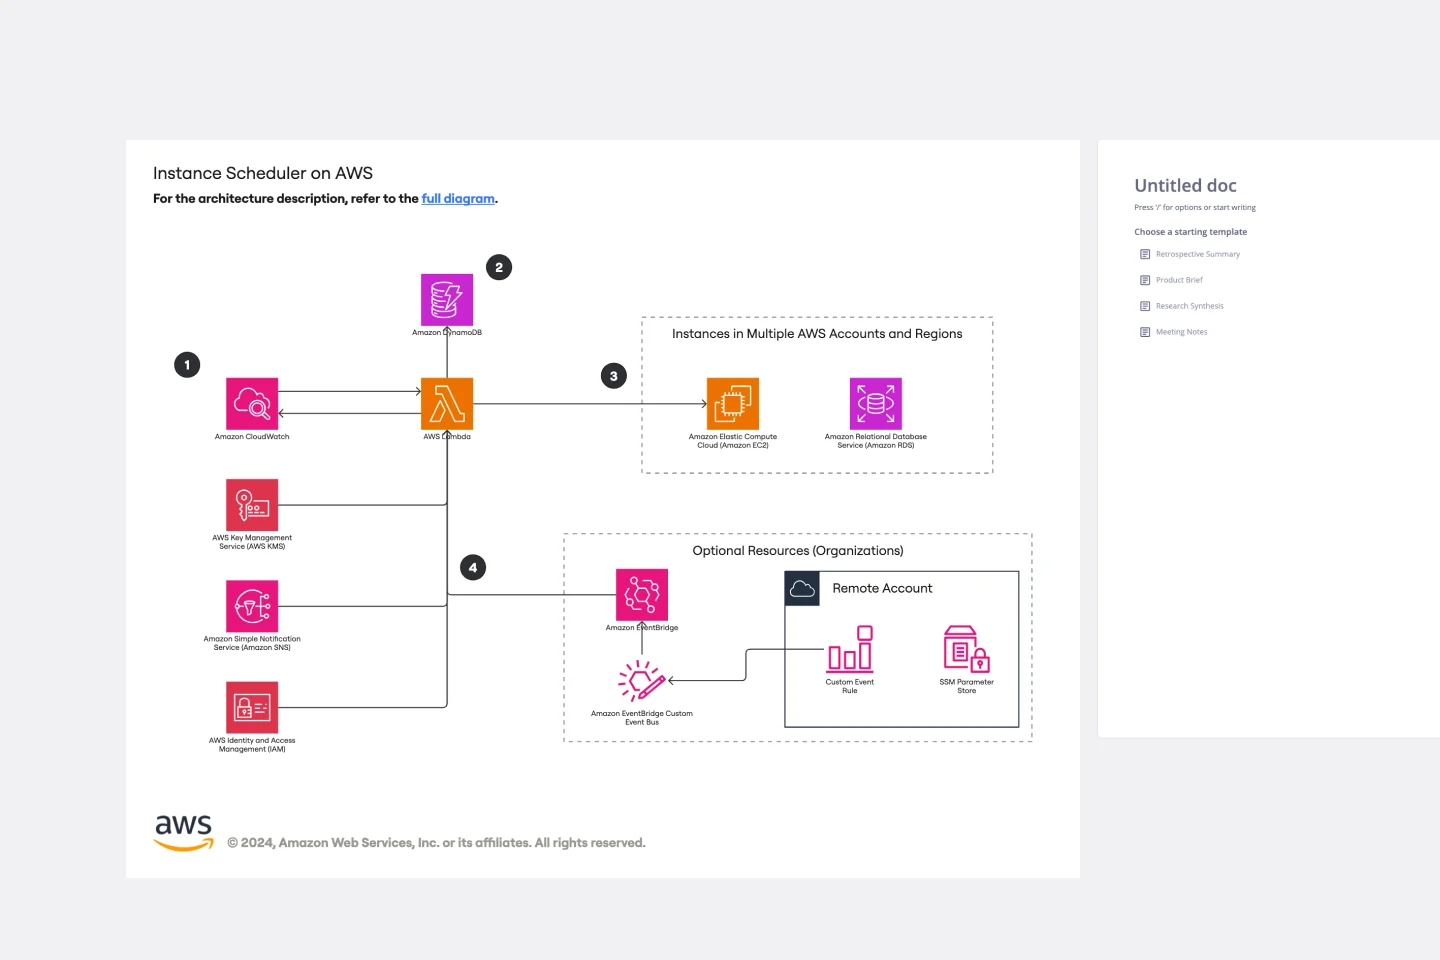
Instance Scheduler on AWS Template
Works best for:
AWS
The Instance Scheduler on AWS template is a strategic tool designed to enhance the efficiency and cost-effectiveness of managing AWS resources. It serves as a guide for automating the scheduling of Amazon EC2 and Amazon RDS instances, ensuring that these resources are operational only when necessary. This approach not only simplifies the management of instance schedules but also significantly reduces cloud computing costs by avoiding unnecessary runtime.
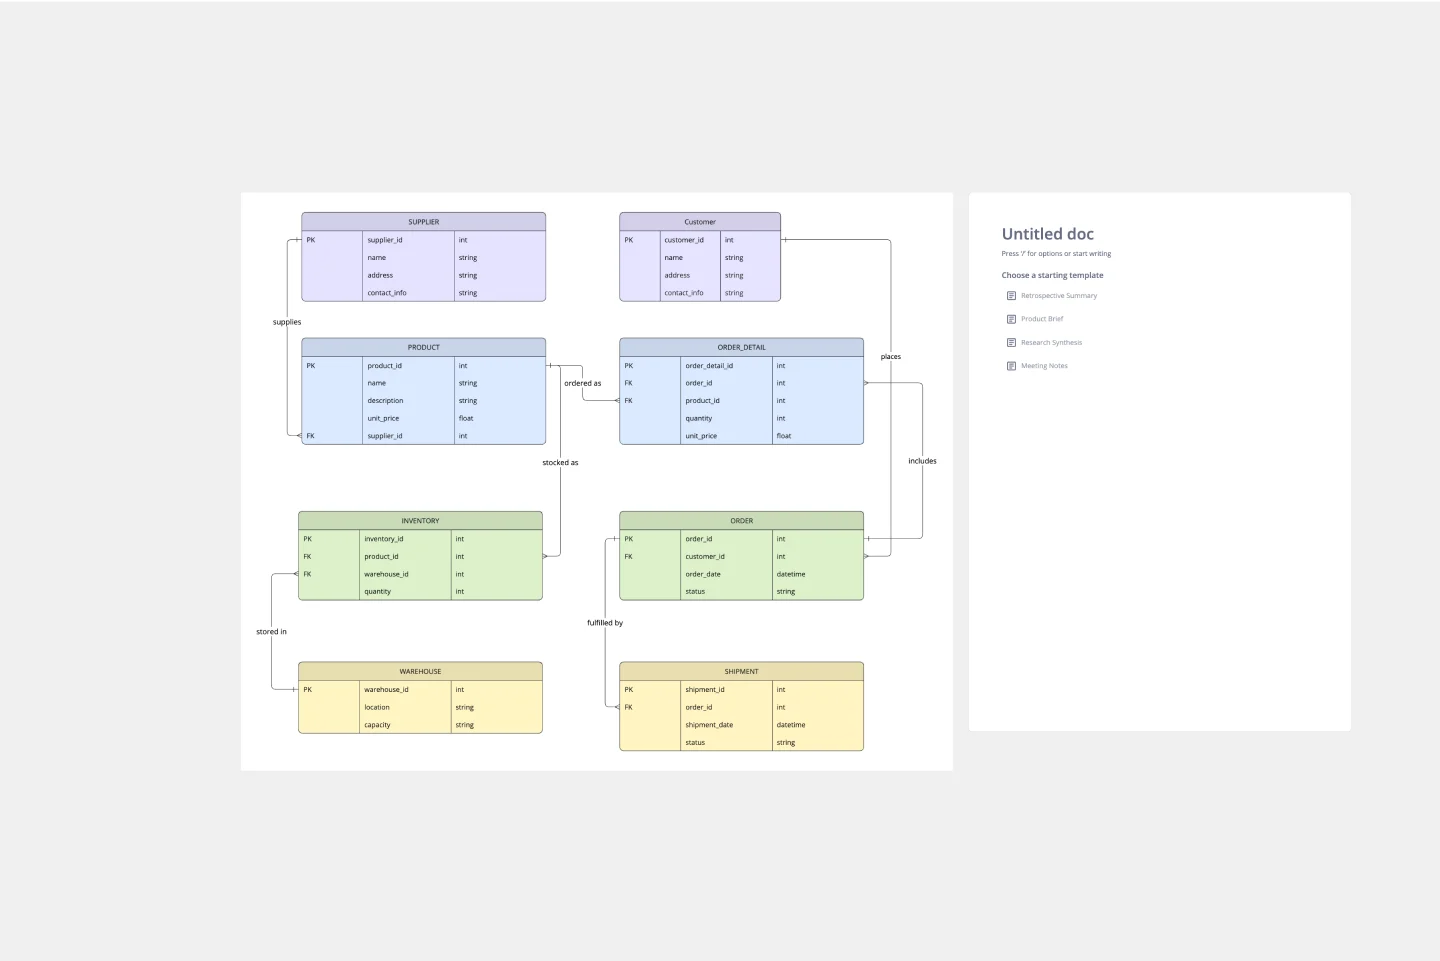
ERD Supply Chain Management System Template
Works best for:
ERD
The ERD Supply Chain Management System Template streamlines and optimizes supply chain operations. It serves as a visual support that helps businesses understand and manage the complex relationships between different entities within their supply chain, such as suppliers, products, inventory, orders, and shipments. By providing a clear visualization of these relationships, the template enables users to identify inefficiencies and areas for improvement, facilitating strategic decision-making.