Infographic Template
Display information visually and create engaging and eye-catching presentations with an infographic template.
About the Infographic Template
Every day, we’re surrounded and inundated by data. Whether you’re part of a business, a nonprofit, or an organization, you might find it difficult to get your readers, customers, and prospects interested in more data. How can you persuade them to pay attention to dry facts and statistics?
An infographic could be just what you need.
What is an infographic?
An infographic is a visual tool for communicating information. They allow you to turn quantitative or qualitative data into stories that resonate. Use them to give an overview of research findings, showcase survey data, raise awareness of an issue, summarize a topic, and much more.
Most infographics use some combination of text and visuals to break down a complicated topic. For example, you could create an infographic to visualize the customer journey. It’ll have text and images throughout the graphic, allowing the reader to easily digest the information. The best ones are creative and visually striking, catching the reader’s eye so that they’re eager to learn more.
In general, infographics don’t contain much text. Instead, they employ various infographic elements such as images, charts, and graphics to help the audience understand a topic. Graphic designers use infographics to help tell complex stories in a more accessible way than if described by words alone.
What is an infographic template?
When you have a lot of information, it’s hard to figure out how to present it. You want it to be easy to follow and engaging, but you don’t want to miss out on the essential figures and statistics.
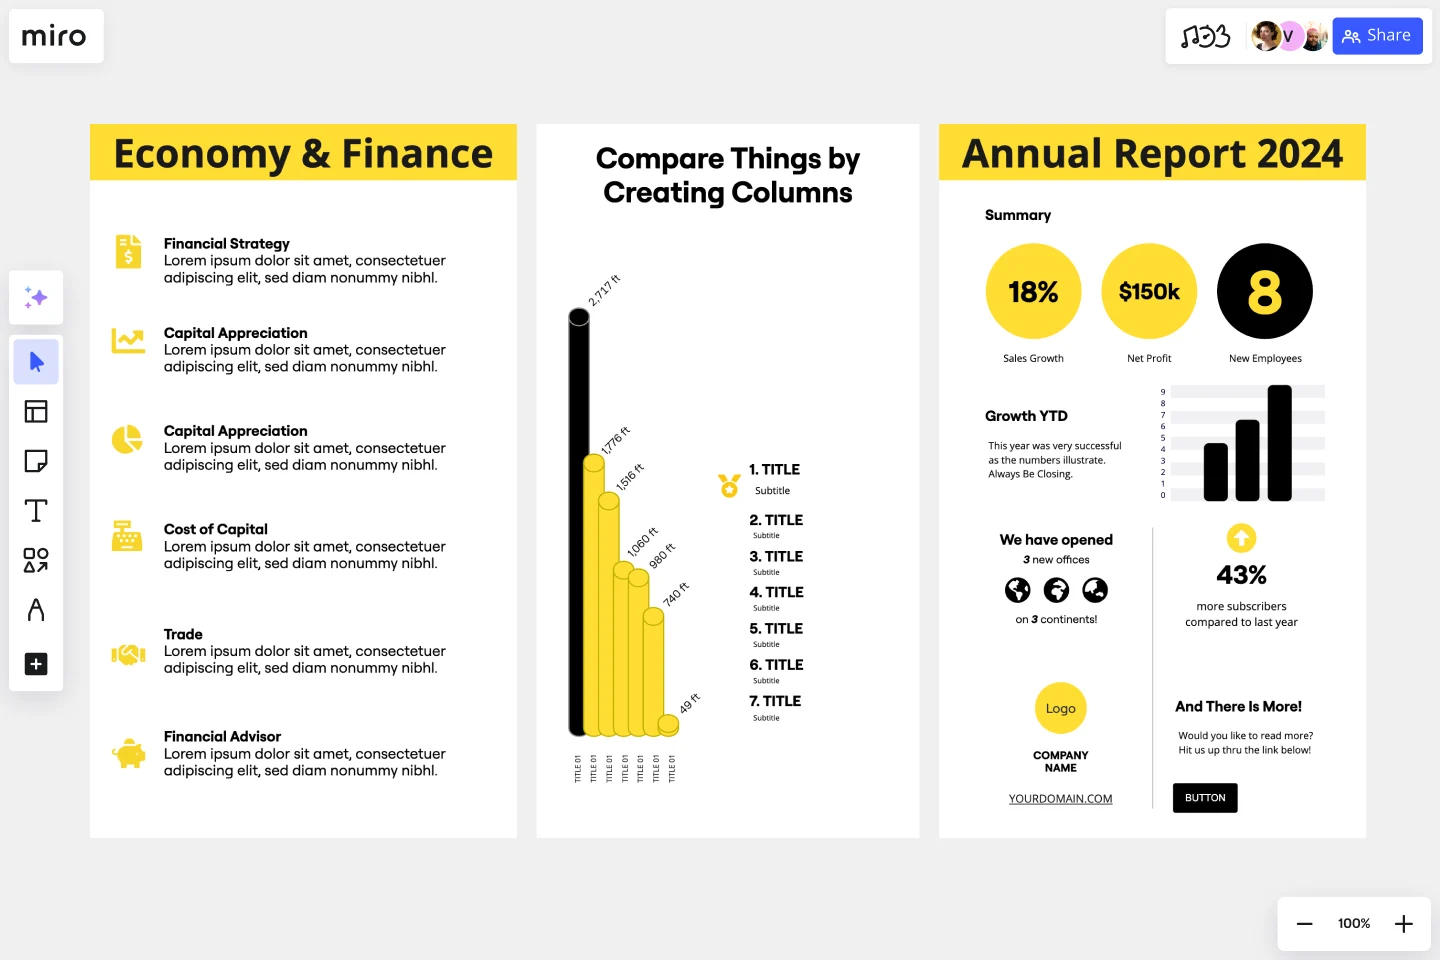
With our infographic template, you can create striking visuals for your audience that present data in a digestible way. You’ll be able to reduce complex ideas into a simple and engaging infographic using text, images, and charts. The infographic template has a lot of customization options, so you can create an infographic that’s on brand and structured exactly how you want.
Create an infographic with Miro
Making an infographic is easy with Miro. It’s the perfect canvas to create and share infographics with your team and external parties. And don't worry, you don’t need any design skills to create a high-quality infographic. Start by selecting this infographic template, then take the following steps to create your own.
1. Determine your key takeaways. Teams create infographics to distill a lot of quantitative or qualitative information, like survey data or industry stats. But readers who are exposed to too much data at once tend to miss the point. What do you want your audience to get out of the infographic? Take some time to decide on three to five main points that you’d like your audience to remember to make sure your infographic has clear takeaways that are easy to remember.
2. Decide on the story you want to tell. While your key takeaways are important, they’re not the full story. The goal of an infographic is to guide your reader through a narrative, connecting the dots from your data to your thesis. Weave your three to five main points into a narrative to get your point across and create a memorable infographic.
3. Draft the copy. Once you’ve decided on a narrative, it’s time to write the text that will support your visuals. The text should support the visuals to develop the story of your stats. Keep it short and concise to avoid overwhelming the reader with too much text.
4. Design the infographic. Now it’s time to use the ready-made template for your infographic design. The template makes it easy to create an infographic, even if you’re not working with a design team or you don’t have any design experience. Simply choose your design elements, pick your color scheme, update the text, and select the design icons to make your own version.
5. Revise and iterate. As you work on the text, you’ll have a better idea of what you want the infographic to look like. And as you design the images and charts, you’ll have further opportunities to sharpen and refine your text. Keep iterating until you’ve got a clear, cohesive story in a stunning infographic.
When to use infographics
Infographics are highly adaptable for any organization. But when exactly should you think about using them?
Here are a few common examples:
To summarize a complex topic. Infographics present complex topics and datasets in an accessible way. For example, a sales manager could use an infographic to present sales stats to their team in an engaging format. It makes the stats easy to understand and helps the sales team wrap their heads around what it means for their day-to-day work.
To make information visual. Some information works better in a visual format. For instance, a lot of marketing teams use infographics to liven up survey data or present quantitative information in ad campaigns.
To help customers or clients. Businesses can use infographics to present information to customers or clients. An example might be a “why work with us” infographic. The visual will outline the key USPs of working with the business in a visual and engaging format. An infographic like this will usually sit within a blog post on a company website and in social media posts.
To raise awareness. Infographics are eye-catching, which is great if you want to raise awareness about a certain topic. For example, nonprofits could use infographics to raise awareness about complicated or systemic issues.
Where can I get free infographic templates?
There are a lot of platforms that offer free infographic design templates — including Miro. Our online whiteboard is free to use and fully customizable. In addition to our free infographic template, you’ll also get access to a variety of templates and collaborative features. You can host workshops and brainstorming sessions and even plan your next strategy.
What is an infographic for?
An infographic is used to present data visually in a simple, clear and concise way. It combines images, graphics, icons and even diagrams that facilitate understanding and with a simple glance, the reader can understand and assimilate what is being presented.
What are the elements of an infographic?
As a general rule, an infographic should have at least the following elements: title, images, text, sources, and branding. Ideally, the title and text should be brief and straightforward, and images should support your written content. Remember always to mention your data source once infographics are all about visually displaying data. At last, your infographic should reflect your brand, so everyone knows you created it.
Why should I use infographic templates?
Using templates for infographics will help you make them faster because you don't have to design them from scratch. Anyone without any design knowledge can create one because you just have to modify the data as needed and in Miro you can do it in a very intuitive and effective way.
Get started with this template right now.
Go-to-Market GTM Template | Miro
Works best for:
Marketing, Desk Research, Strategic Planning
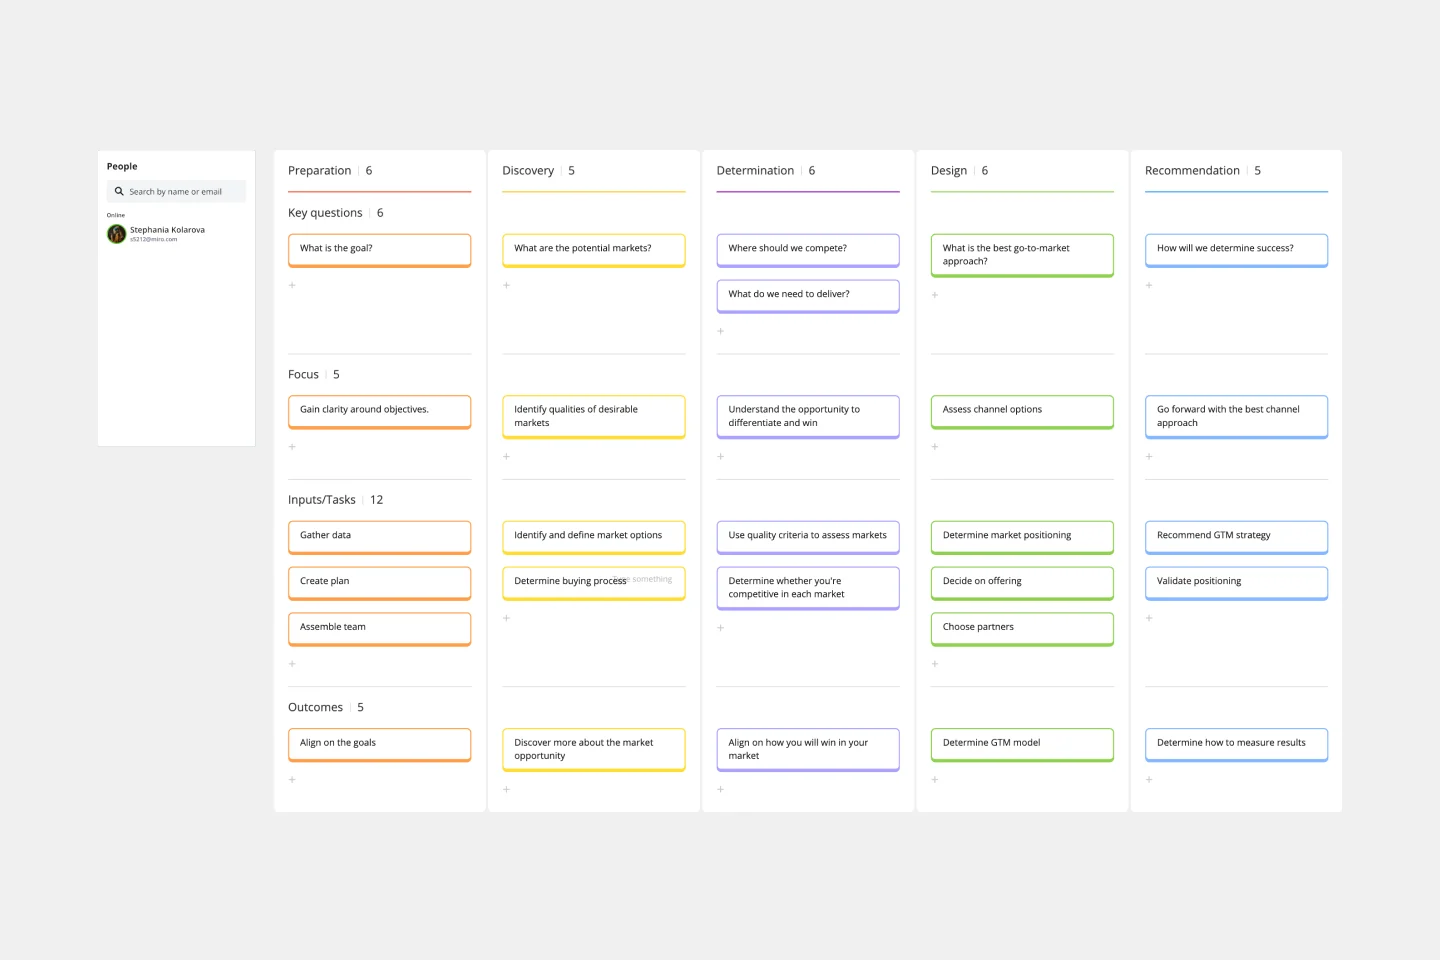
It doesn’t matter how innovative or effective a new product is — if it doesn’t get noticed and adopted by the right audience, the product won’t get off the ground. That’s where your Go-to-Market Strategy comes in. It’s a single resource that houses all of your research, insights, and data, and includes your business plan, target audience, marketing approach, and sales strategy. A GTM is especially important for any startups who grow fast, have to make split-second decisions, and have to be fully in sync.
Google Cloud Architecture Diagram Template
Works best for:
Software Development, Diagrams
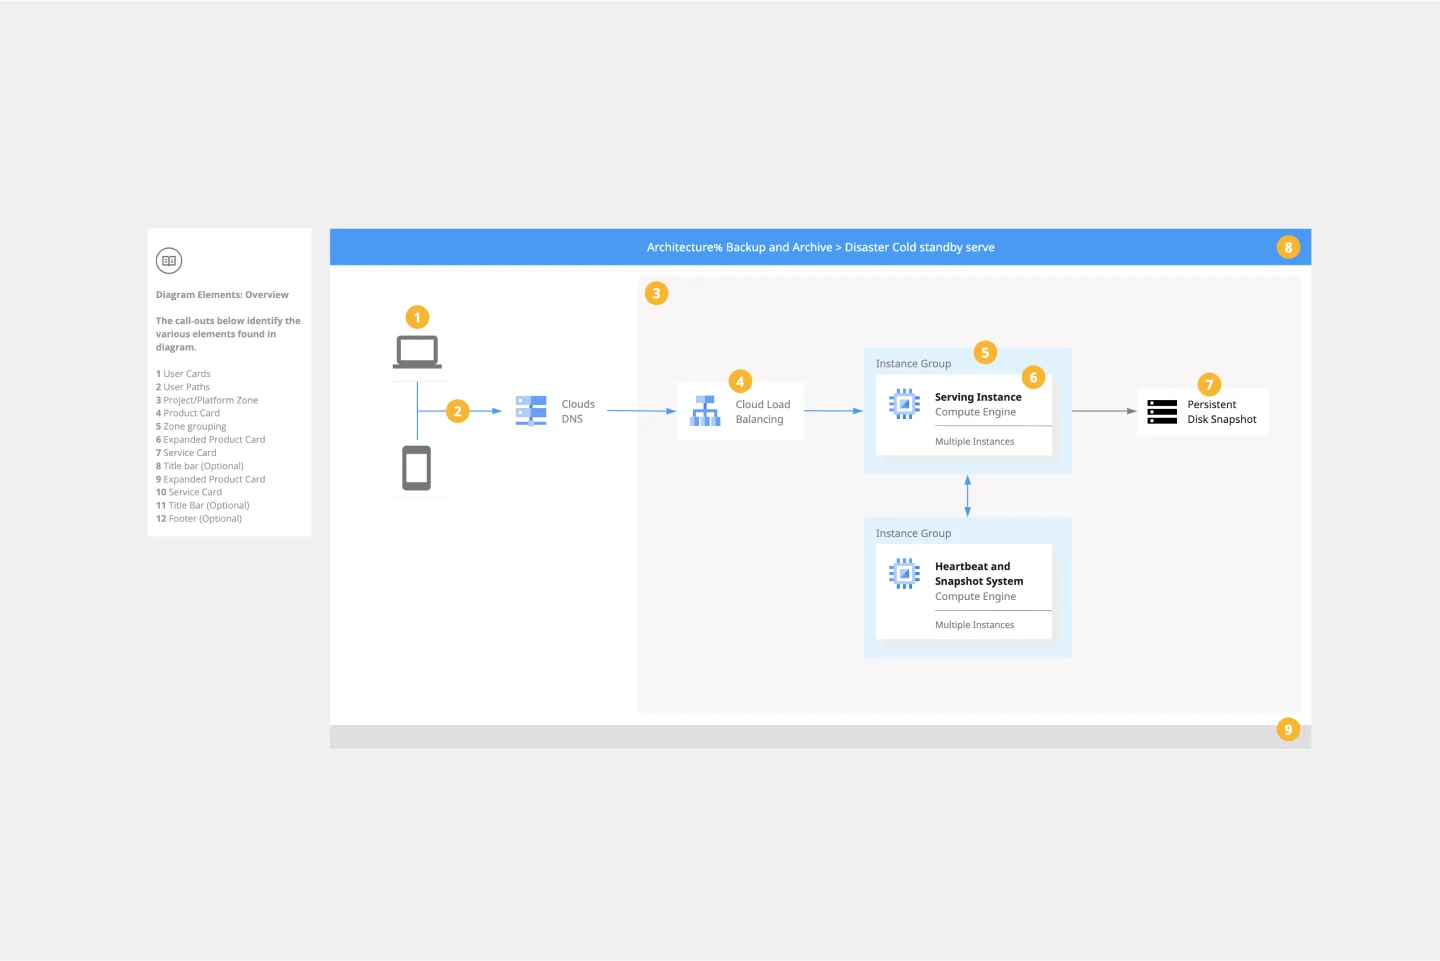
Use the Google Cloud Architecture Diagram template to clearly visualize the deployment of your application and allow you and your team to optimize processes. The GCP template gives you a great overview of your application architecture, and it helps you to iterate quickly and better manage your application development, deployment, and documentation. Try it out and see if it works for you.
Product Roadmap by Mark V. Smetanin
Works best for:
Product Management, Roadmap
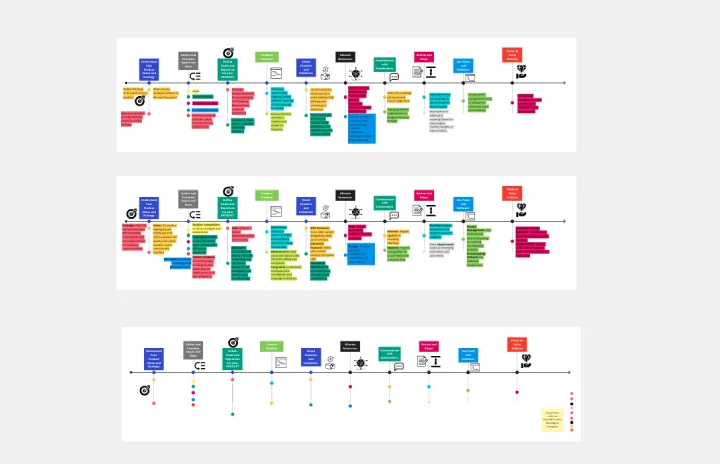
Learn to craft effective product plans with the How to Create Product Roadmap by Mark V. Smetanin. This template guides you through outlining key milestones, setting priorities, and visualizing your product journey. Use it to align your team, maintain focus, and achieve strategic goals. Ideal for product managers and teams looking for a structured approach to product development and clear communication with stakeholders.
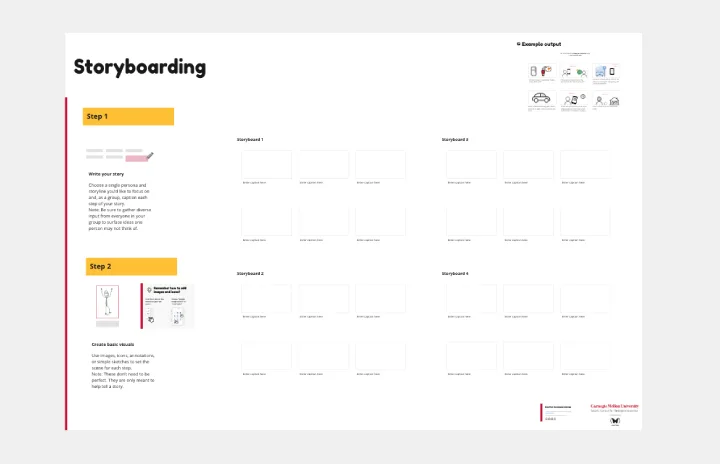
Storyboards by maad labs
Works best for:
Storyboard, Planning, Design
Simplify your story creation process with Storyboards by maad labs. This template offers a user-friendly interface for mapping out your narrative projects, making it ideal for both beginners and seasoned professionals. It includes sections for scene descriptions, character notes, and dialogue, helping you to organize your ideas and present them clearly. Use this template to enhance your storytelling workflow and bring your creative visions to life with ease
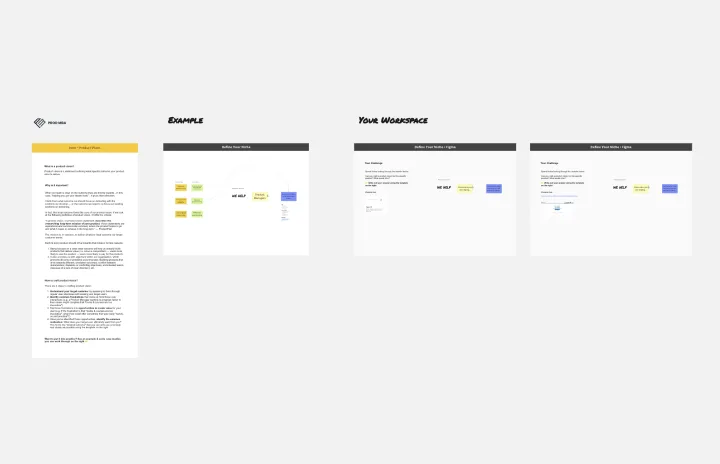
Define A Winning Product Vision
Works best for:
Product Management, Planning
The Define A Winning Product Vision template assists product teams in articulating compelling visions for product development. By defining goals, target markets, and differentiation strategies, this template aligns teams around a shared vision for success. With sections for outlining product features, benefits, and value propositions, it communicates the essence of the product effectively. This template serves as a guiding light for product development efforts, inspiring creativity and focus as teams work towards bringing the product vision to life.
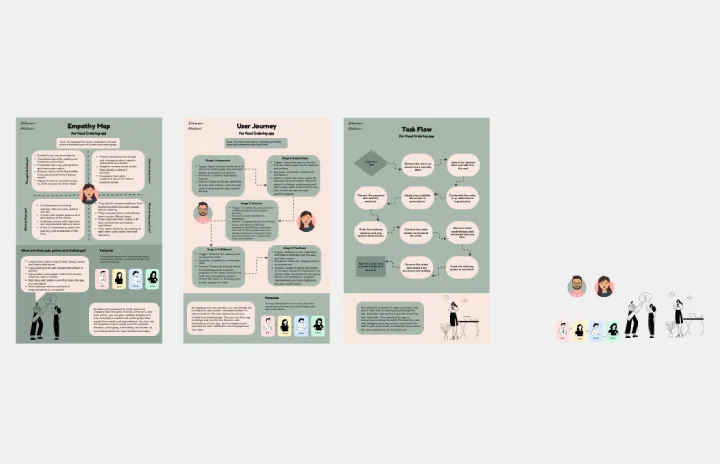
Empathy Map for Food Ordering App
Empathy Map template aids in visualizing your users' experiences. It helps teams understand what users see, think, and feel, ensuring your product meets their needs. This tool is essential for building empathy and designing better user experiences.