Google Cloud Architecture Diagram Template
Visualize the deployment of your applications with Google Cloud Architecture Diagram template and optimize your processes.
Available on Enterprise, Business, Education plans.
About the Google Cloud Architecture Diagram Template
A Google Cloud Architecture Diagram template is where you can visually represent and manage application development, deployment, and documentation. You can use this Google Cloud Architecture Diagram template to stay in sync with your team, have an excellent application architecture overview, and quickly iterate if needed.
Keep reading to learn more about the Google Cloud Architecture Diagram Template.
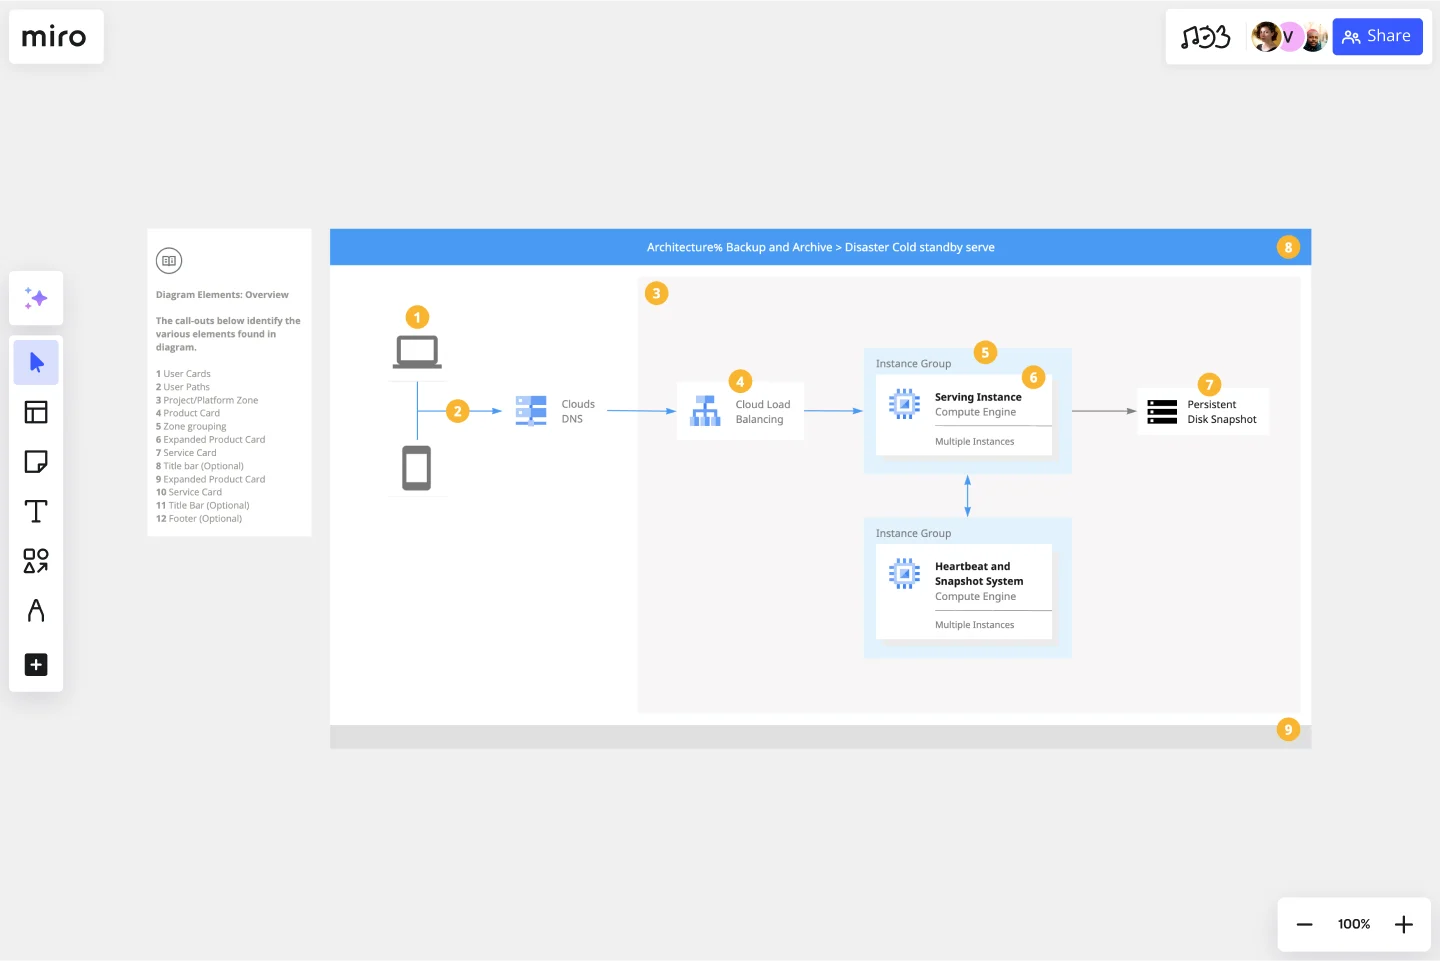
GCP Architecture diagram for network optimization
Developers and IT managers use the Google Cloud Architecture Diagram template to make changes and accurately document the network infrastructure.
The GCP Architecture Diagram also allows people to quickly understand your Google Cloud architecture’s network design and operation, facilitating communication across your organization.
How do I create a Google Cloud Architecture Diagram template?
A Google Cloud Architecture Diagram template allows you to visualize the management of apps.
To create a basic Google Cloud Architecture Diagram template with Miro, you can follow these steps:
List your Google Cloud Architecture components, using our set of Google Cloud Icons.
Organize your diagram by adding in the components of the network.
Add connection lines between the component shapes and set the arrows in the direction of the flow.
Format and customize your Google Cloud Architecture Diagram template with shapes and frames.
In Miro, you can quickly build a GCP Diagram from scratch using our design tools and icons set, or use our Google Cloud Architecture Diagram template and customize it as you see fit.
Other than Google Cloud Platform (GCP), Miro has icons for AWS, Azure, Cisco, and many more, making Miro the perfect cloud and network diagramming tool for you and your team.
What is Google Cloud Platform used for?
The Google Cloud Platform is used to make network management and development of network infrastructure accessible and flexible, allowing organizations to create cloud-native apps and manage and analyze data quickly. The Google Cloud Platform helps you navigate many services categories from computer networks to storage and database.
How do I draw a Google cloud architecture?
There are many ways you can draw a Google Cloud Architecture Diagram with Miro. You can either use our template or draw your GCP diagram from scratch. Follow these steps to draw your Google Cloud Architecture Diagram in Miro: select which GCP icons to use for your diagram from Miro’s Google Cloud Platform component library. Next, use connector lines and other shapes to outline and describe your network, and lastly, add arrows to represent the flow of information.
Get started with this template right now. Available on Enterprise, Business, Education plans.
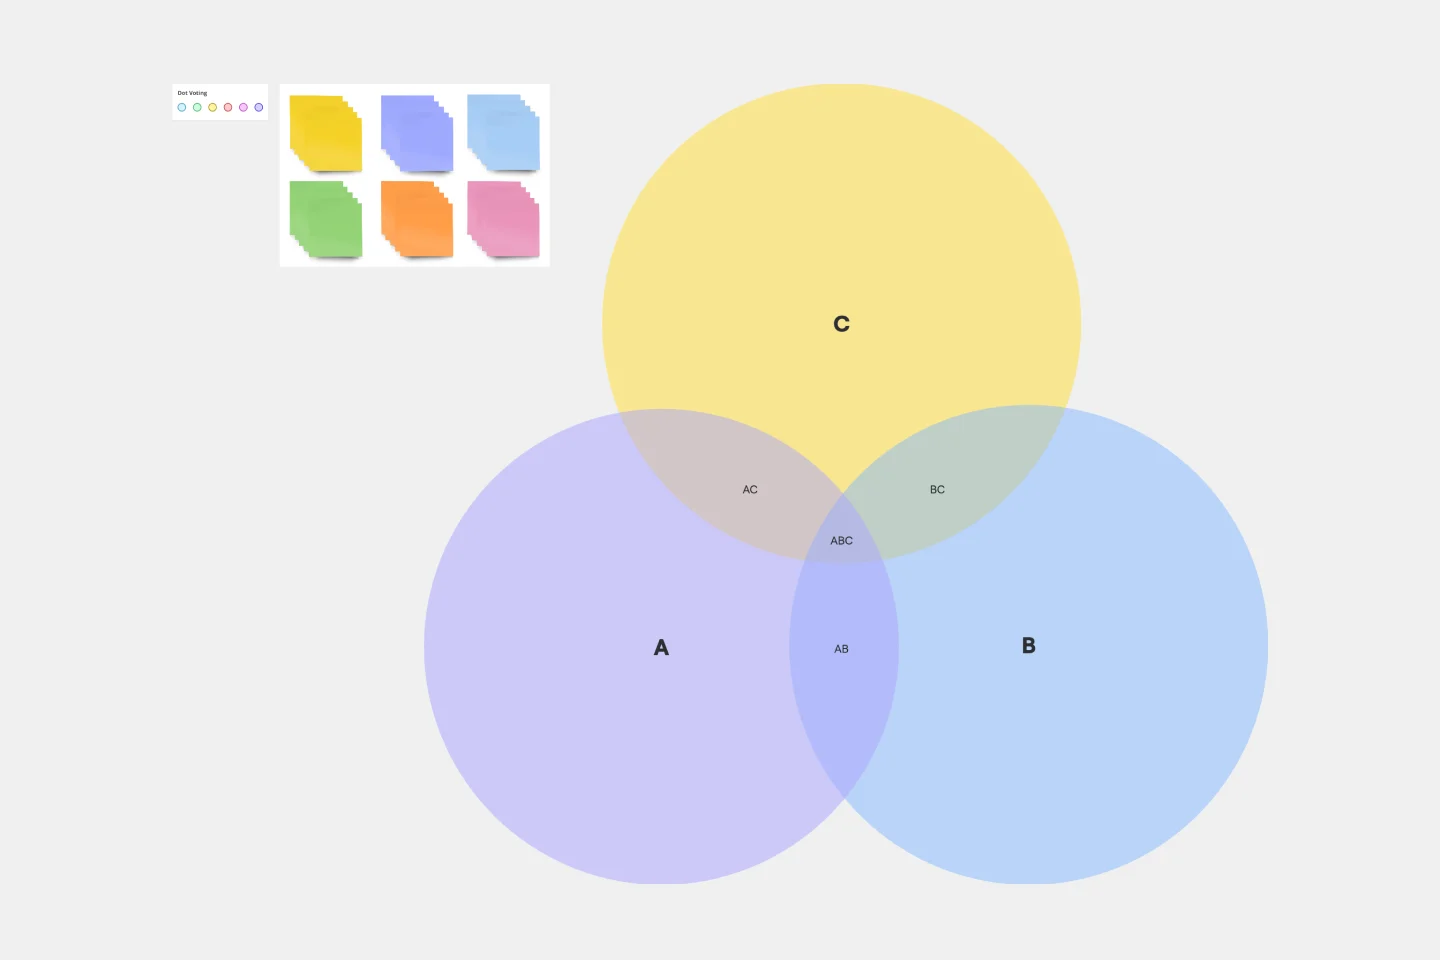
3-Circle Venn Diagram
Works best for:
Education, Diagrams, Brainstorming
Venn diagrams have been a staple of business meetings and presentations since the 1800s, and there’s a good reason why. Venn diagrams provide a clear, effective way to visually showcase relationships between datasets. They serve as a helpful visual aid in brainstorming sessions, meetings, and presentations. You start by drawing a circle containing one concept, and then draw an overlapping circle containing another concept. In the space where the circles overlap, you can make note of the concepts’ similarities. In the space where they do not, you can make note of their differences.
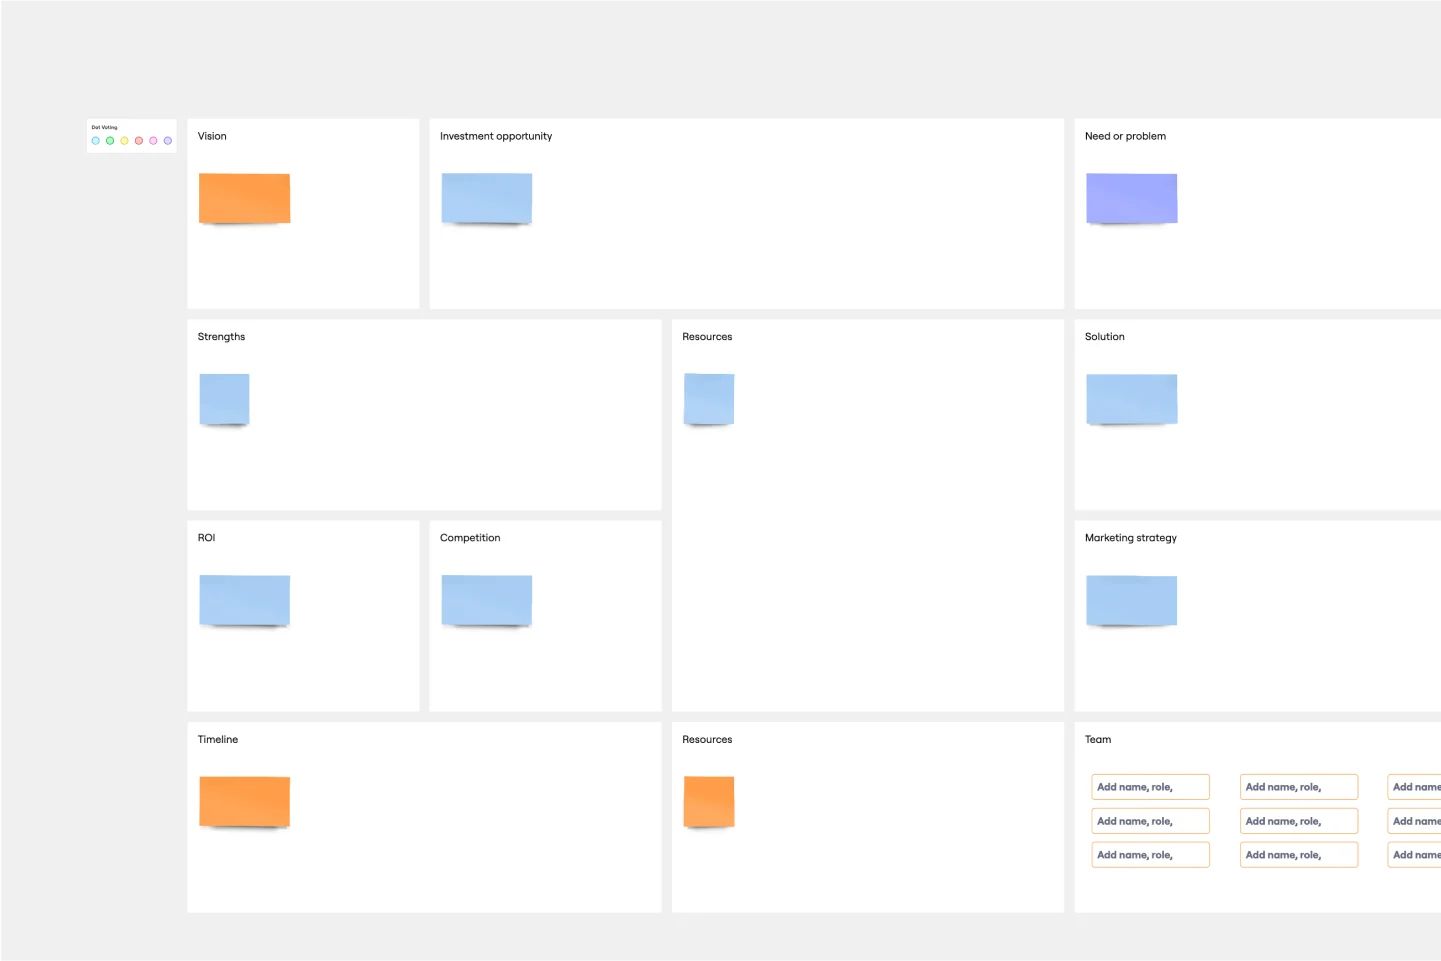
Executive Summary Template
Works best for:
Leadership, Project Management, Documentation
Pique their curiosity. Get them excited. Inspire them to keep reading, diving further into your proposal details. That’s what a good executive summary has the power to do—and why it’s a crucial opening statement for business plans, project plans, investment proposals, and more. Use this template to create an executive summary that starts building belief, by answering high-level questions that include: What is your project? What are the goals? How will you bring your skills and resources to the project? And who can expect to benefit?
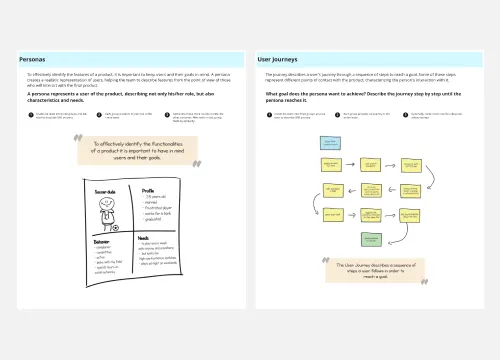
Lean Inception Workshop
Works best for:
Agile, Lean Methodology
The Lean Inception Workshop streamlines project kickoff by aligning teams on goals, scope, and priorities. It leverages Lean principles to eliminate waste and maximize value, guiding exercises to define user personas, map user journeys, and prioritize features. By fostering cross-functional collaboration and customer-centric thinking, this template accelerates project initiation and ensures alignment between stakeholders, empowering teams to deliver customer value faster.
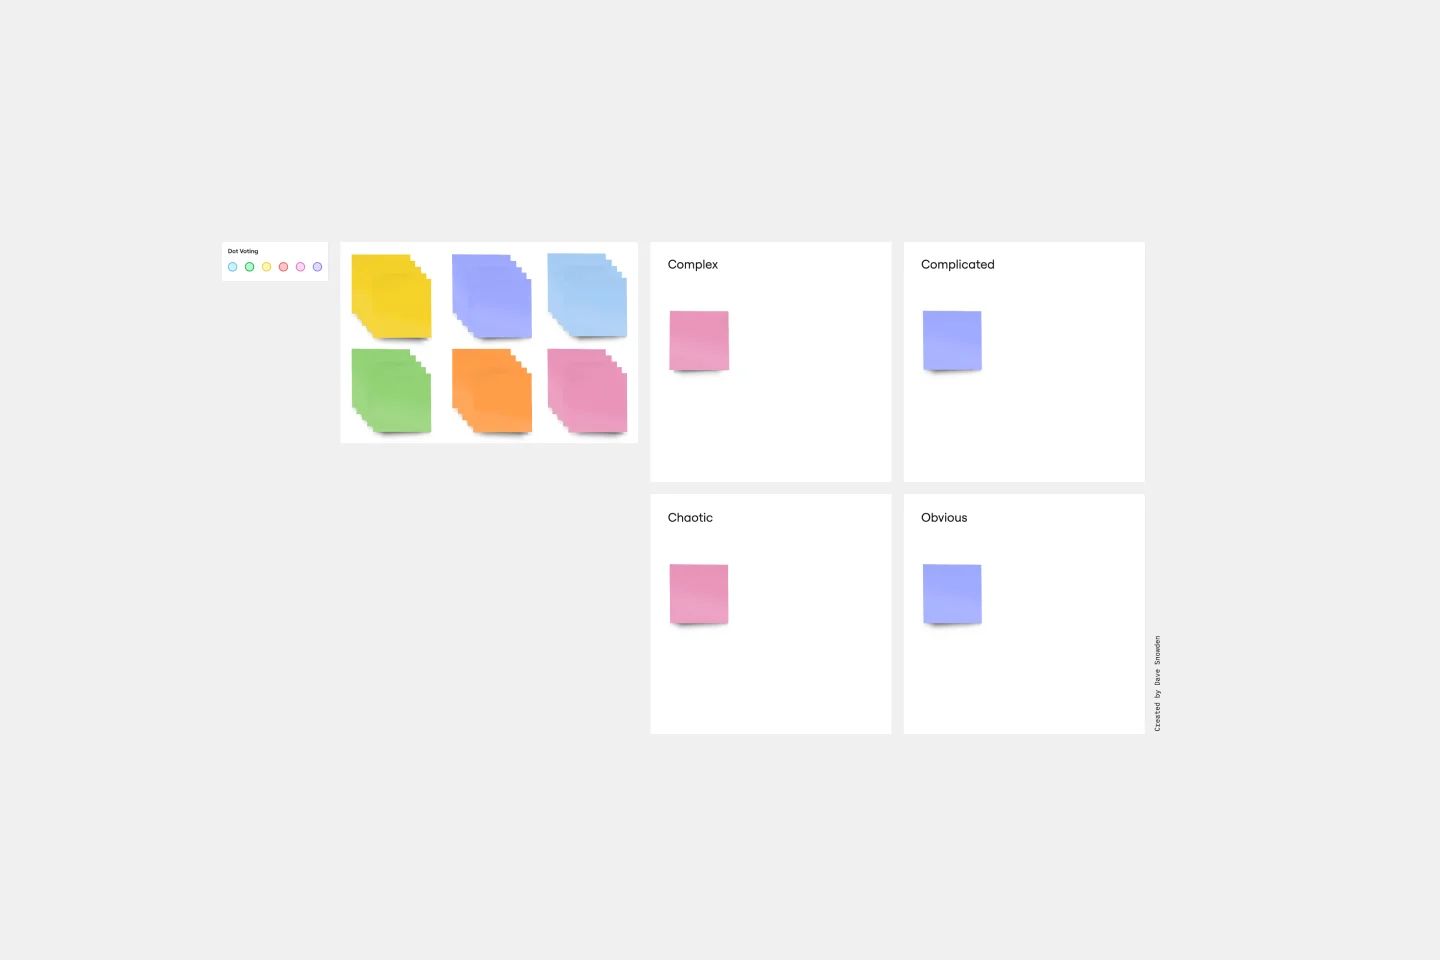
Cynefin Framework Template
Works best for:
Leadership, Decision Making, Prioritization
Companies face a range of complex problems. At times, these problems leave the decision makers unsure where to even begin or what questions to ask. The Cynefin Framework, developed by Dave Snowden at IBM in 1999, can help you navigate those problems and find the appropriate response. Many organizations use this powerful, flexible framework to aid them during product development, marketing plans, and organizational strategy, or when faced with a crisis. This template is also ideal for training new hires on how to react to such an event.
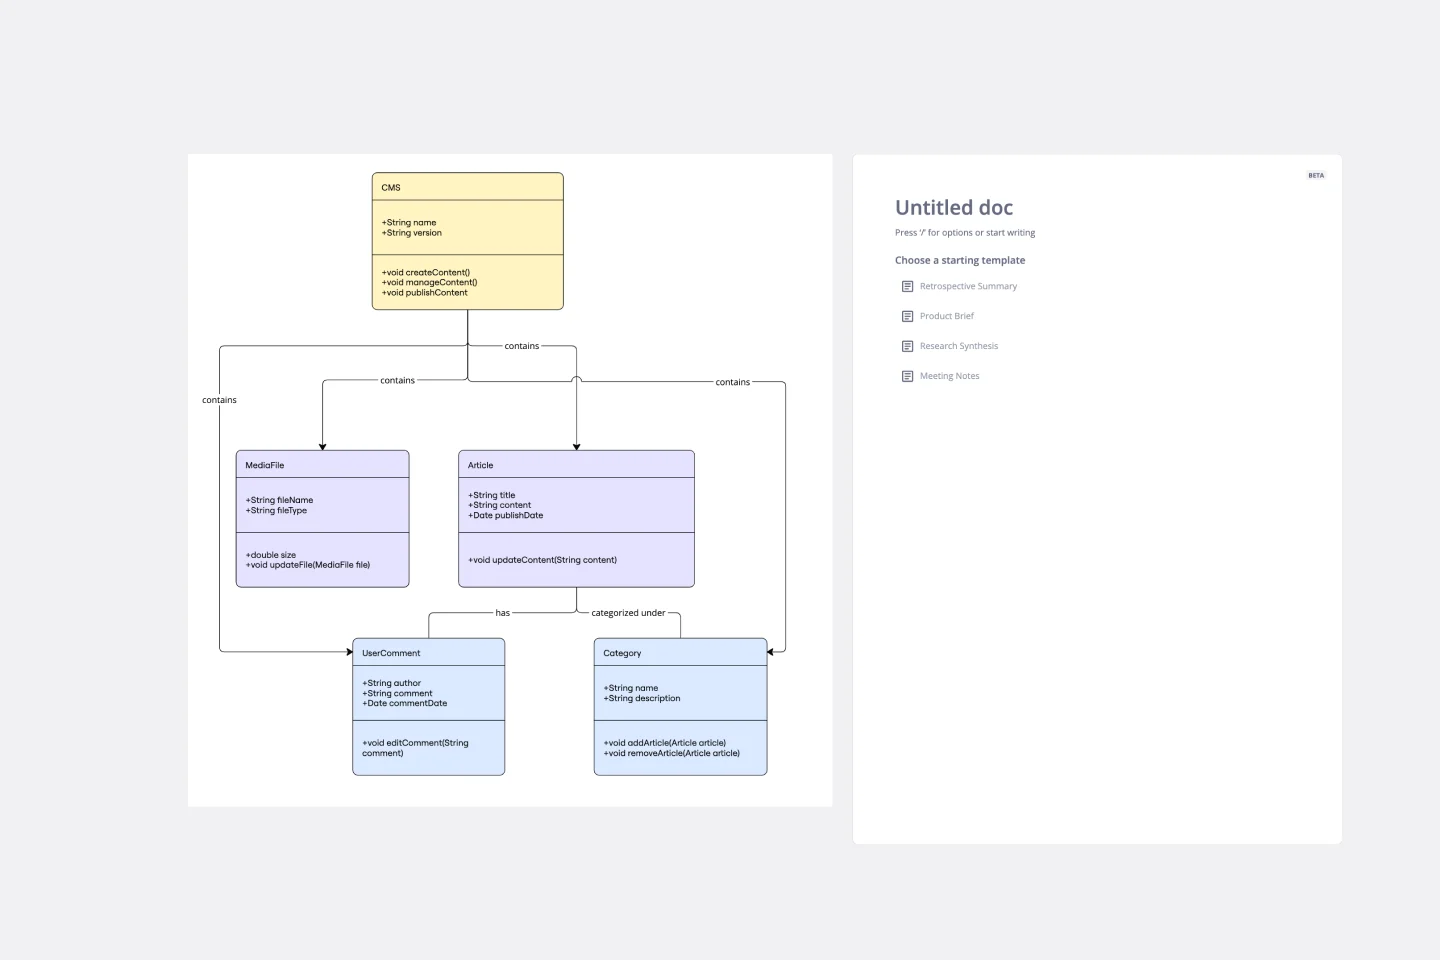
UML Class Content Management System (CMS) Template
Works best for:
UML
The UML Class Content Management System CMS Template simplifies documenting and designing the architecture of a Content Management System. It allows for the creation of UML class diagrams to visualize the structure of a CMS. Teams can efficiently map out key classes and their interactions, such as how users create, manage, and publish digital content. The template's integration into Miro's collaborative platform allows for real-time teamwork, customization, and easy sharing of feedback. This streamlines the documentation process and is valuable for software development projects aiming to develop or refine a CMS.
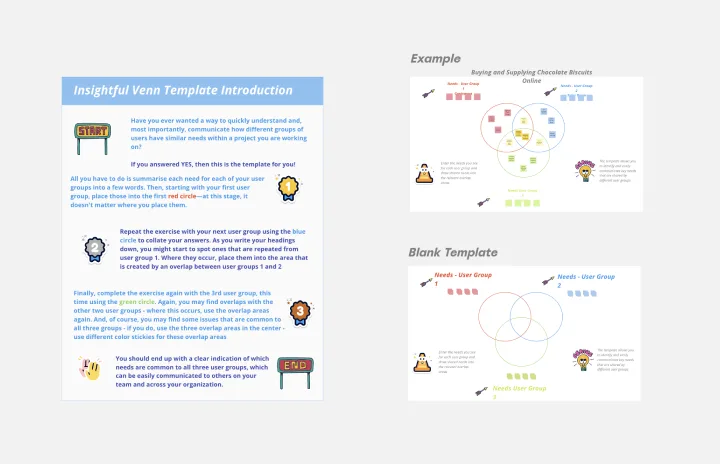
Insightful Venn
Works best for:
Venn Diagram
Discover insights and visualize data relationships with the Insightful Venn template. This tool helps you compare multiple datasets, identify intersections, and understand unique and common elements. Use it for data analysis, research, and presentations to communicate complex information effectively. Perfect for analysts, educators, and researchers aiming to convey data-driven insights visually.