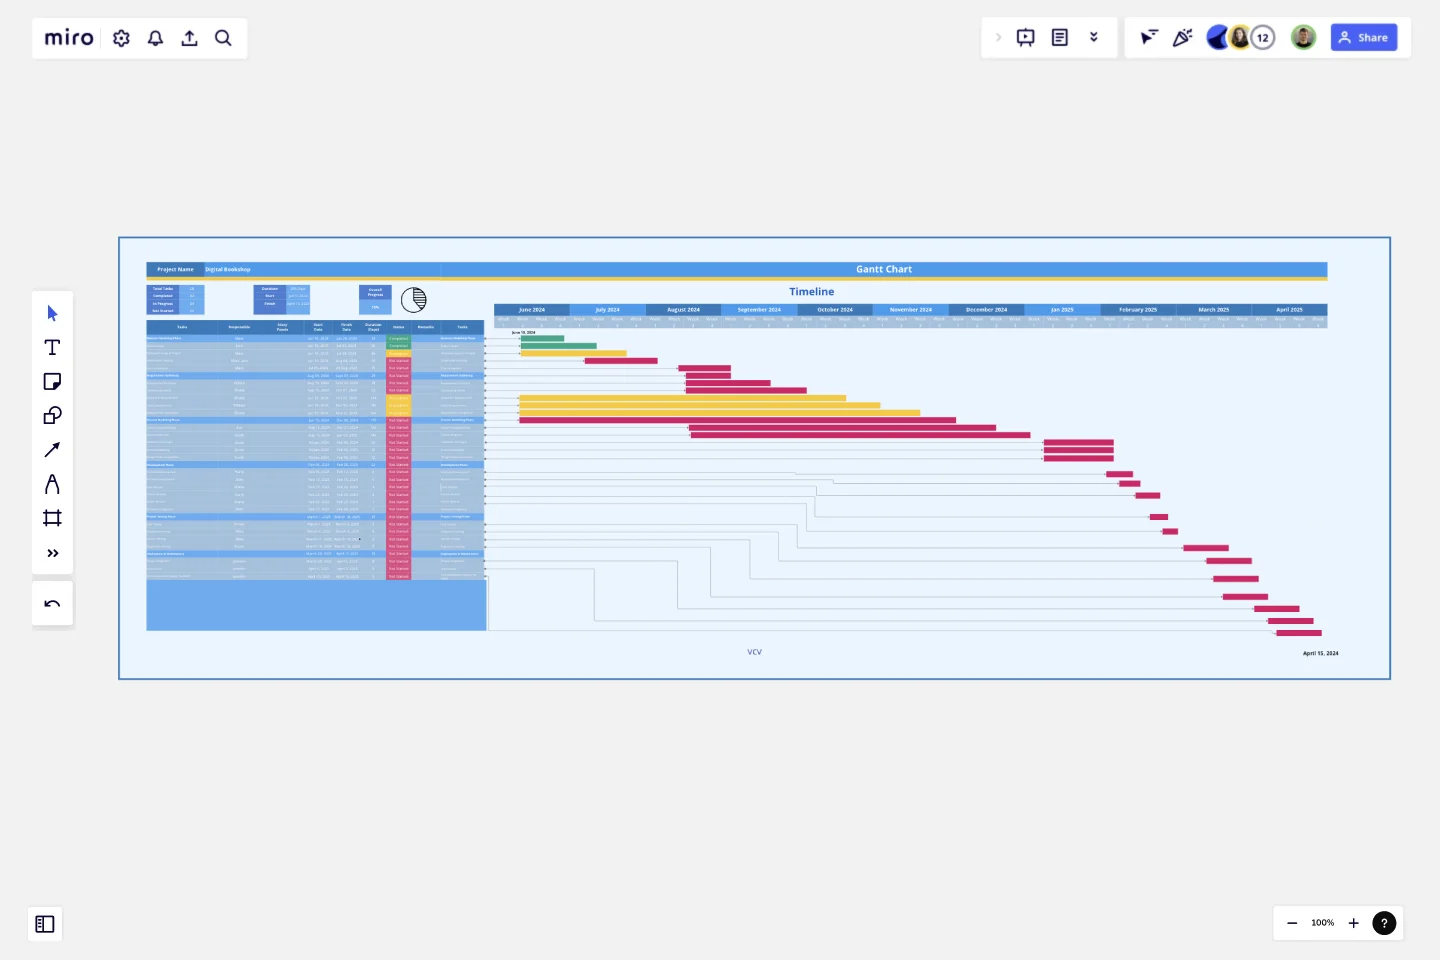
Gantt Chart Project
This document outlines a Gantt chart for the development of a Digital Bookshop Website.
The project encompasses three primary modules: users, administrators, and vendors.
The Gantt chart details all aspects of project planning, design, development, and deployment. It includes various team members who are resources assigned to this project.
This template was created by Arslan.
Get started with this template right now.
Design Brief Template
Works best for:
Design, Marketing, UX Design
For a design to be successful, let alone to be great, design agencies and teams have to know the project’s goals, timelines, budget, and scope. In other words, design takes a strategic process—and that starts with a design brief. This helpful template will empower you to create a brief that builds alignment and clear communication between your business and your design agency. It’s the foundation of any creative project, and a single source of truth that teams can refer to all along the way.
Content Strategy Template
Works best for:
Strategic Planning
Bring consistency across communication channels and develop killer content strategies with this Content Strategy Template. Designed to plan and deliver high-impact content, use this tool to collaborate faster and better.
Decision Tree Template
Works best for:
Decision Making, Mind Mapping, Diagrams
Making difficult decisions gets easier when you can look clearly at your choices and visualize the outcomes. That’s just what a decision tree will help you do, empowering you to invest your time and money with confidence. A decision tree is a flowchart that looks just how you’d imagine—with “branches” that represent your available choices. It provides a stylized way to play out a series of decisions and see where they lead before you commit your real-world resources, which is especially valuable for startups and smaller companies.
Product Ownership Evolution Model (POEM)
Works best for:
Product Management, Planning
The Product Ownership Evolution Model (POEM) template guides product teams through the evolution of product ownership roles and responsibilities. By illustrating the transition from individual ownership to shared ownership, this template fosters collaboration and accountability. With sections for defining roles, establishing workflows, and setting expectations, it facilitates smooth transitions and enhances team effectiveness. This template serves as a roadmap for optimizing product ownership practices and driving continuous improvement.
Product Market Fit Board
Works best for:
Product Management, Planning
The Product Market Fit Board template helps product teams assess and validate product-market fit. By capturing user feedback, analyzing market trends, and tracking key metrics, this template enables teams to evaluate product-market alignment objectively. With sections for defining target segments, identifying pain points, and prioritizing features, it guides teams through the process of optimizing product-market fit. This template serves as a tool for iteratively refining products to meet customer needs and drive market success.
Data Org Chart
Works best for:
Org Charts, Operations, Mapping
The Data Org Chart template provides a visual representation of data-related roles and relationships within an organization. By mapping out data management responsibilities and dependencies, teams can enhance data governance and improve collaboration. With features for customizing data roles and connections, this template empowers teams to optimize data processes and ensure data integrity and compliance.
