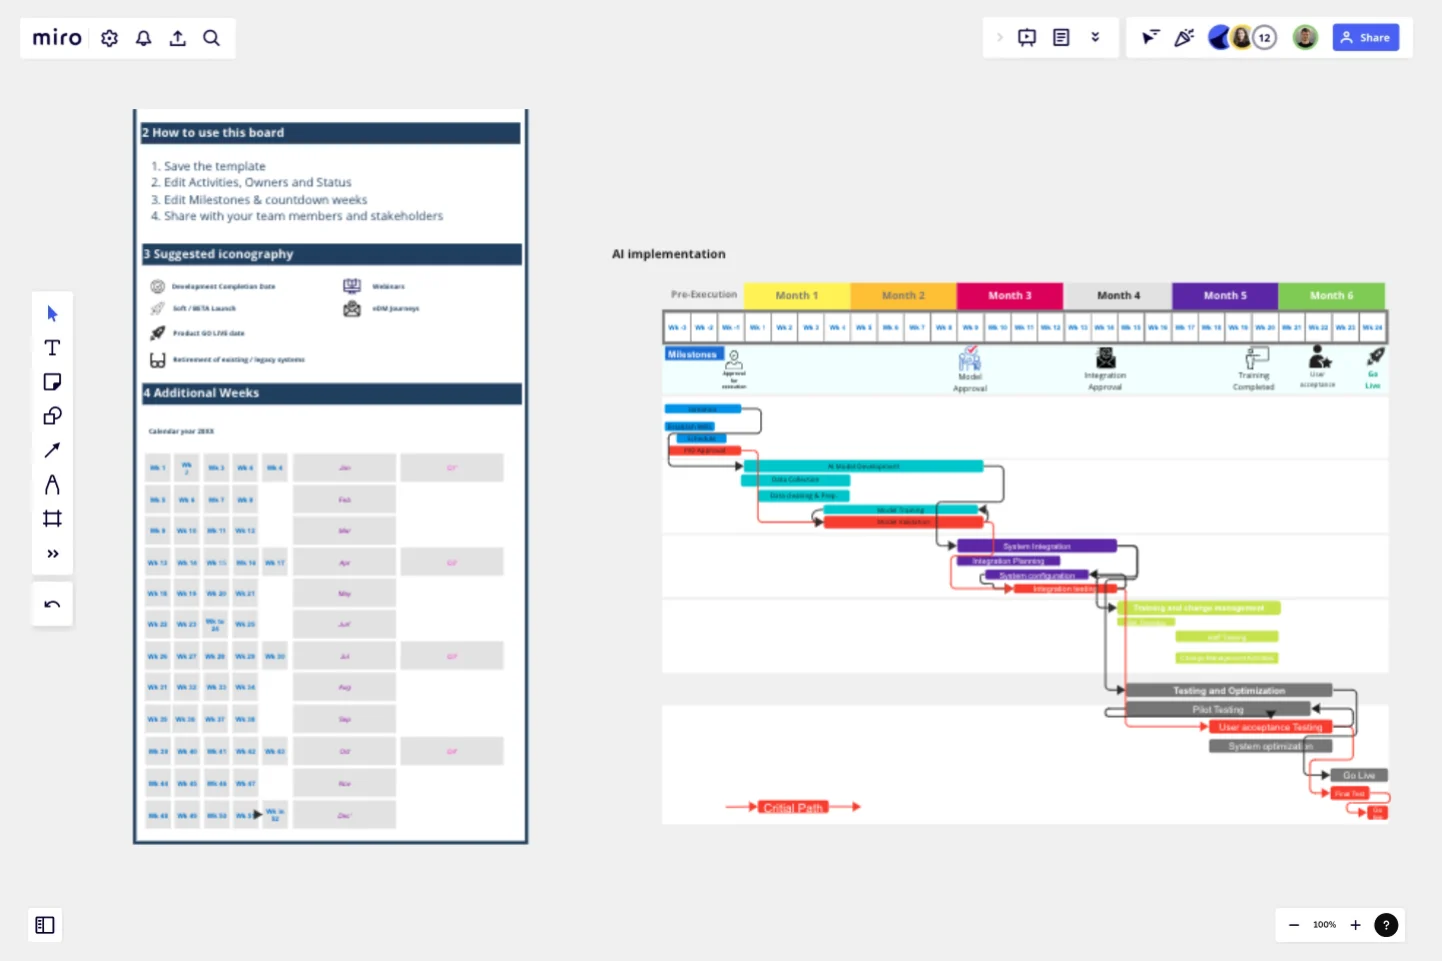
Gantt Chart for Project Scheduling
A Gantt chart is a project management tool that helps in planning, scheduling, and monitoring a project.
Use this template knowing this:
A Gantt chart is a horizontal bar chart used to display the start date and duration of each task that makes up a project.
It represents all information visually through a horizontal bar graph.
Project managers and team members can view the task schedules, dependencies, and progress by just glancing at the chart.
Components:
Y-axis: Represents the tasks in the project.
X-axis: Represents the duration of each task.
Bars: Each task is represented by a bar, and the length of the bar indicates its duration.
Overlapping Bars: If two bars overlap on the X-axis, they occur simultaneously.
This template was created by Muhammad Jaon.
Get started with this template right now.
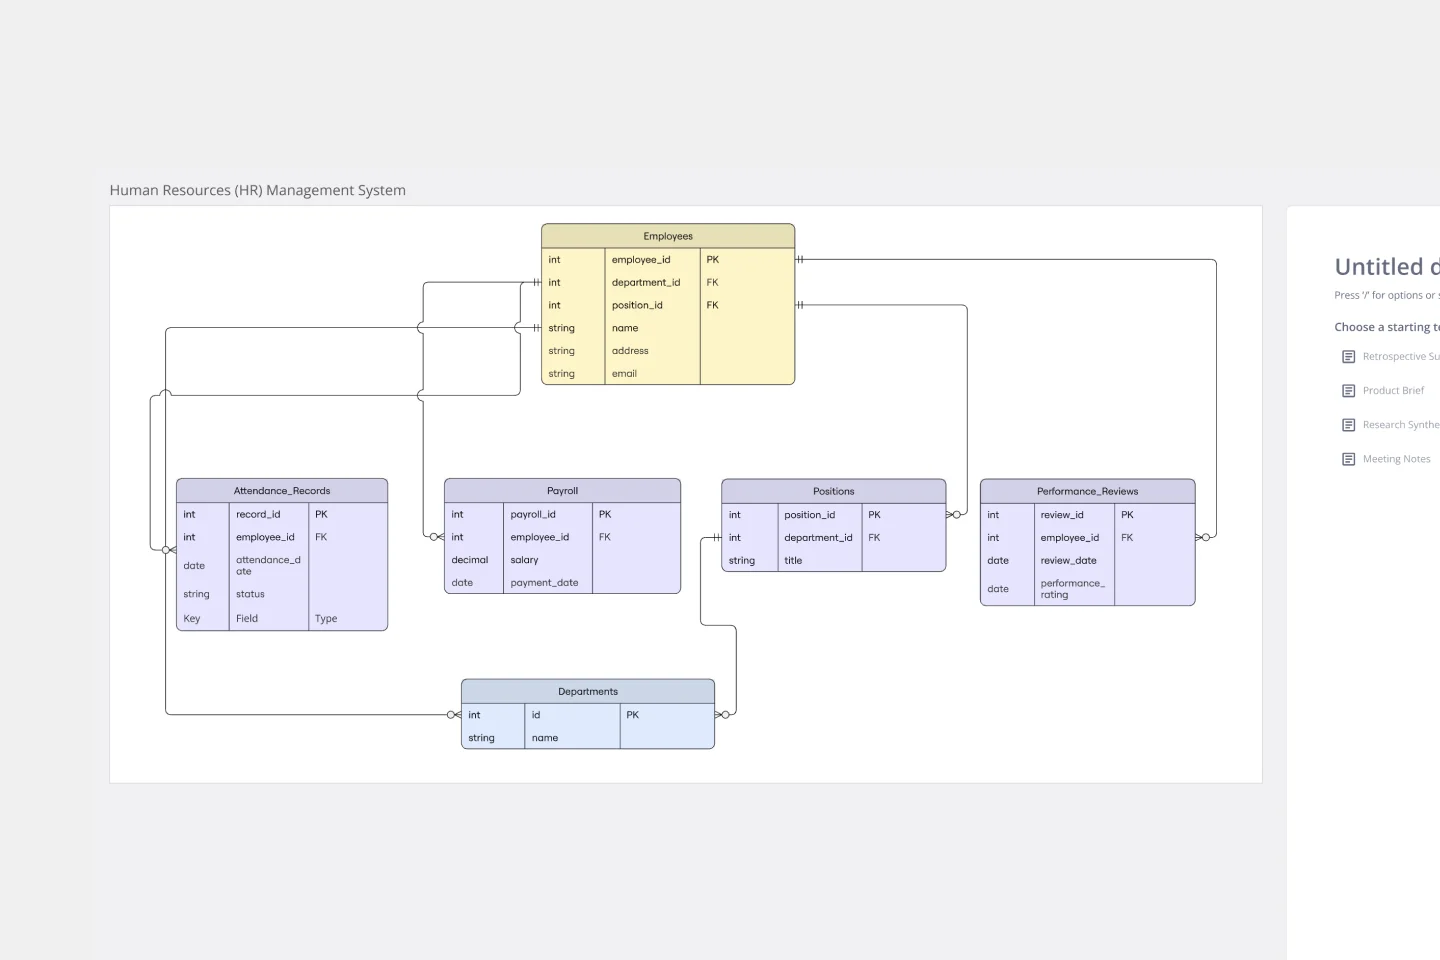
Entity–Relationship Diagram (ERD) HR Management System Template
Works best for:
ERD
The Entity–Relationship Diagram (ERD) HR Management System Template in Miro is designed to streamline the management of employee-related information and processes within an organization. This template allows for the visualization and organization of complex HR systems, making it easier to understand relationships and processes. It enables users to map out departments, positions, and employee details, including attendance records, payroll, and performance reviews.
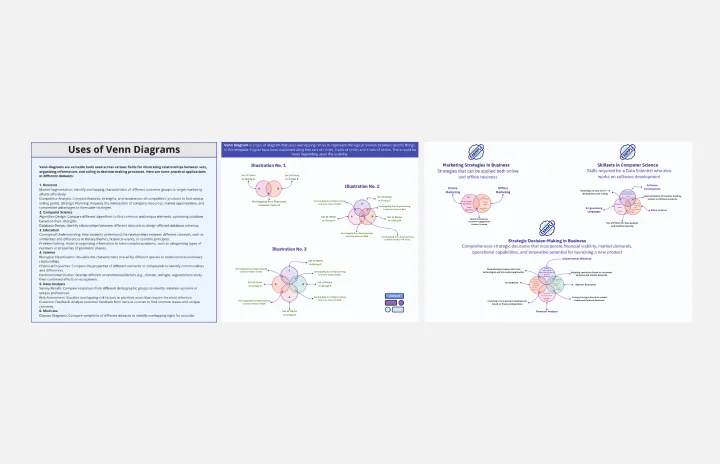
Venn Diagram Practical Applications
Works best for:
Venn Diagram
The Venn Diagram for Practical Applications template helps you apply Venn diagrams to real-world scenarios. Use this template to solve problems, identify relationships, and make decisions based on clear visual analysis. It's perfect for practical tasks such as project planning, resource allocation, and strategic decision-making. This tool is ideal for business professionals, educators, and anyone looking to apply theoretical concepts to practical situations.
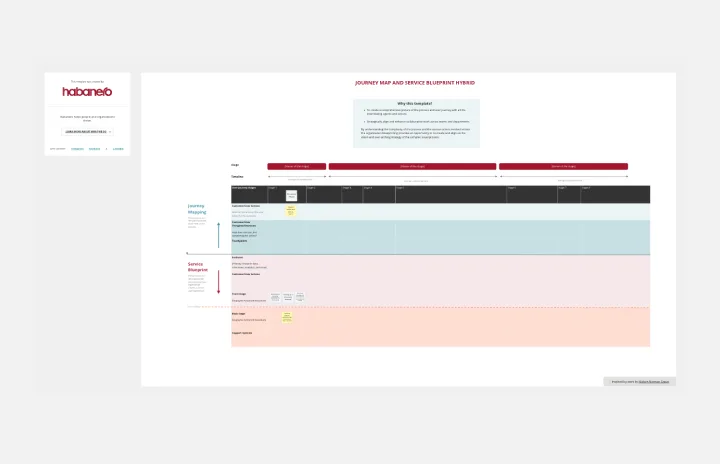
Service Blueprint by Habanero
Works best for:
Service Blueprint
Optimize your service processes with the Service Blueprint Habanero. This template allows you to map out and scrutinize each aspect of your service delivery, highlighting customer touchpoints and internal processes. Use it to identify inefficiencies, streamline operations, and enhance the overall customer experience. Perfect for service designers, managers, and improvement teams, it offers a detailed approach to refining and innovating your service offerings.
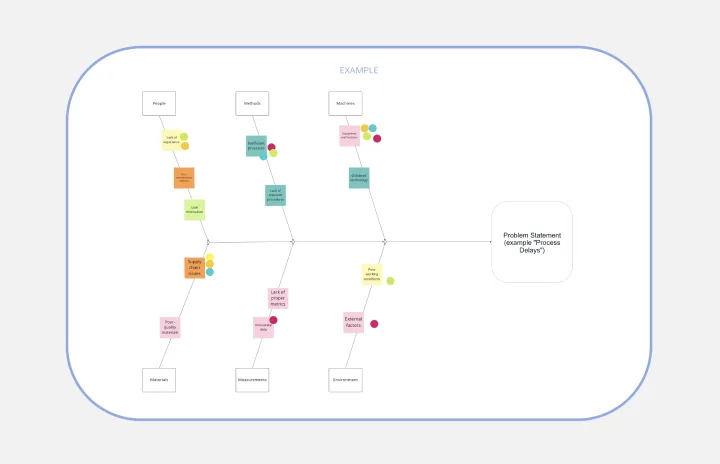
Fishbone Diagram for Process Improvement
Works best for:
Planning, Strategy
Process improvement is key to enhancing efficiency and productivity. The Fishbone Diagram for Process Improvement template helps you identify the root causes of process inefficiencies. Categorize potential causes into areas such as workflow, resources, technology, and personnel. This structured analysis enables your team to systematically explore and address issues, streamlining processes and boosting overall productivity.
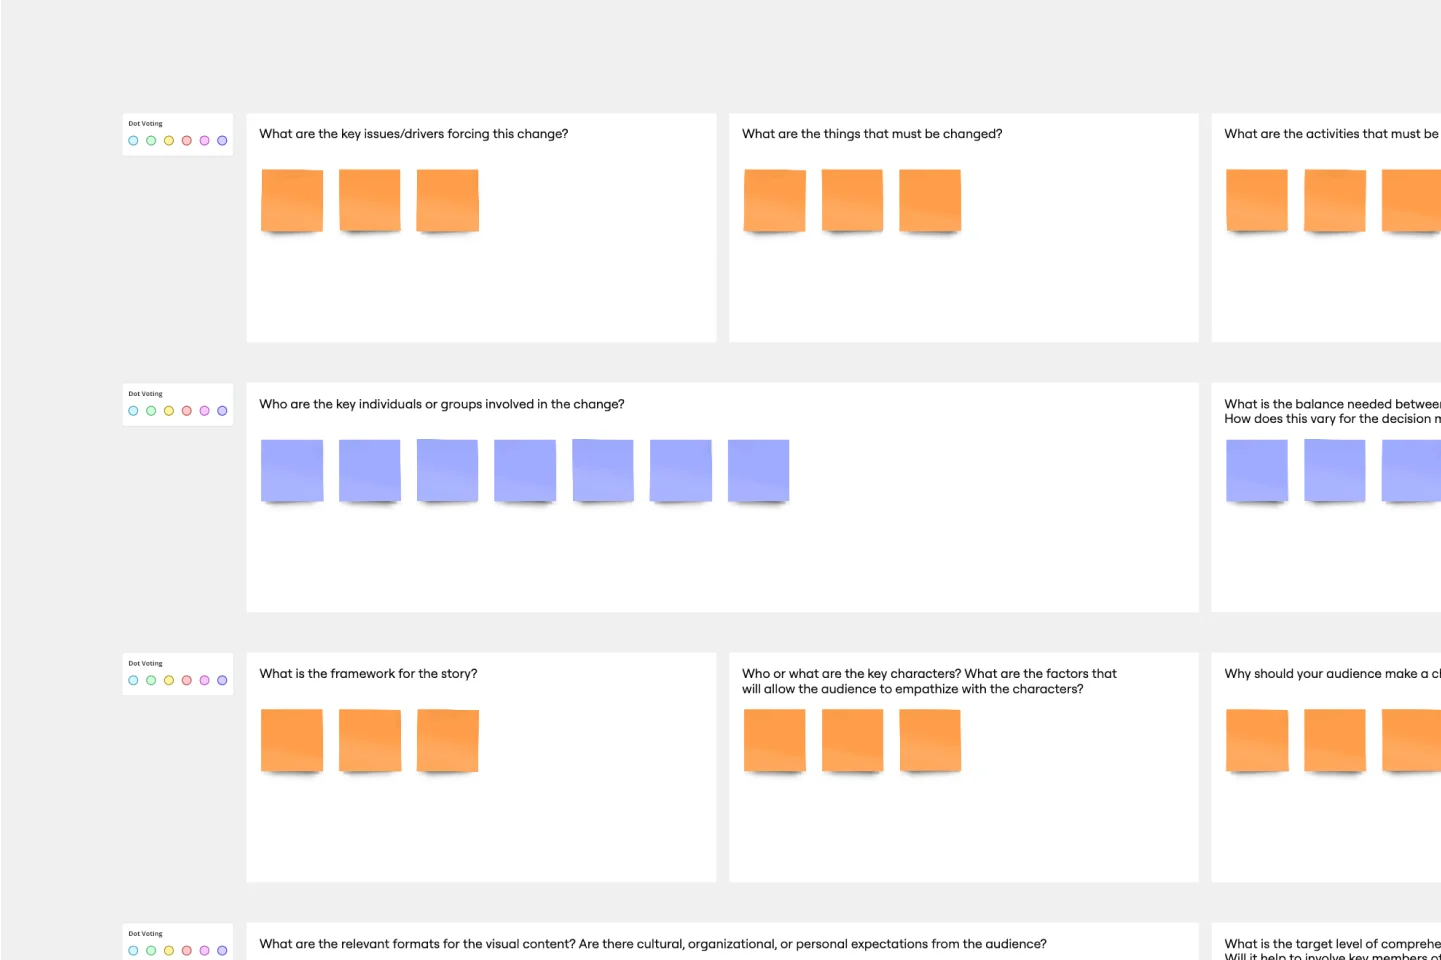
Visual Story Map Template
Works best for:
Marketing, Desk Research, Mapping
Some people like to think of a visual story map as a stylized to-do list, but it’s a lot more powerful than that. Visual story mapping allows your product management team to visualize multiple dimensions of information.
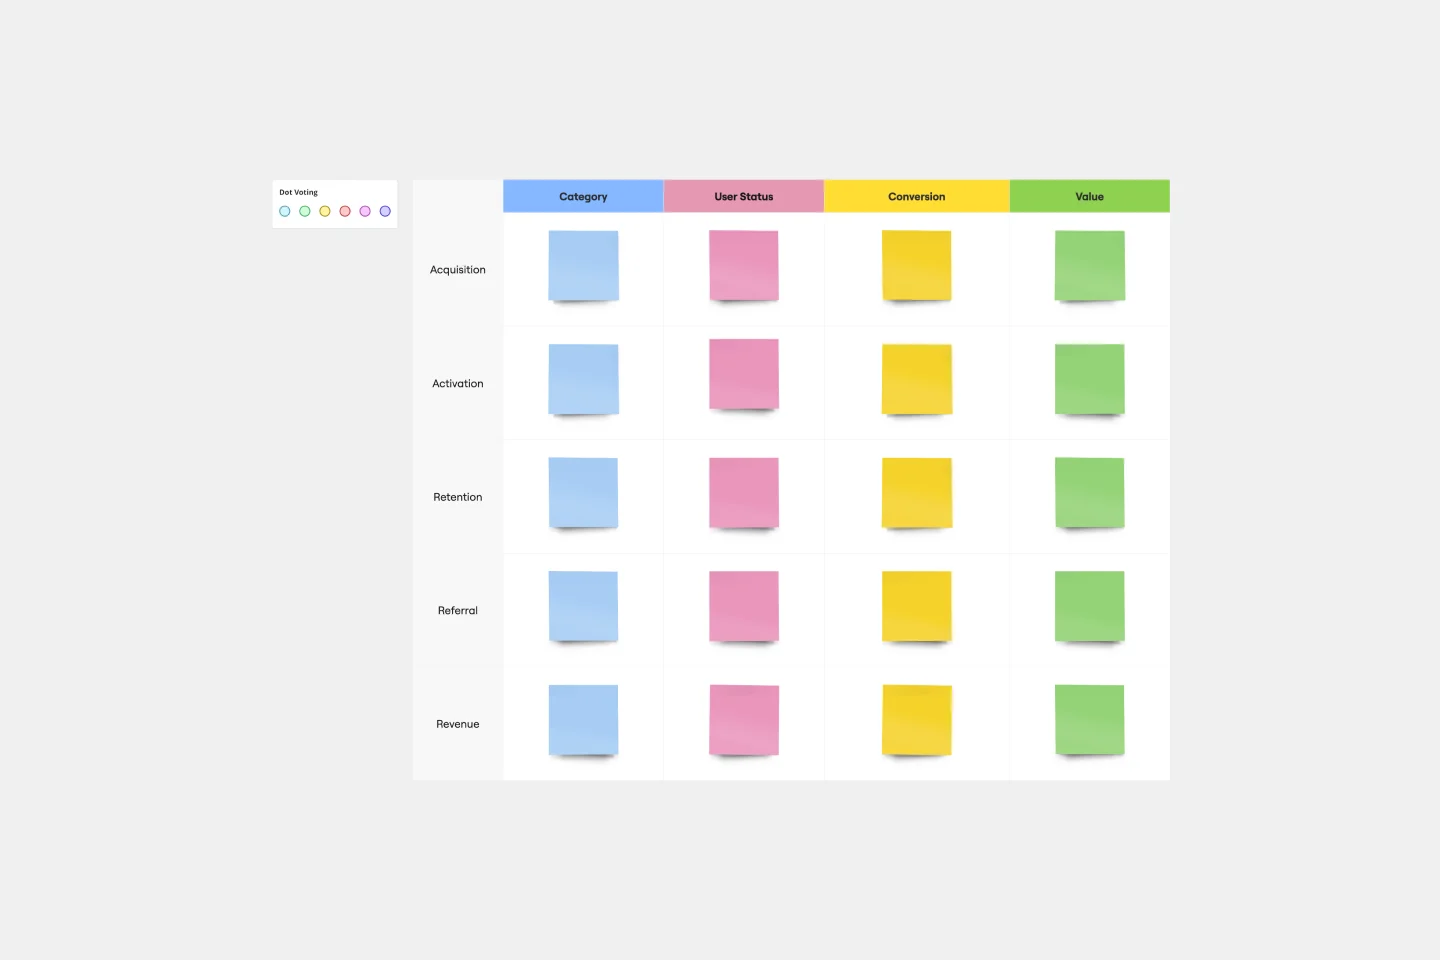
AARRR Template
Works best for:
Marketing, Strategic Planning, Project Planning
Sometimes called “Pirate Metrics” because of the name (go ahead, say it, it’s fun), AARRR is a valuable approach for startups to consider. That’s because AARRR stands for Acquisition, Activation, Retention, Referral, and Revenue—five key types of user behavior that are highly measurable and drive growth. Ask and answer the right questions around each of these five factors, and you’ll be able to establish clear goals and identify the best steps to help reach them.