Four-Circle Venn Diagram by Irfan Rosli
Welcome to the Four-Circle Venn Diagram template!
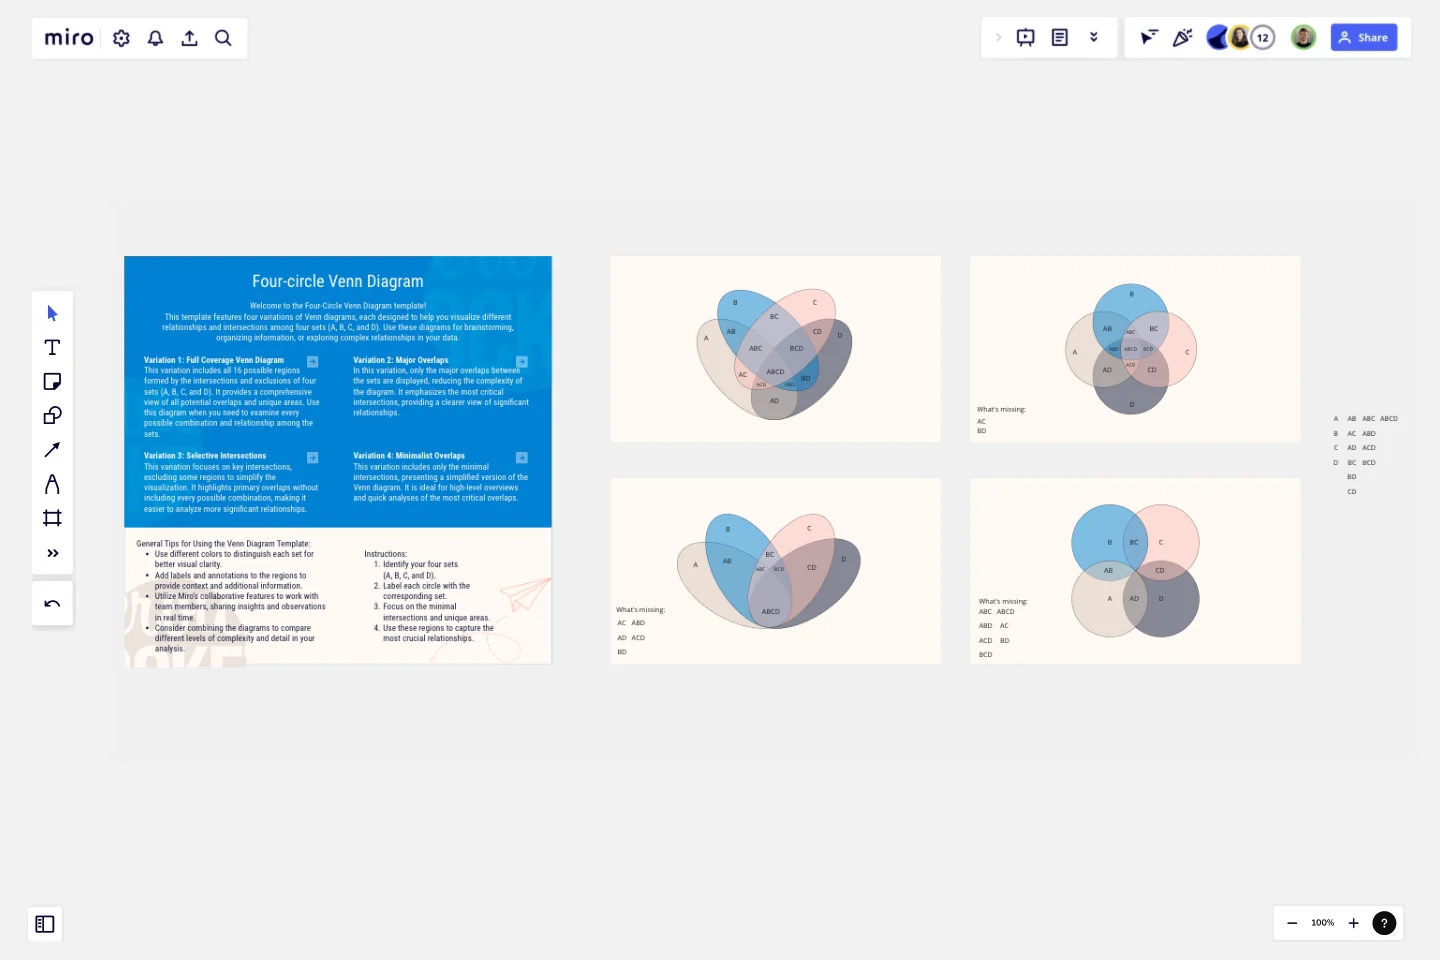
This template features four variations of Venn diagrams, each designed to help you visualize different relationships and intersections among four sets (A, B, C, and D). Use these diagrams for brainstorming, organizing information, or exploring complex relationships in your data.
Variation 1: Full Coverage Venn Diagram
This variation includes all 16 possible regions formed by the intersections and exclusions of four sets (A, B, C, and D). It provides a comprehensive view of all potential overlaps and unique areas. Use this diagram when you need to examine every possible combination and relationship among the sets.
Variation 2: Major Overlaps
In this variation, only the major overlaps between the sets are displayed, reducing the complexity of the diagram. It emphasizes the most critical intersections, providing a clearer view of significant relationships.
Variation 3: Selective Intersections
This variation focuses on key intersections, excluding some regions to simplify the visualization. It highlights primary overlaps without including every possible combination, making it easier to analyze more significant relationships.
Variation 4: Minimalist Overlaps
This variation includes only the minimal intersections, presenting a simplified version of the Venn diagram. It is ideal for high-level overviews and quick analyses of the most critical overlaps.
Instructions:
Identify your four sets (A, B, C, and D).
Label each circle with the corresponding set.
Focus on the minimal intersections and unique areas.
Use these regions to capture the most crucial relationships.
General Tips for Using the Venn Diagram Template:
Use different colors to distinguish each set for better visual clarity.
Add labels and annotations to the regions to provide context and additional information.
Utilize Miro's collaborative features to work with team members, sharing insights and observations in real time.
Consider combining the diagrams to compare different levels of complexity and detail in your analysis.
This template aims to provide flexibility and clarity in visualizing the relationships among four sets. Choose the variation that best fits your needs and start exploring the intersections and unique aspects of your data!
This template was created by Irfan Rosli.
Get started with this template right now.
Timeline Workflow by Reza Zolf
Works best for:
Planning, Strategy
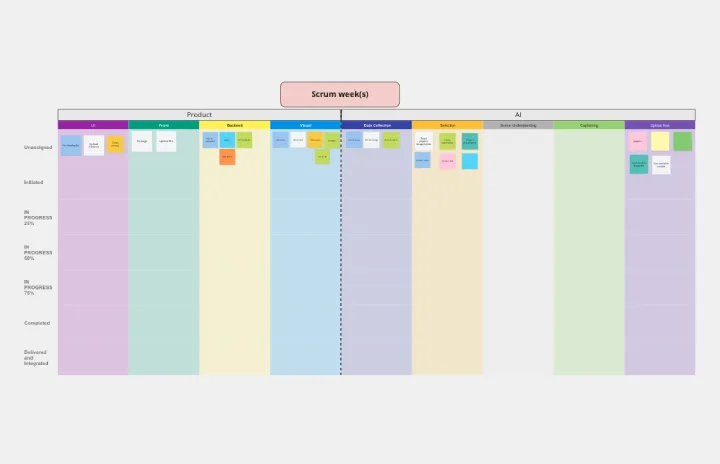
The Timeline Workflow template helps streamline your project workflows. It’s perfect for visualizing processes, identifying bottlenecks, and optimizing tasks. This template enhances team collaboration and ensures smooth project execution.
3 Horizons of Growth Template
Works best for:
Leadership, Strategic Planning, Project Planning
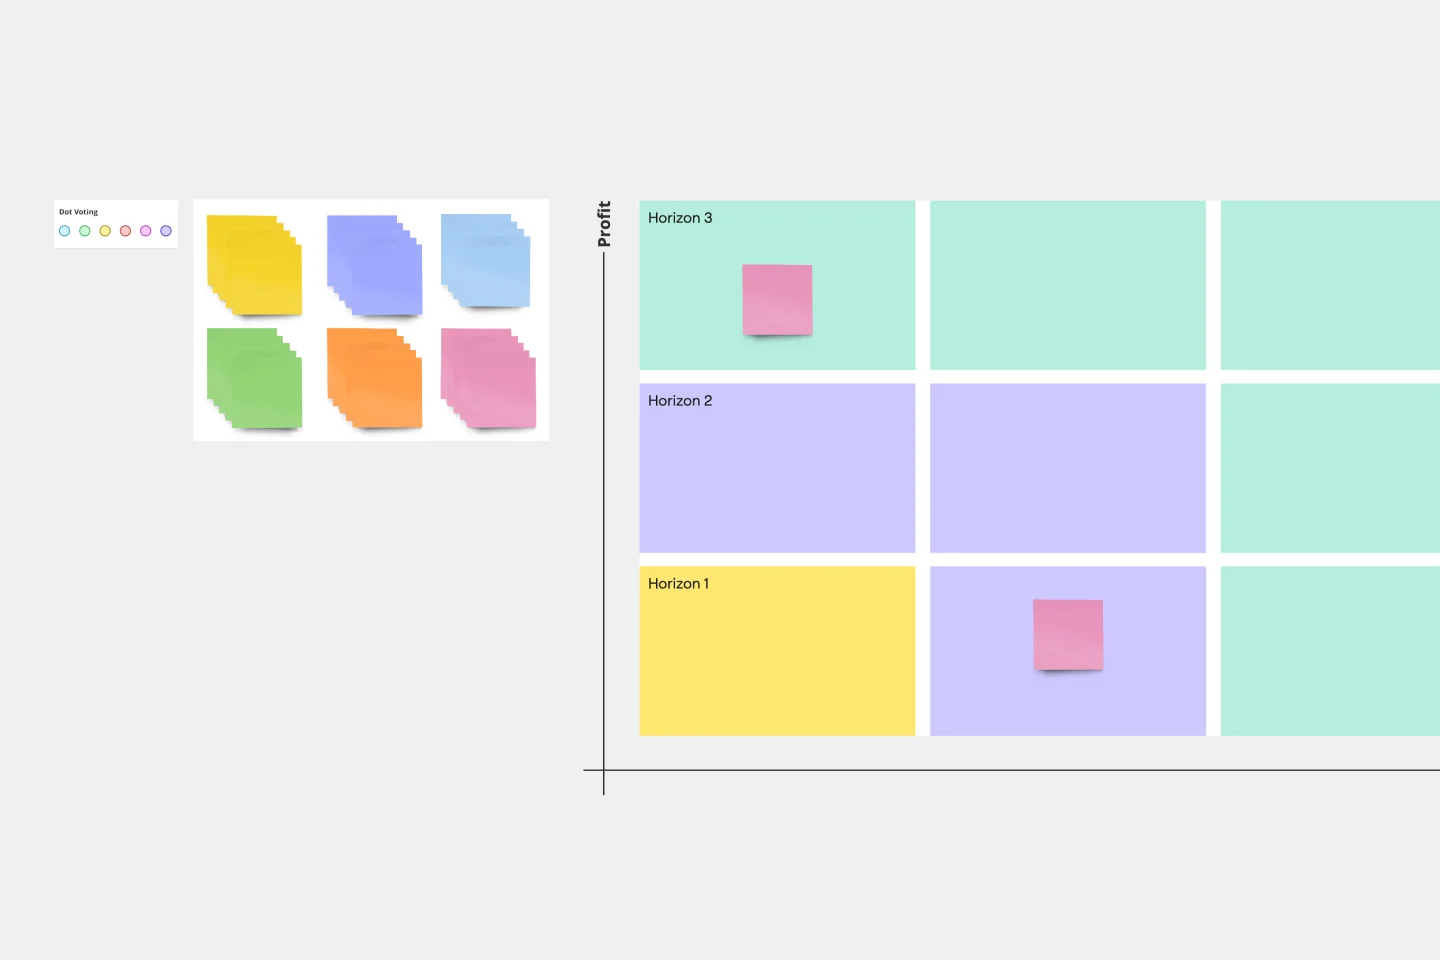
Featured in The Alchemy of Growth, this model gives ambitious companies a way to balance the present and the future—in other words, what’s working in the existing business and what emerging, possibly-profitable growth opportunities lie ahead. Then teams across the organization can make sure that their projects map to and support the organization’s goals. The 3 Horizons of Growth model is also a powerful way to foster a culture of innovation—one that values and depends on experimentation and iteration—and to identify opportunities for new business.
Idea Funnel Backlog
Works best for:
Design, Brainstorming, Agile Workflows
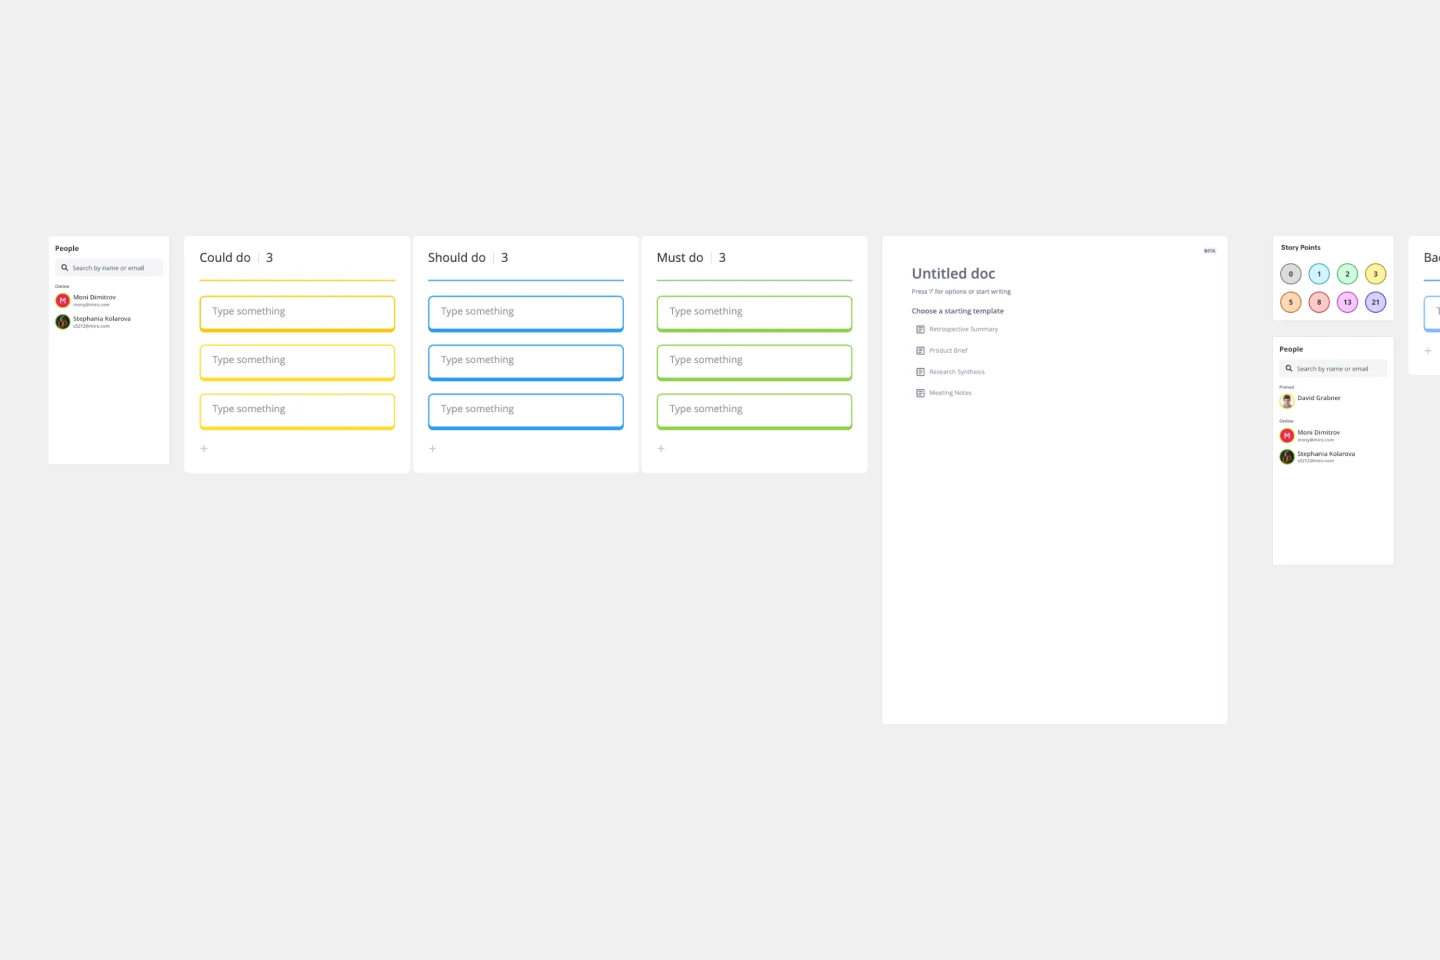
An Idea Funnel Backlog enables you to visualize your backlog and restrict the number of backlogged items at the top. In doing sos, you can prioritize items on your list without having to engage in unnecessary meetings or create too much operational overhead. To use the Idea Funnel Backlog, break up the funnel into different phases or treat it like a roadmap. Use the Idea Funnel Backlog as a hybrid model that combines your roadmap and backlog into one easily digestible format.
SWOT Analysis Template
Works best for:
Decision Making, Strategic Planning, Prioritization
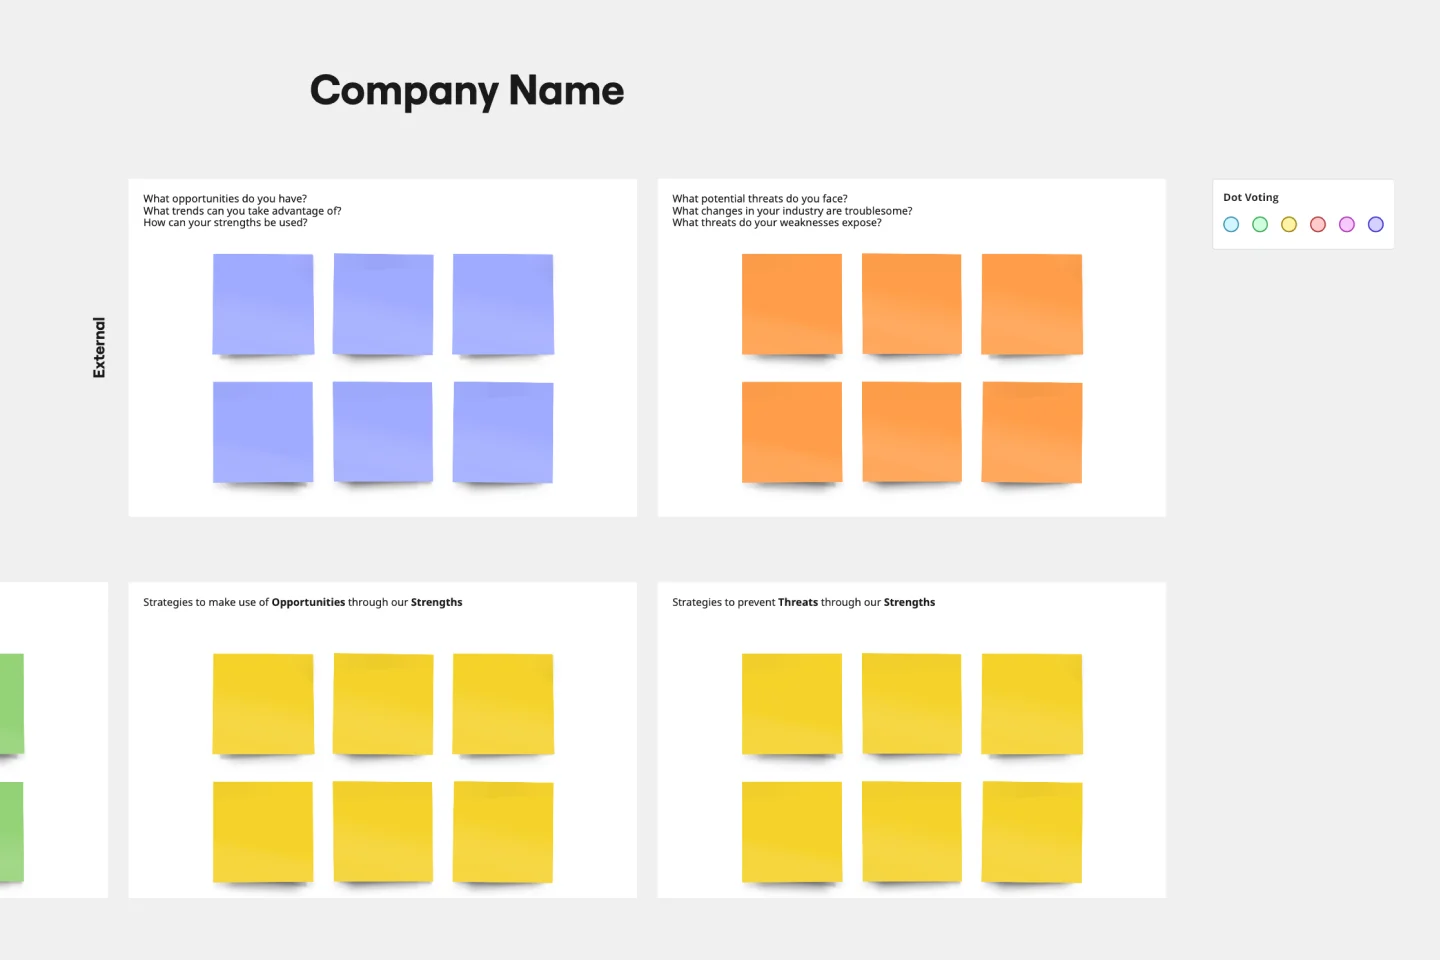
When you’re developing a business strategy, it can be hard to figure out what to focus on. A SWOT analysis helps you hone in on key factors. SWOT stands for Strengths, Weaknesses, Opportunities, and Threats. Strengths and weaknesses are internal factors, like your employees, intellectual property, marketing strategy, and location. Opportunities and threats are usually external factors, like market fluctuations, competition, prices of raw materials, and consumer trends. Conduct a SWOT analysis whenever you want to explore opportunities for new businesses and products, decide the best way to launch a product, unlock your company’s potential, or use your strengths to develop opportunities.
5W1H Template
Works best for:
Strategy & Planning
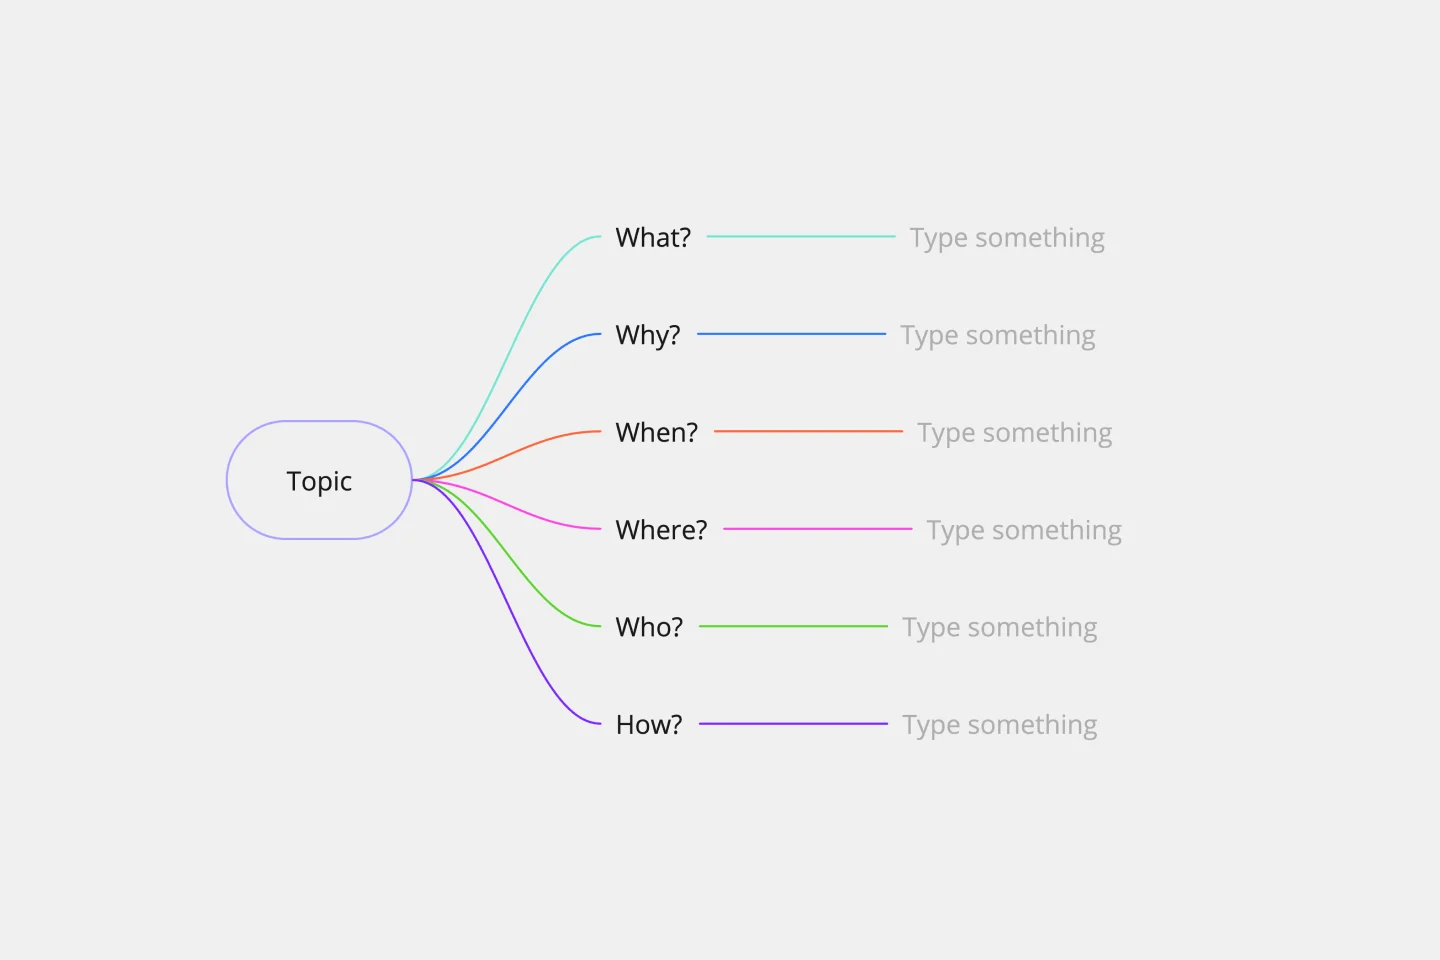
The 5W1H Template is a strategic framework that clarifies complex situations or projects into six foundational questions: What, Who, Where, When, How, and Why. This methodological approach ensures a comprehensive understanding, encouraging teams to dissect and explore every aspect of a given challenge or project.
Sales Strategy Gantt Chart
Works best for:
Strategy, Planning
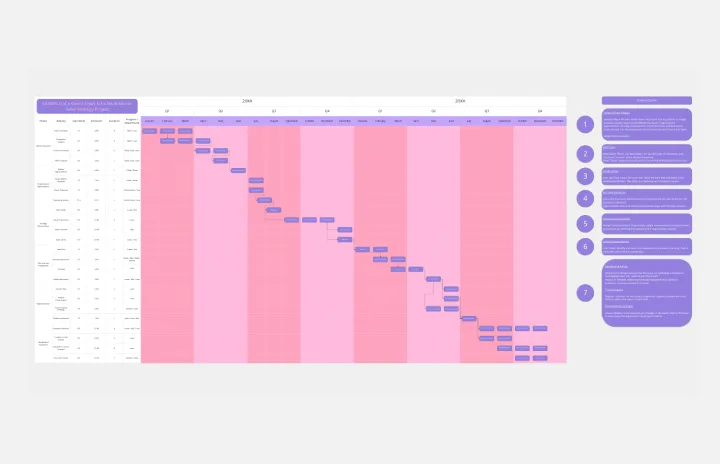
Creating and executing a sales strategy requires meticulous planning. The Sales Strategy Gantt Chart template helps you map out every step of your strategy, from goal setting to implementation and review. Visualize key activities, set timelines, and assign tasks to ensure your sales team stays focused and aligned. This template enables you to track progress, measure performance, and make data-driven adjustments for better sales outcomes.