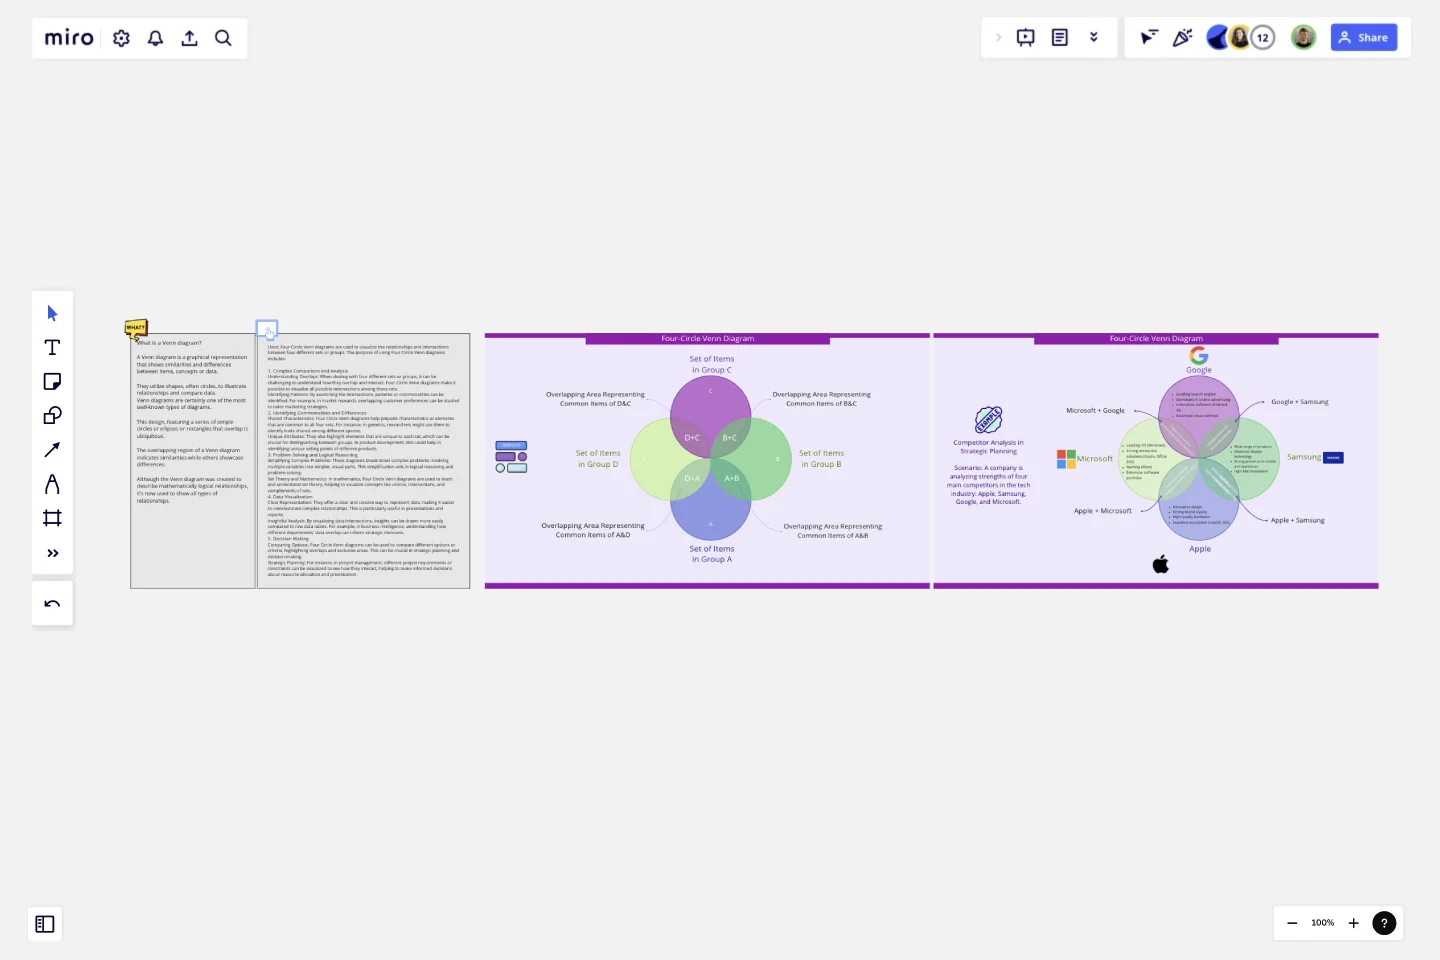
Four-Circle Venn Diagram
A Venn diagram is a graphical representation that shows similarities and differences between items, concepts or data.
They utilize shapes, often circles, to illustrate relationships and compare data.
Venn diagrams are certainly one of the most well-known types of diagrams. This design, featuring a series of simple circles or ellipses or rectangles that overlap is ubiquitous. The overlapping region of a Venn diagram indicates similarities while others showcase differences. Although the Venn diagram was created to describe mathematically logical relationships, it’s now used to show all types of relationships.
Uses:
Four Circle Venn diagrams are used to visualize the relationships and intersections between four different sets or groups. The purpose of using Four Circle Venn diagrams includes:
1. Complex Comparison and AnalysisUnderstanding Overlaps: When dealing with four different sets or groups, it can be challenging to understand how they overlap and interact. Four Circle Venn diagrams make it possible to visualize all possible intersections among these sets.
Identifying Patterns: By examining the intersections, patterns or commonalities can be identified. For example, in market research, overlapping customer preferences can be studied to tailor marketing strategies.
2. Identifying Commonalities and DifferencesShared Characteristics: Four Circle Venn diagrams help pinpoint characteristics or elements that are common to all four sets. For instance, in genetics, researchers might use them to identify traits shared among different species.
Unique Attributes: They also highlight elements that are unique to each set, which can be crucial for distinguishing between groups. In product development, this could help in identifying unique selling points of different products.
3. Problem Solving and Logical ReasoningSimplifying Complex Problems: These diagrams break down complex problems involving multiple variables into simpler, visual parts. This simplification aids in logical reasoning and problem-solving.
Set Theory and Mathematics: In mathematics, Four Circle Venn diagrams are used to teach and understand set theory, helping to visualize concepts like unions, intersections, and complements of sets.
4. Data VisualizationClear Representation: They offer a clear and concise way to represent data, making it easier to communicate complex relationships. This is particularly useful in presentations and reports.
Insightful Analysis: By visualizing data intersections, insights can be drawn more easily compared to raw data tables. For example, in business intelligence, understanding how different departments' data overlap can inform strategic decisions.
5. Decision MakingComparing Options: Four Circle Venn diagrams can be used to compare different options or criteria, highlighting overlaps and exclusive areas. This can be crucial in strategic planning and decision-making.
Strategic Planning: For instance, in project management, different project requirements or constraints can be visualized to see how they interact, helping to make informed decisions about resource allocation and prioritization. Learn from the examples provided to start your own Venn diagram.
This template was created by Khawaja Rizwan.
Get started with this template right now.
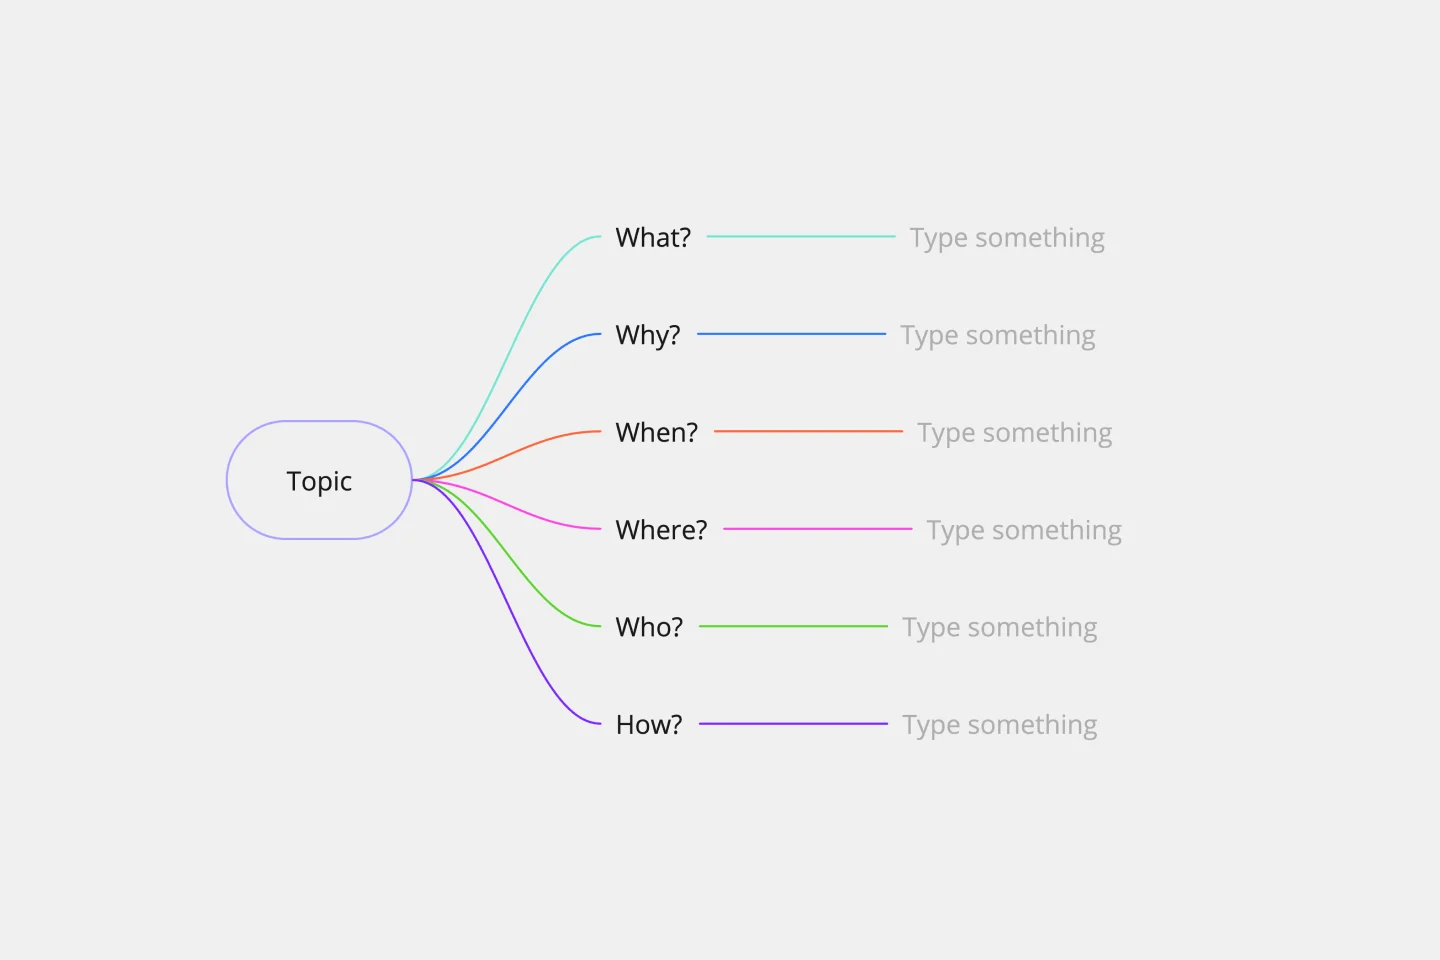
5W1H Template
Works best for:
Strategy & Planning
The 5W1H Template is a strategic framework that clarifies complex situations or projects into six foundational questions: What, Who, Where, When, How, and Why. This methodological approach ensures a comprehensive understanding, encouraging teams to dissect and explore every aspect of a given challenge or project.
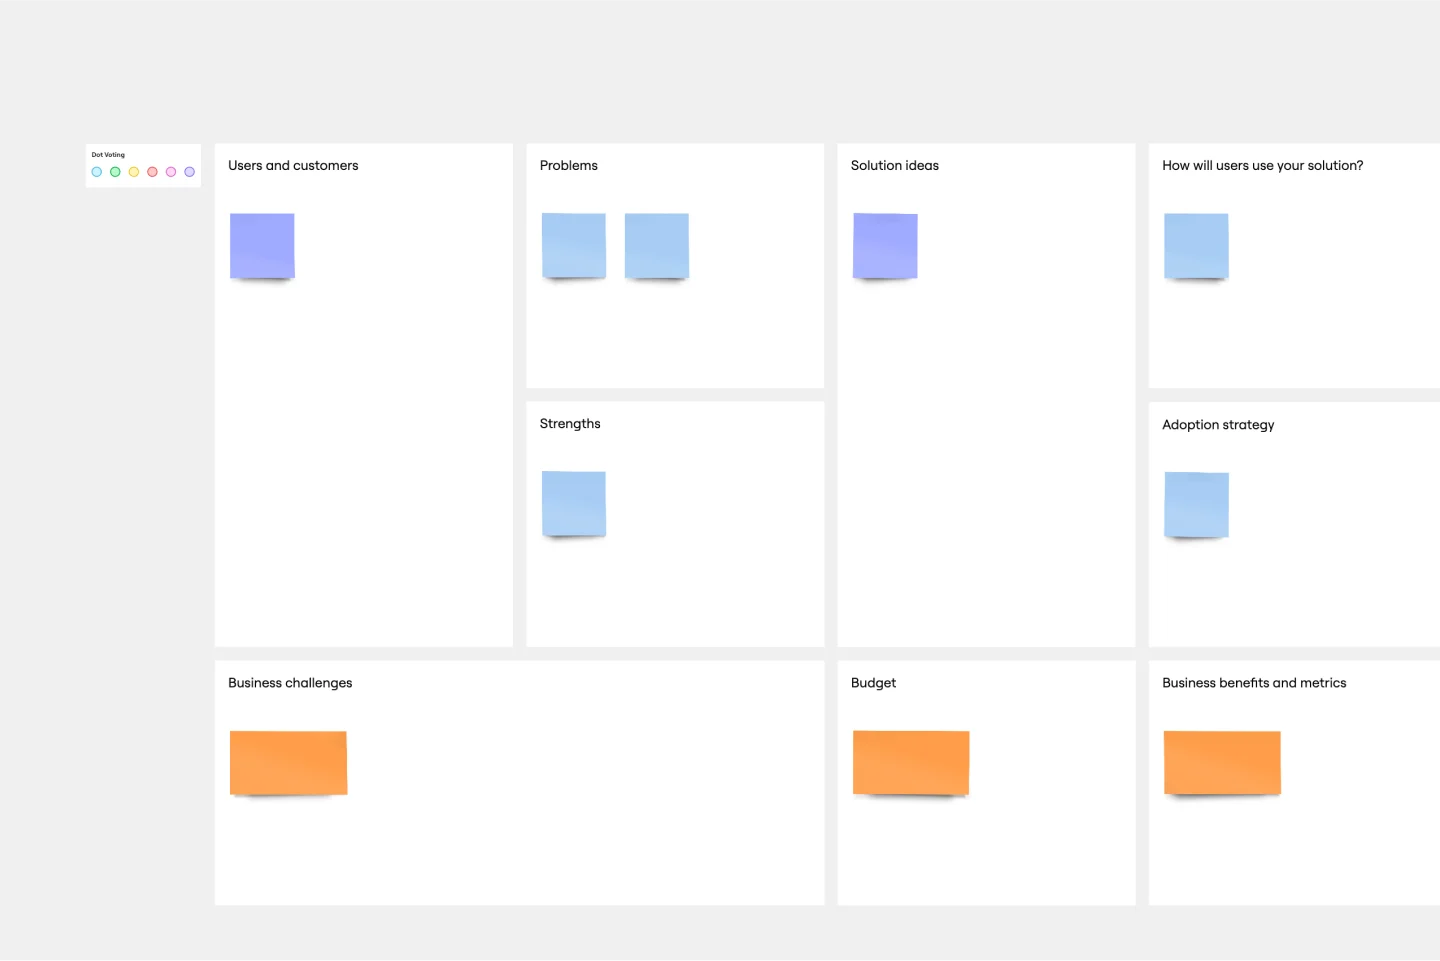
Opportunity Canvas Template
Works best for:
Leadership, Decision Making, Strategic Planning
Features and capabilities — they make or break a product, which is why companies spend so much time and effort focusing on them. Sound like you? Try it with an Opportunity Canvas. This streamlined one-pager gives you and your team the power to improve your product by exploring the use cases, potential setbacks, strategies, challenges, and metrics. An Opportunity Canvas is ideal if you’ve already built a product, because you don’t need to consider the operational or revenue model.
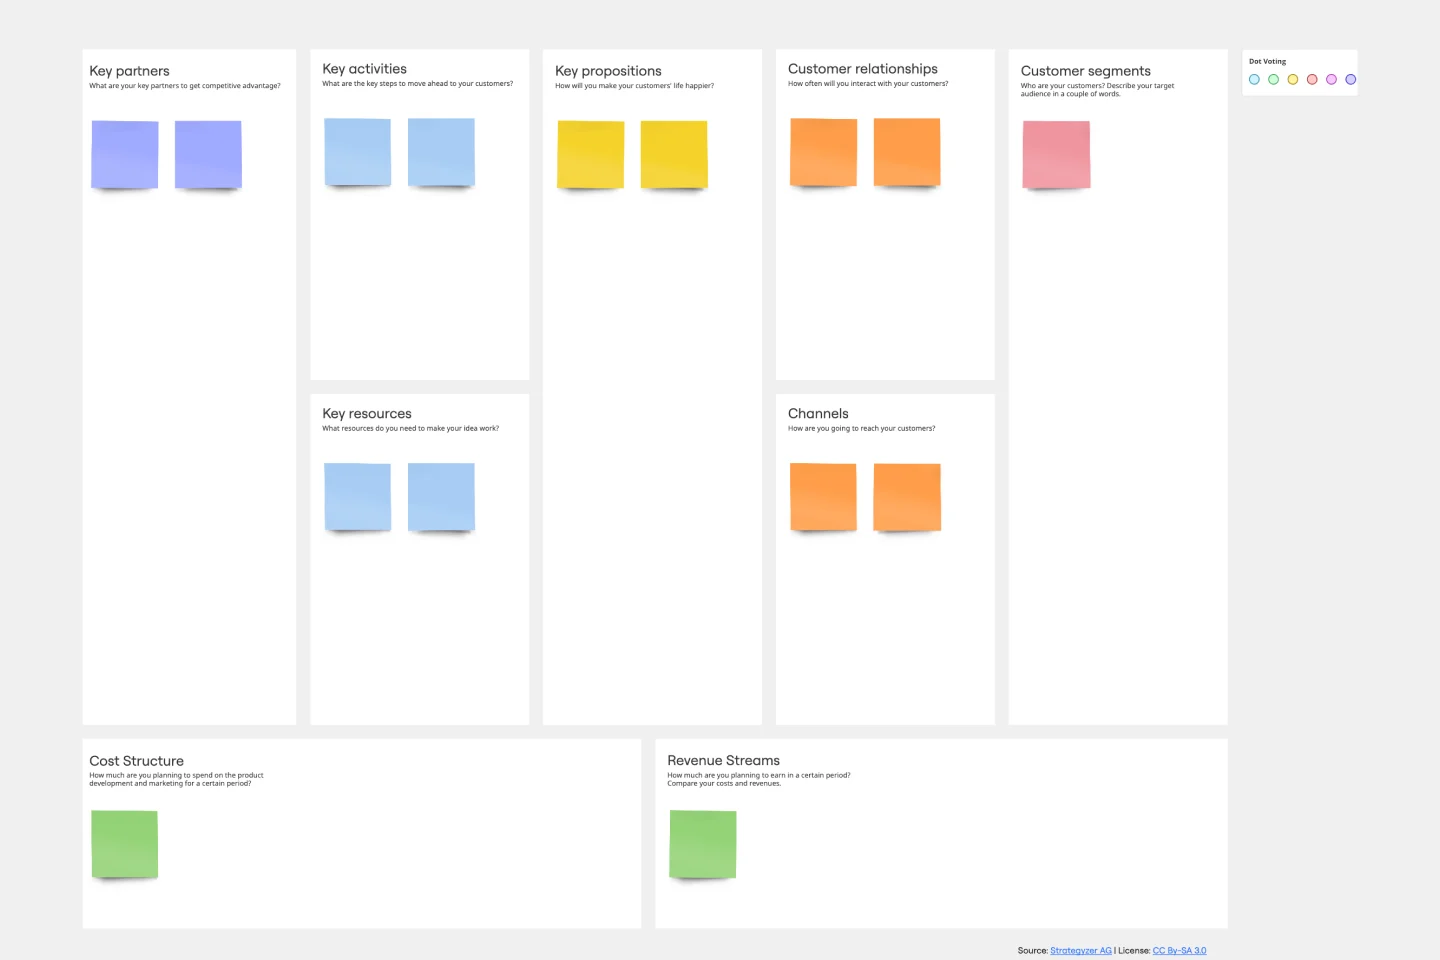
Business Model Canvas Template
Works best for:
Leadership, Agile Methodology, Strategic Planning
Your business model: Nothing is more fundamental to who you are, what you create and sell, or ultimately whether or not you succeed. Using nine key building blocks (representing nine core business elements), a BMC gives you a highly usable strategic tool to develop and display your business model. What makes this template great for your team? It’s quick and easy to use, it keeps your value proposition front and center, and it creates a space to inspire ideation.
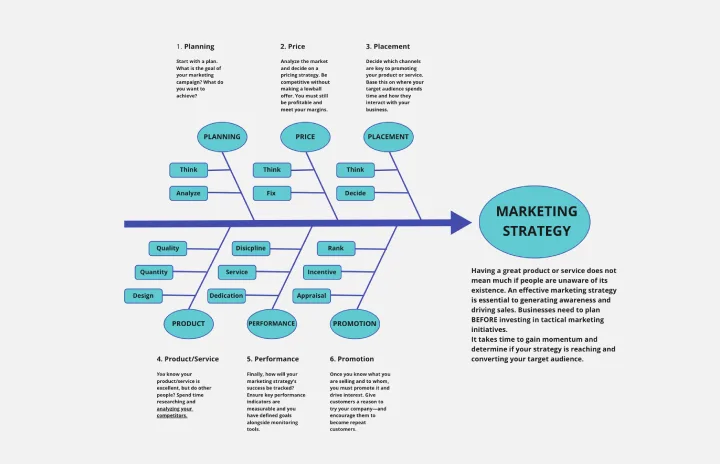
Fishbone Diagram for Marketing
Works best for:
Fishbone diagram
Identifying the root causes of marketing challenges is essential for effective strategy development. The Fishbone Diagram for Marketing template helps you systematically explore factors affecting your marketing efforts. Categorize potential causes into areas such as market research, product positioning, promotional strategies, and distribution channels. This structured analysis enables your team to pinpoint and address issues, optimizing marketing campaigns.
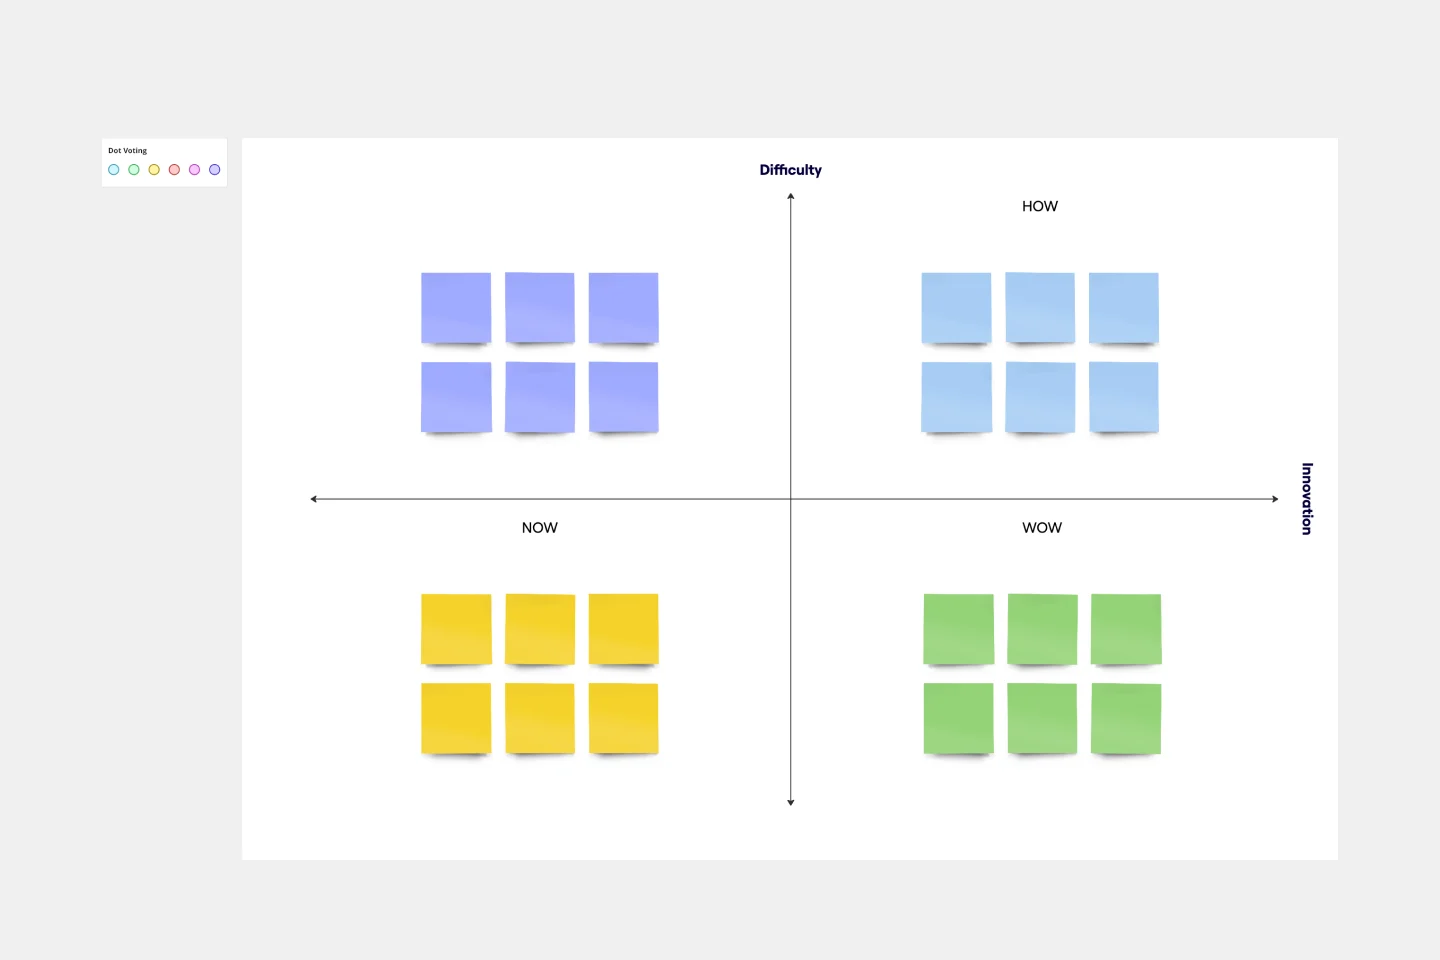
How Now Wow Matrix Template
Works best for:
Ideation, Product Management, Prioritization
There are no bad ideas in a brainstorm — but some are more original and easier to implement. The How Now Wow matrix is a tool that helps you identify and organize those great ideas, as well as reinvigorates your team to think creatively and take risks (a taller order as you scale). Grab this template to create your own matrix, then rank the ideas you generated in a brainstorm as “How” (difficult to implement), “Now” (easy to implement), or “Wow” (both original and easy to implement).
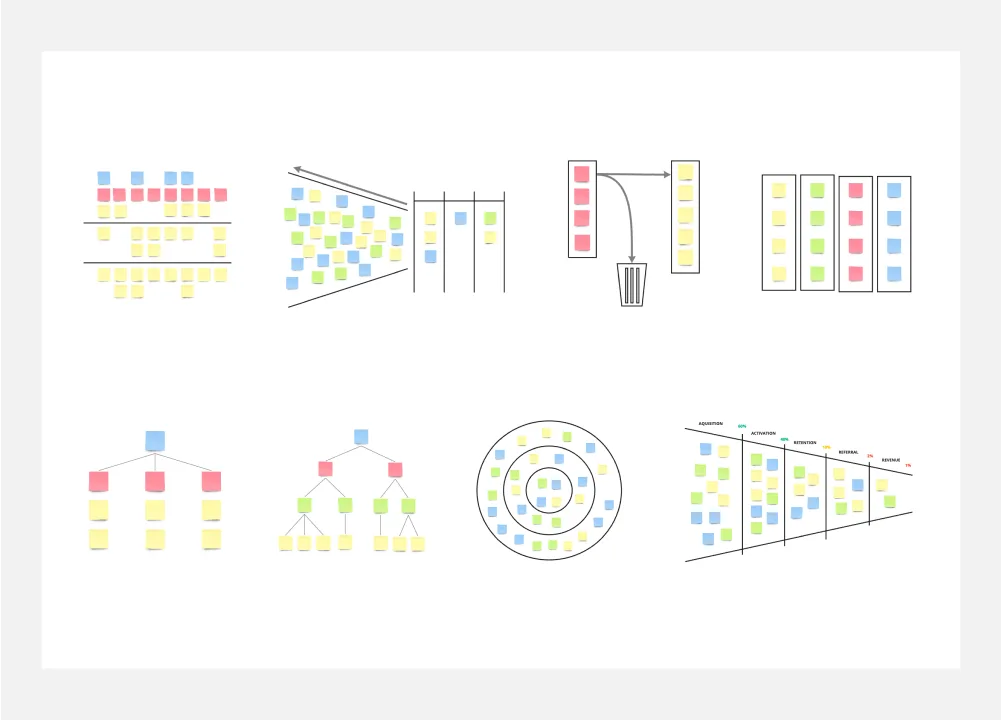
8 Different Ways to Organize Your Backlog
Works best for:
Agile
Explore 8 different techniques for managing and prioritizing work effectively with this template. From prioritization matrices to story mapping, it offers a comprehensive overview of backlog management strategies. By understanding the strengths and limitations of each approach, teams can tailor their backlog organization to optimize workflow, empowering teams to stay organized and focused on delivering value.