Fishbone Diagram for Quality Control
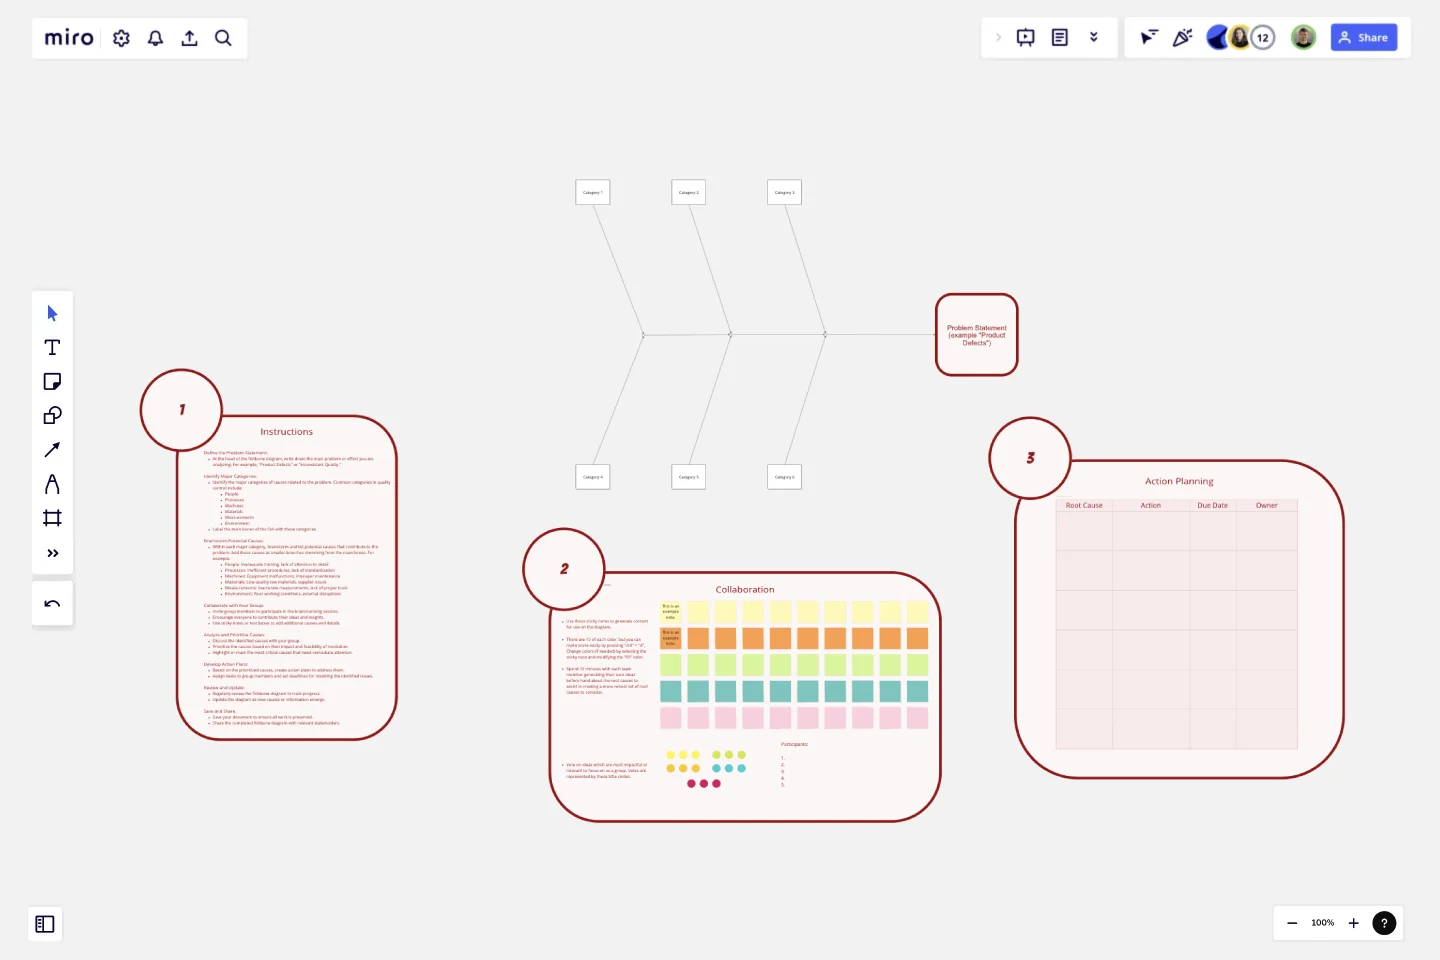
The Fishbone Diagram for Quality Control template is a specialized tool designed to help quality control teams systematically analyze and identify the root causes of quality-related issues.
Here’s why you should consider using this template:
Key Features:
Problem-Centric Design:
The diagram starts with a clear definition of the problem or effect you are addressing, such as "Product Defects" or "Inconsistent Quality," providing a focused approach to problem-solving.
Major Categories:
The template includes predefined categories relevant to quality control, such as People, Processes, Machines, Materials, Measurements, and Environment. These categories help in organizing potential causes systematically.
Structured Brainstorming:
Each category has branches for listing potential causes, encouraging thorough brainstorming and ensuring that no aspect of the quality control process is overlooked.
Collaborative Framework:
The template is designed for team collaboration, allowing multiple users to contribute their insights and ideas in a structured manner, fostering a comprehensive analysis.
Visual Clarity:
The fishbone (Ishikawa) diagram's visual structure makes it easy to understand the relationships between the problem and its potential causes, facilitating better communication and discussion among team members.
Why Use This Template?
Systematic Problem Analysis:
The Fishbone Diagram for Quality Control template helps in systematically breaking down complex problems into manageable parts, making it easier to identify root causes.
Holistic View:
By considering multiple categories, the template ensures that all possible aspects of the quality control process are examined, leading to a more thorough investigation.
Improved Collaboration:
The template promotes team collaboration, ensuring that diverse perspectives are considered, which can lead to more innovative solutions and a better understanding of the problem.
Enhanced Decision-Making:
The structured approach of the template aids in prioritizing causes based on their impact, helping teams focus on the most critical areas first, thus improving decision-making and action planning.
Effective Communication:
The visual nature of the fishbone diagram makes it easier to communicate findings and strategies to stakeholders, ensuring that everyone is on the same page.
By using the Fishbone Diagram for Quality Control template, teams can effectively analyze quality control issues, identify root causes, and develop targeted action plans to improve product quality and process consistency.
This template was created by Anthony.
Get started with this template right now.
Four-Circle Venn Diagram
Works best for:
Venn Diagram
The Four Circle Venn Diagram template is designed for comparing four sets of data. Use this tool to identify commonalities and differences across multiple categories. This template is ideal for complex data analysis, strategic planning, and academic research. It helps you visually organize information, making it easier to understand and communicate insights. Perfect for educators, researchers, and professionals in need of detailed comparison tools.
Workday Calendar - Timeline 2024
Works best for:
Planning, Timeline
The Workday Calendar Timeline 2024 template is ideal for planning your work year. It helps you organize work schedules, track important deadlines, and plan for holidays and events. This template ensures you stay productive and on top of your work commitments.
Floor Plan Template
Works best for:
Operations, Workshops
Maybe you’re planning a big occasion or event. Or maybe you’re arranging seating structures and traffic flows that are more permanent. Either way, creating a floor plan—an overhead scaled diagram of the space—is equal parts functional and fun. This template will let you visualize how people will move about the space and know quickly if the space will do what you need, before you commit time, money, or resources. And you’ll be able to get as detailed as you want—finding the right measurements and dimensions, and adding or removing appliances and furniture.
Simple Project Plan Template
Works best for:
Project Management, Strategic Planning, Project Planning
A simple project is a North Star for your team, helping them answer any big questions about the project. The project plan should describe the nature of the plan, why you’re doing it, how you’ll make it happen, how you’ll carry out each step of the process, and how long each step is projected to take. If you’re a project manager or team lead, use this template to start a simple project plan, which can then be adapted to suit internal team projects or external client partner projects.
Timeline Workflow by Reza Zolf
Works best for:
Planning, Strategy
The Timeline Workflow template helps streamline your project workflows. It’s perfect for visualizing processes, identifying bottlenecks, and optimizing tasks. This template enhances team collaboration and ensures smooth project execution.
Competitor Product Research
Works best for:
Product Management, Planning
The Competitor Product Research template assists product teams in analyzing competitor offerings and market landscapes effectively. By identifying competitor strengths, weaknesses, and market trends, this template enables teams to uncover insights and opportunities for differentiation. With sections for conducting feature comparisons, SWOT analysis, and market positioning assessments, it facilitates informed decision-making and strategic planning. This template serves as a valuable resource for gaining competitive intelligence and driving product innovation and differentiation.
