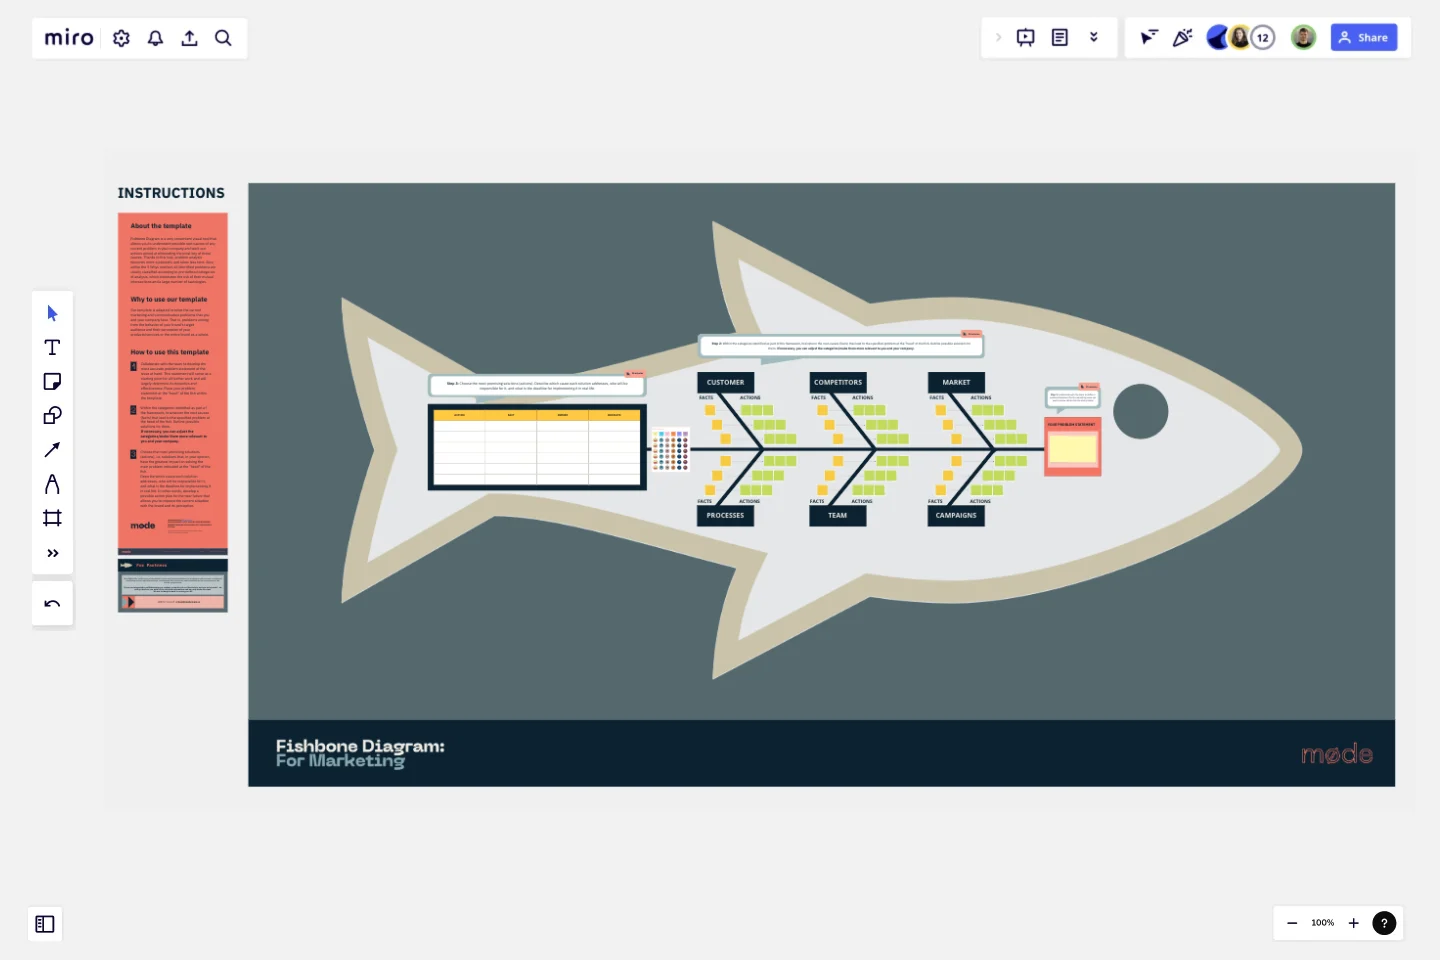
Fishbone Diagram for Marketing
Fishbone Diagram is a very convenient visual tool that allows you to understand possible root causes of any current problem in your company and work out actions aimed at eliminating the most key of these causes.
Thanks to this tool, problem analysis becomes more systematic and takes less time. Also, unlike the 5 Whys method, all identified problems are clearly classified according to pre-defined categories of analysis, which eliminates the risk of their mutual intersections and a large number of tautologies.
Why to use our template
Our template is adapted to solve the current marketing and communication problems that you and your company face. That is, problems arising from the behavior of your brand's target audience and their perception of your products/services or the entire brand as a whole.
How to use this template
Collaborate with the team to develop the most accurate problem statement of the issue at hand. This statement will serve as a starting point for all further work and will largely determine its dynamics and effectiveness.
Within the categories identified as part of the framework, brainstorm the root causes (facts) that lead to the specified problem at the head of the fish. Outline possible solutions for them. If necessary, you can adjust the categories/make them more relevant to you and your company.
Choose the most promising solutions (actions), i.e. solutions that, in your opinion, have the greatest impact on solving the main problem indicated at the "head" of the fish. Describe which cause each solution addresses, who will be responsible for it, and what is the deadline for implementing it in real life. In other words, develop a possible action plan for the near future that allows you to improve the current situation with the brand and its perception.
This template was created by Mode Team.
Get started with this template right now.
Budget Planning Template
Works best for:
Planning
A budget template is a comprehensive yet flexible framework that allows you to monitor and control your finances. With user-friendly functions and numerous customization options, this tool helps you create a budget tailored to your specific needs and goals. Whether new to budgeting or an experienced financial planner, a budget template is an excellent tool to help you manage finances effectively.
Gantt Chart Template
Works best for:
Project Management, Mapping, Roadmaps
Simplicity, clarity, and power — that’s what make Gantt charts such a popular choice for organizing and displaying a project plan. Built upon a horizontal bar that represents the project progress over time, these charts break down projects by task, allowing the whole team to see the task status, who it’s assigned to, and how long it will take to complete. Gantt charts are also easily shareable among team members and stakeholders, making them great tools for collaboration.
Change Control Process Template
Works best for:
Agile Methodology, Documentation, Product Management
You can predict, research, and plan for every detail of a project to go a certain way—then along comes the unforeseen and modifications are needed. That’s when a change control process comes into play. It helps define the right steps to take, gives stakeholders full visibility, and reduces the chances of errors and disruption. And this template is easy to use and highly effective—for ensuring that proposed changes are reviewed before they’re implemented, and empowering teams to veto changes that might prove unnecessary or disruptive.
Work Breakdown Structure Template
Works best for:
Project Management, Mapping, Workflows
A work breakdown is a project management tool that lays out everything you must accomplish to complete a project. It organizes these tasks into multiple levels and displays each element graphically. Creating a work breakdown is a deliverable-based approach, meaning you’ll end up with a detailed project plan of the deliverables you must create to finish the job. Create a Work Breakdown Structure when you need to deconstruct your team's work into smaller, well-defined elements to make it more manageable.
Sustainable Product Innovation Board
Works best for:
Product Management, Planning
The Sustainable Product Innovation Board template supports sustainable product development practices. By integrating sustainability criteria into product ideation, design, and implementation processes, this template fosters eco-friendly product innovation. With sections for evaluating environmental impacts and setting sustainability goals, it enables teams to create products that minimize ecological footprints and promote social responsibility. This template serves as a framework for driving sustainable business practices and meeting consumer demands for environmentally conscious products.
Monthly Planner Template
Works best for:
Operations, Strategic Planning, Project Planning
To knock out every task and accomplish every goal for the month, it helps to take a big picture, 10,000 foot view of things—meaning a 30-day view. That’s why a monthly calendar can come in so handy, especially on bigger projects. Use our template to create a visual representation that helps you track and space out every deadline and to-do, both for individuals and full teams. You’ll even be able to customize it your way, with images, video, and sticky notes.
