Fishbone Diagram for Manufacturing
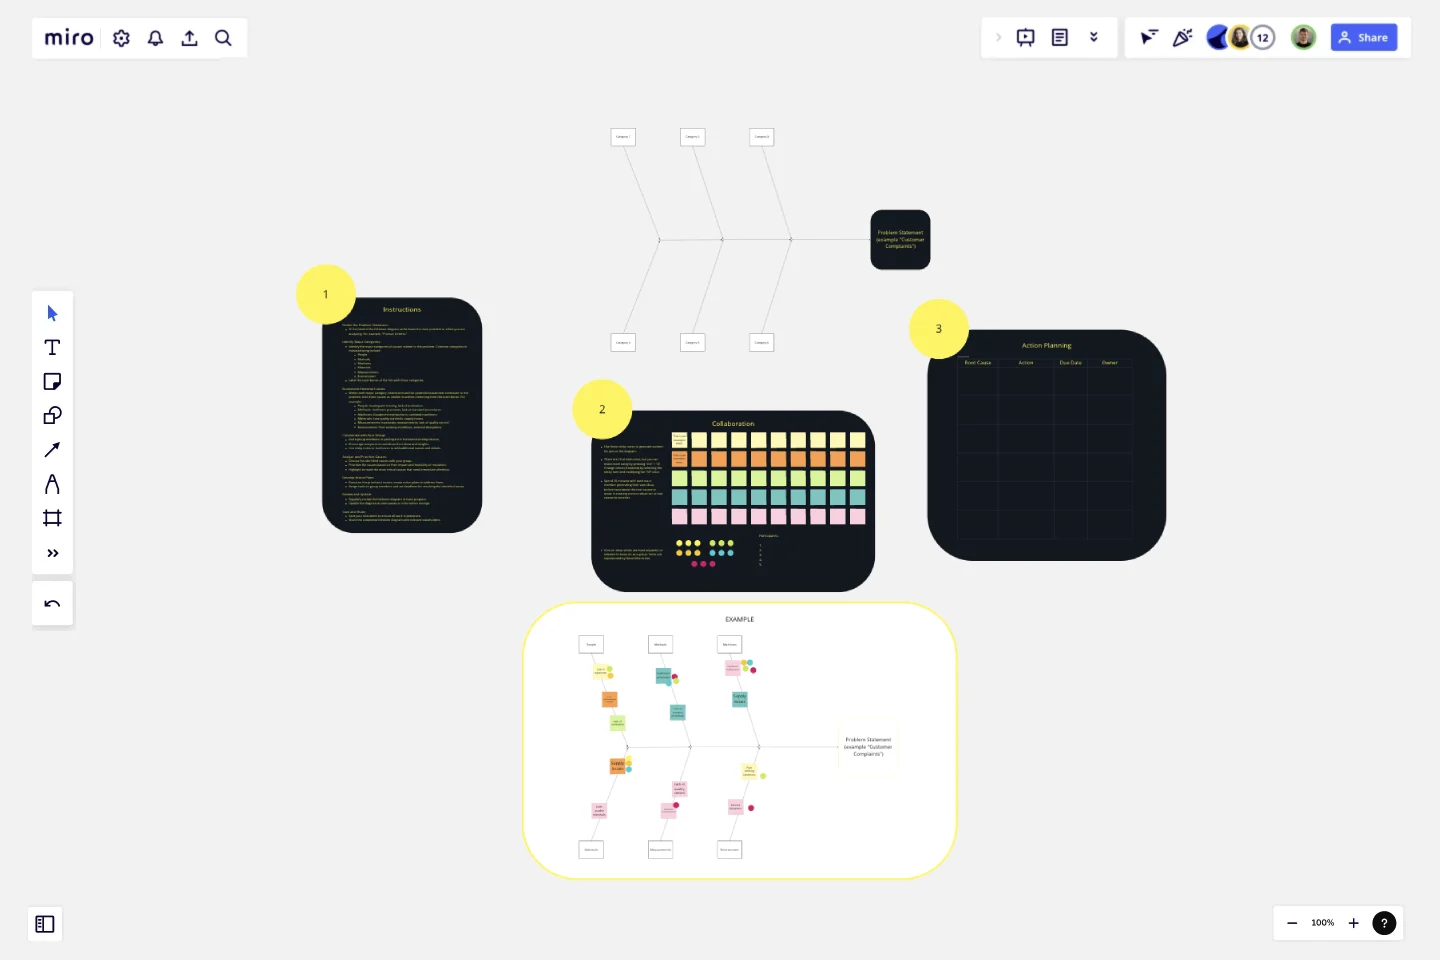
The Fishbone Diagram for Manufacturing template is a specialized tool designed to help teams systematically analyze and identify the root causes of manufacturing-related issues.
Here’s why you should consider using this template:
Key Features:
Problem-Centric Design:
The diagram starts with a clear definition of the problem or effect you are addressing, such as "Product Defects" or "Production Delays," providing a focused approach to problem-solving.
Major Categories:
The template includes predefined categories relevant to manufacturing, such as People, Methods, Machines, Materials, Measurements, and Environment. These categories help in organizing potential causes systematically.
Structured Brainstorming:
Each category has branches for listing potential causes, encouraging thorough brainstorming and ensuring that no aspect of the manufacturing process is overlooked.
Collaborative Framework:
The template is designed for team collaboration, allowing multiple users to contribute their insights and ideas in a structured manner, fostering a comprehensive analysis.
Visual Clarity:
The fishbone (Ishikawa) diagram's visual structure makes it easy to understand the relationships between the problem and its potential causes, facilitating better communication and discussion among team members.
Why Use This Template?
Systematic Problem Analysis:
The Fishbone Diagram for Manufacturing template helps in systematically breaking down complex problems into manageable parts, making it easier to identify root causes.
Holistic View:
By considering multiple categories, the template ensures that all possible aspects of the manufacturing process are examined, leading to a more thorough investigation.
Improved Collaboration:
The template promotes team collaboration, ensuring that diverse perspectives are considered, which can lead to more innovative solutions and a better understanding of the problem.
Enhanced Decision-Making:
The structured approach of the template aids in prioritizing causes based on their impact, helping teams focus on the most critical areas first, thus improving decision-making and action planning.
Effective Communication:
The visual nature of the fishbone diagram makes it easier to communicate findings and strategies to stakeholders, ensuring that everyone is on the same page.
By using the Fishbone Diagram for Manufacturing template, teams can effectively analyze manufacturing issues, identify root causes, and develop targeted action plans to improve production quality and efficiency.
This template was created by Anthony.
Get started with this template right now.
Data Migration Plan Template
Works best for:
Data Migration, Planning
The Data Migration Plan Template is a useful tool for any data migration project, providing a simple and flexible structure. The template outlines the various stages of data migration and can be customized to meet the specific needs of your project. This ensures that the plan remains relevant and effective regardless of the scale or complexity of the migration.
Event Brief Template
Works best for:
Meetings, Workshops, Project Planning
For most any organization, throwing a big deal event is…a big deal. An event can bring in publicity, new clients, and revenue. And planning it can require a substantial chunk of your overall resources. That’s why you’ll want to approach it like a high-stakes project, with clearly outlined goals, stakeholders, timelines, and budget. An event brief combines all of that information in a single source of truth that guides the events team, coordinator, or agency—and ensures the event is well-planned and well-executed.
Meeting Organizer Template
Works best for:
Meetings, Workshops, Project Planning
When it comes to ideas generated during a meeting, you want quantity AND quality. So why choose? Our meeting organizer template will maximize your meeting’s chances of yielding lots of great ideas. It will give you a simple, efficient way to design any activity (including meetings and daily planning) and make sure remote teammates know just what the meeting aims to accomplish. And you can give your meeting organizer power by connecting Miro to your favorite apps and services: Atlassian’s JIRA, Google Drive, Slack, Trello, DropBox and OneDrive.
Service Blueprint by Hyperact
Works best for:
Research & Design
The Service Blueprint template is perfect for visualizing the orchestration of service components. It maps out frontstage and backstage elements, helping you analyze and enhance customer experiences. Use this template to align teams, identify pain points, and streamline processes, ensuring a seamless service delivery. It's ideal for creating a shared understanding of service dynamics among stakeholders and collaborators.
Brand Strategy Template
Works best for:
Marketing
Develop a brand strategy for new and existing brands with this fully guided Brand Strategy Template. Find new ways to build your brand and set your business up for success.
Porter's Five Forces Template
Works best for:
Leadership, Strategic Planning, Market Research
Developed by Harvard Business School professor Michael Porter, Porter’s Five Forces has become one of the most popular and highly regarded business strategy tools available for teams. Use Porter’s Five Forces to measure the strength of your current competition and decide which markets you might be able to move into. Porter’s Five Forces include: supplier power, buyer power, rivalry among existing competitors, the threat of substitute products or services, the threat of substitute products and services, and the threat of new entrants.
