Driver Diagram Template
Easily map out your objectives and break them into actionable components using the driver diagram template.
About the Driver Diagram Template
Add structure to projects using the driver diagram template to simplify complex objectives into understandable parts, ensuring a streamlined approach to achieving goals.
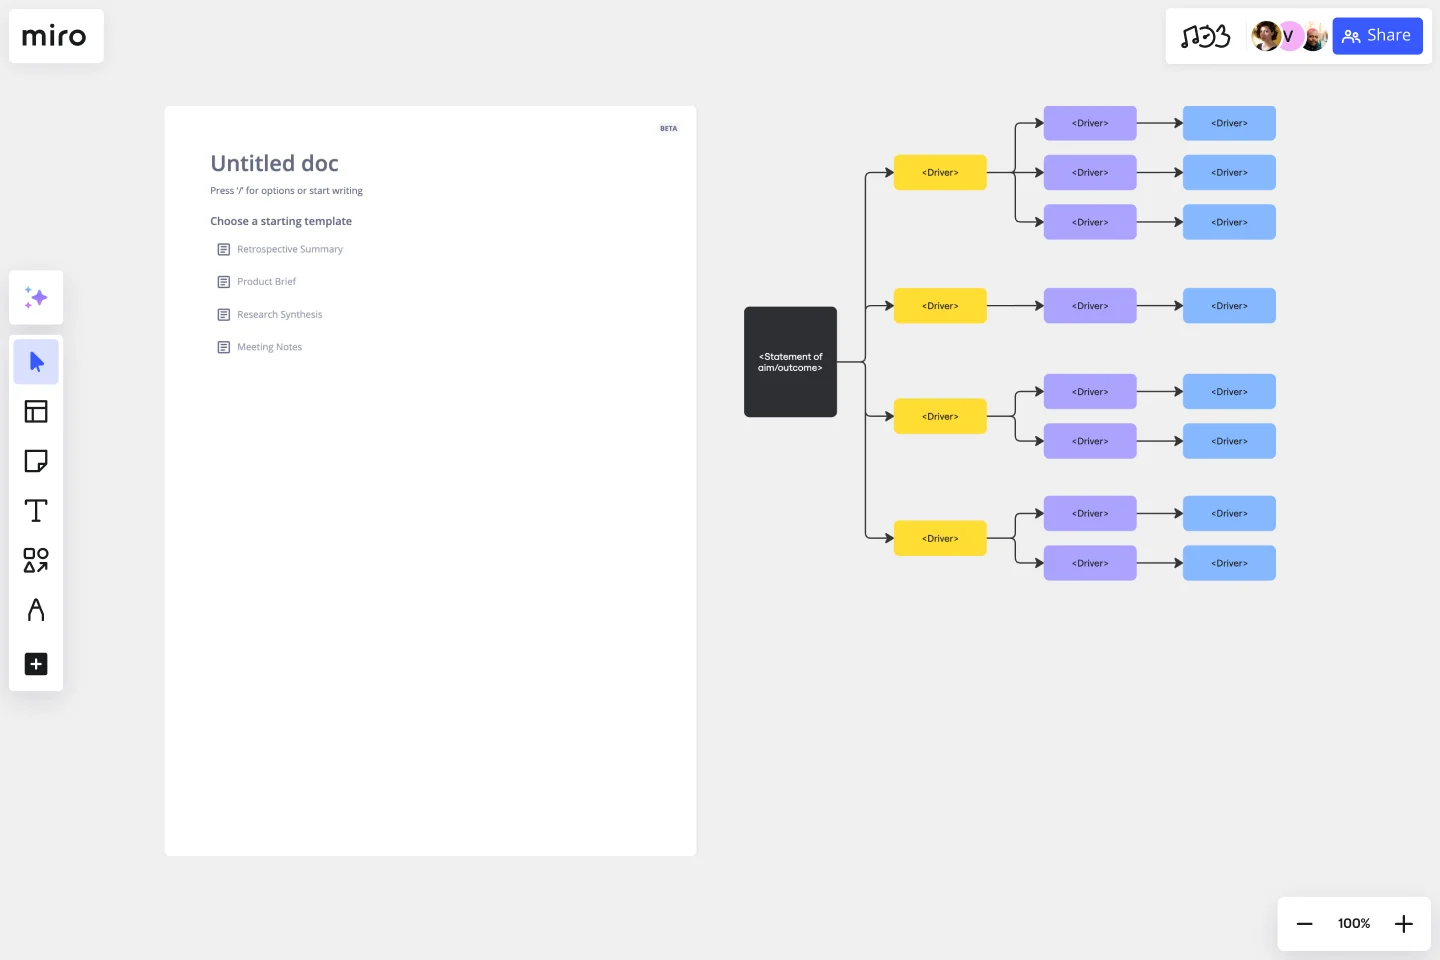
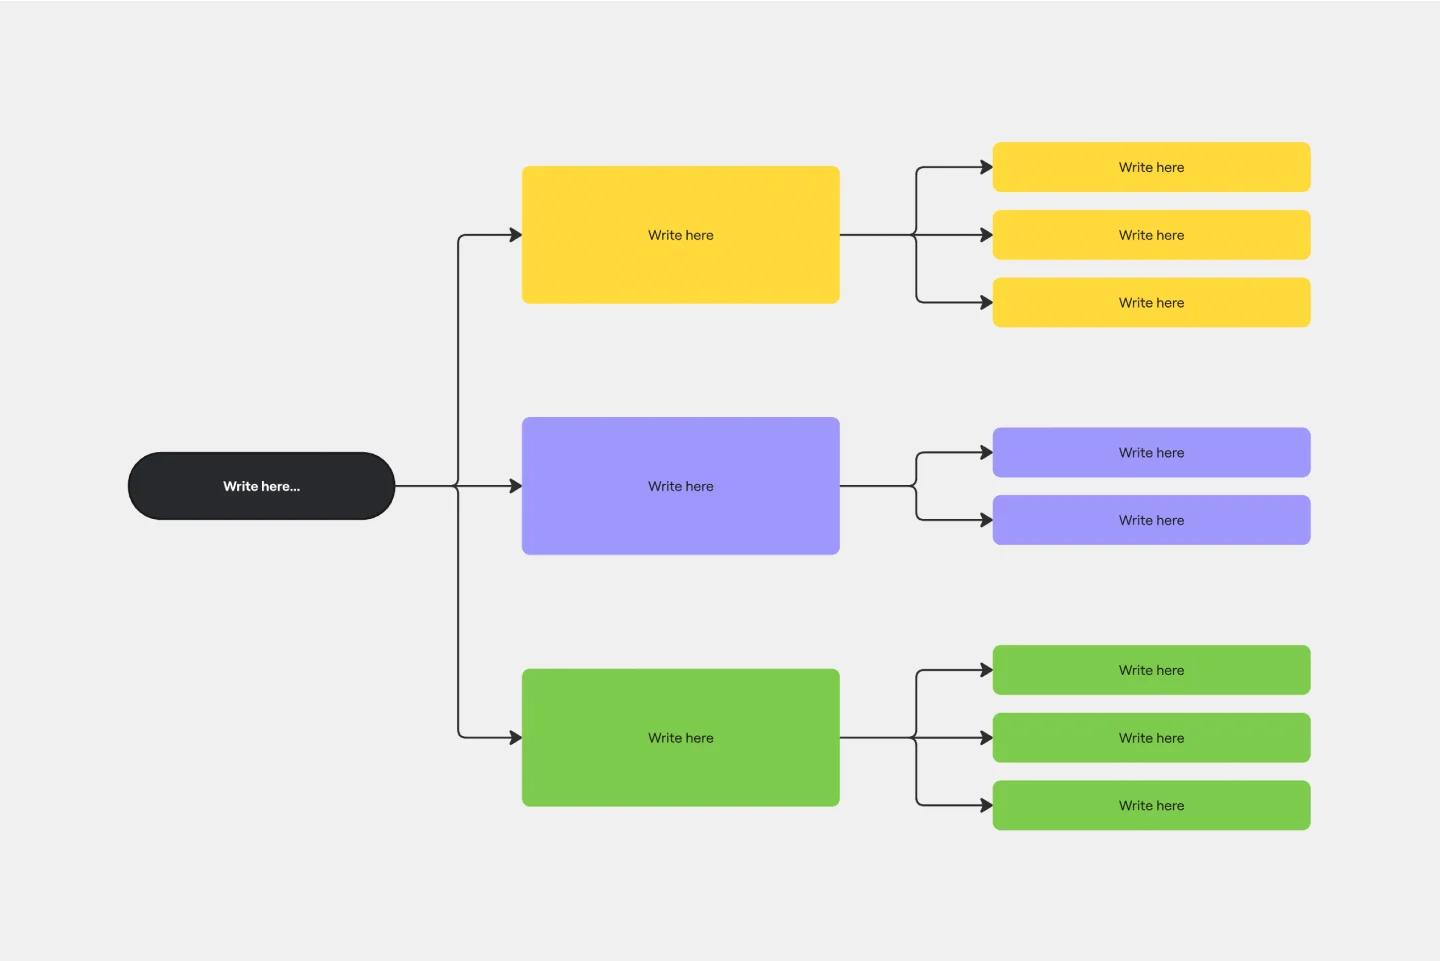
A driver diagram is a strategic visualization tool that delineates a main goal into its core contributors and actionable steps. Use this template to visualize and communicate the key drivers or factors that contribute to achieving a specific goal or outcome.
The template consists of three main areas:
Statement of aim/outcome: This is the heart of the diagram, indicating the ultimate objective or desired result.
Primary drivers: Directly stemming from the aim, these represent integral strategies or areas that are pivotal to achieving the overarching outcome.
Ideas: Branching out from each driver, these signify specific actions or initiatives that support the fulfillment of their respective drivers.
How to use the driver diagram template
The driver diagram template can be used to foster a shared understanding among team members, guide improvement efforts, and provide a structured approach to problem-solving and goal achievement. Here’s how to fill in the template to make it your own:
Add your primary aim: Starting with the "Statement of Aim/Outcome," define the primary goal or outcome that you want to achieve. This could be a desired improvement in a process, customer satisfaction, or any other measurable objective.
Expand your diagram: Edit the shapes and lines to add more drivers and connectors. Include secondary aims or sub-goals that are related to the primary aim. These secondary aims help break down the larger goal into more manageable components. Continue expanding the diagram to include drivers that directly impact the achievement of the secondary aims and, ultimately, the primary aim. Use arrows to indicate the relationships between different elements in the diagram.
Embed additional elements: Elevate the diagram by incorporating other elements, such as notes or reference images, to provide deeper context.
Why should you use a driver diagram template?
By visually representing the drivers and relationships, teams can better prioritize their efforts and focus on the most critical factors for success. Here are a few benefits the driver diagram template provides:
Visualization: Understand and define the cascade from overarching goals to specific actions.
Structured approach: Facilitate methodical planning by breaking down the goal into actionable steps.
Team collaboration: Encourage consistent understanding and teamwork towards a unified objective.
Efficient allocation: Allow for precise resource and time allocation based on priority and impact.
Track & refine: Filling in the driver diagram template makes monitoring progress and making necessary adjustments simpler.
If you'd prefer to start from scratch, diagramming with Miro is easy! You can choose from a wide range of diagramming shapes in Miro's extensive library, so you'll find just what you need.
Can I add more levels of ideas or drivers to the template?
Yes, the template is flexible and can be expanded to include additional layers or branches as your project needs.
How do I make the diagram more interactive?
Once you’ve added the driver diagram template to your Miro board, you have the option to add clickable links, annotations, and other interactive elements to enrich the user experience.
Can I color-code differently than what's shown?
Absolutely. The colors are customizable, allowing you to adapt based on preferences or significance.
Get started with this template right now.
Force Field Analysis Template
Works best for:
Diagramming, Strategic Planning
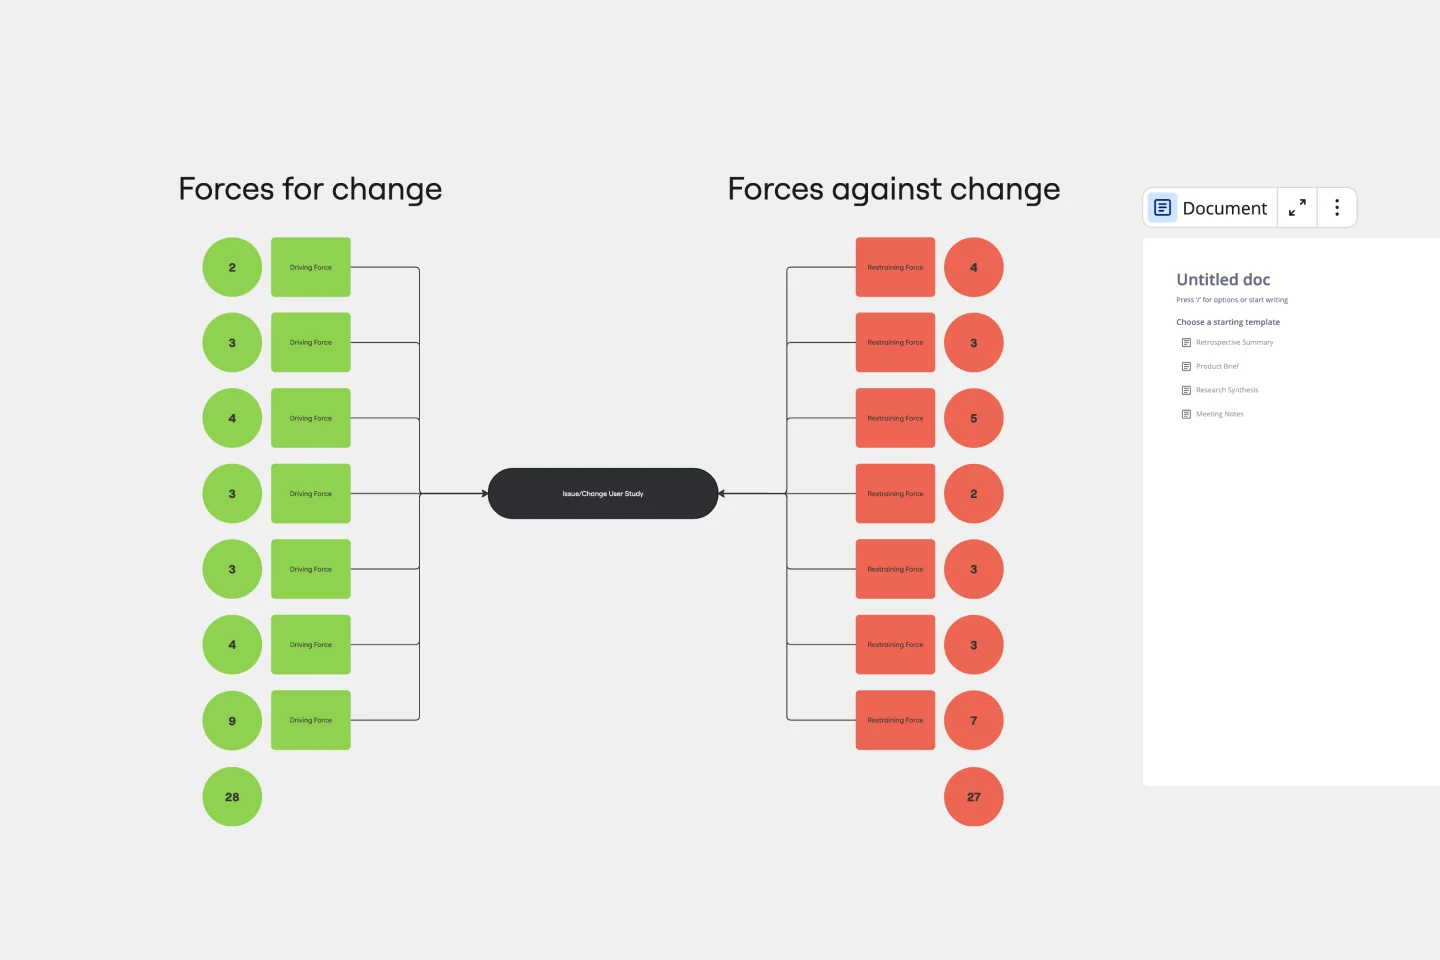
A Force Field Analysis Template is a powerful tool that helps teams identify and analyze the forces supporting or hindering progress toward a specific change or goal. This template provides a visual space where you can brainstorm and plot out 'driving forces' that push objectives forward and 'restraining forces' that prevent advancement, all on a single, intuitive board. One of the primary benefits of utilizing the Force Field Analysis template is that it fosters a shared understanding among team members. By visually mapping out and discussing each force, teams can prioritize efforts, build consensus on the central issues to tackle, and collaboratively devise strategic plans to strengthen positive influences while reducing negative ones.
Login Sequence Diagram Template
Works best for:
Diagramming, Technical Diagramming
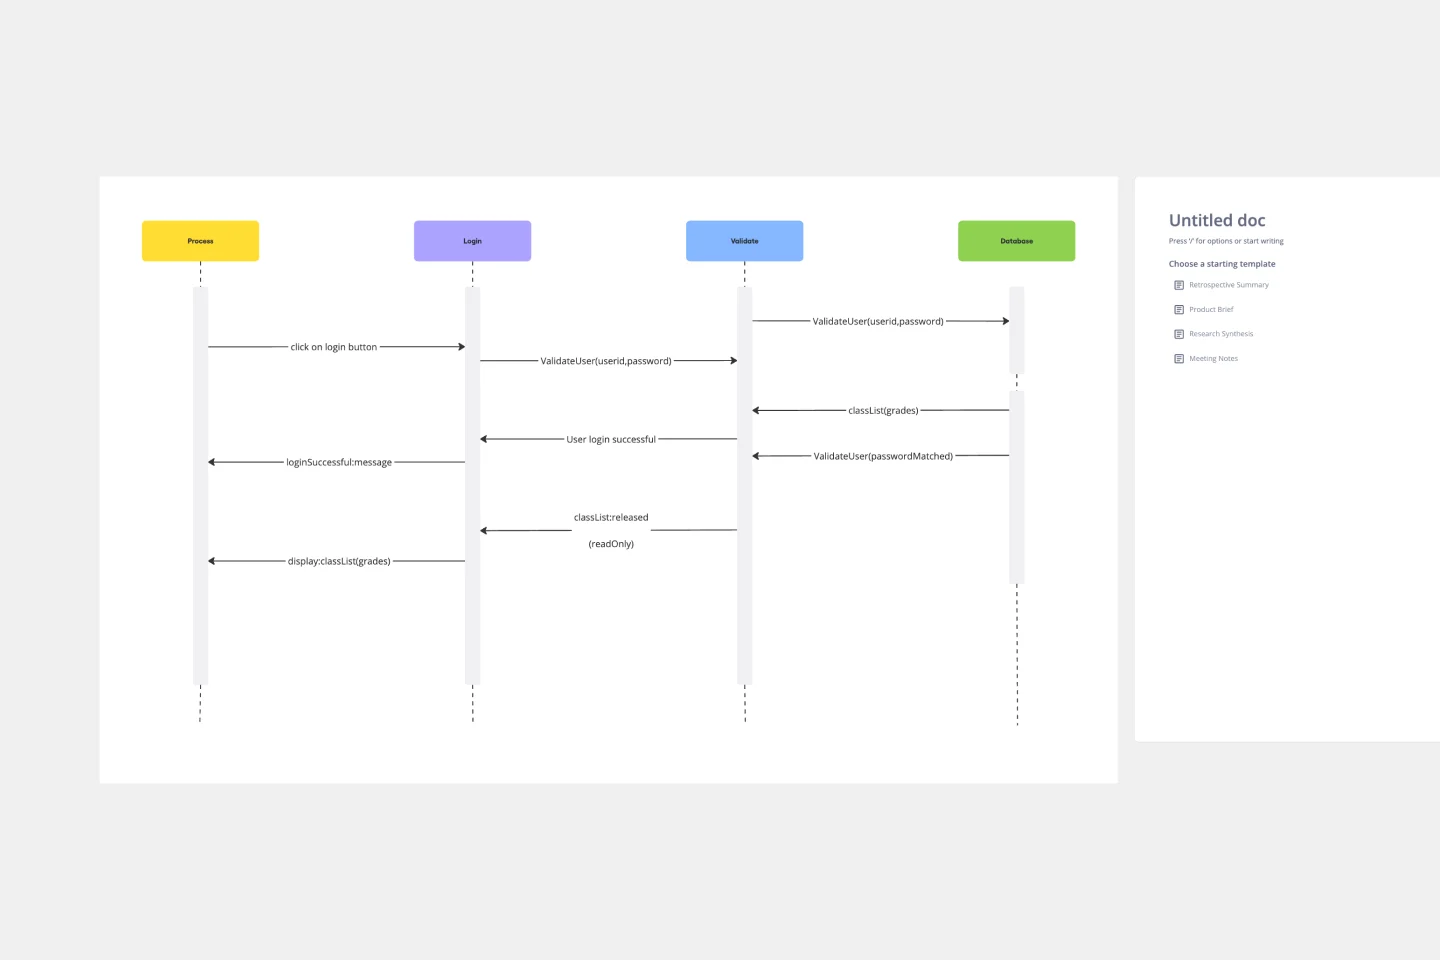
The UML Sequence Login Diagram Template is a valuable tool for visualizing user authentication processes. It breaks down complex login sequences into clear, visual components, facilitating collaborative understanding among team members, regardless of their technical expertise. This shared understanding is crucial for ensuring all stakeholders, from developers to project managers, are on the same page, leading to efficient decision-making and a smoother development process. The template's ability to translate technical details into an accessible format streamlines communication and significantly reduces the likelihood of misinterpretation or oversight, making it an essential asset in any software development project.
Automated Security Response on AWS Template
Works best for:
AWS
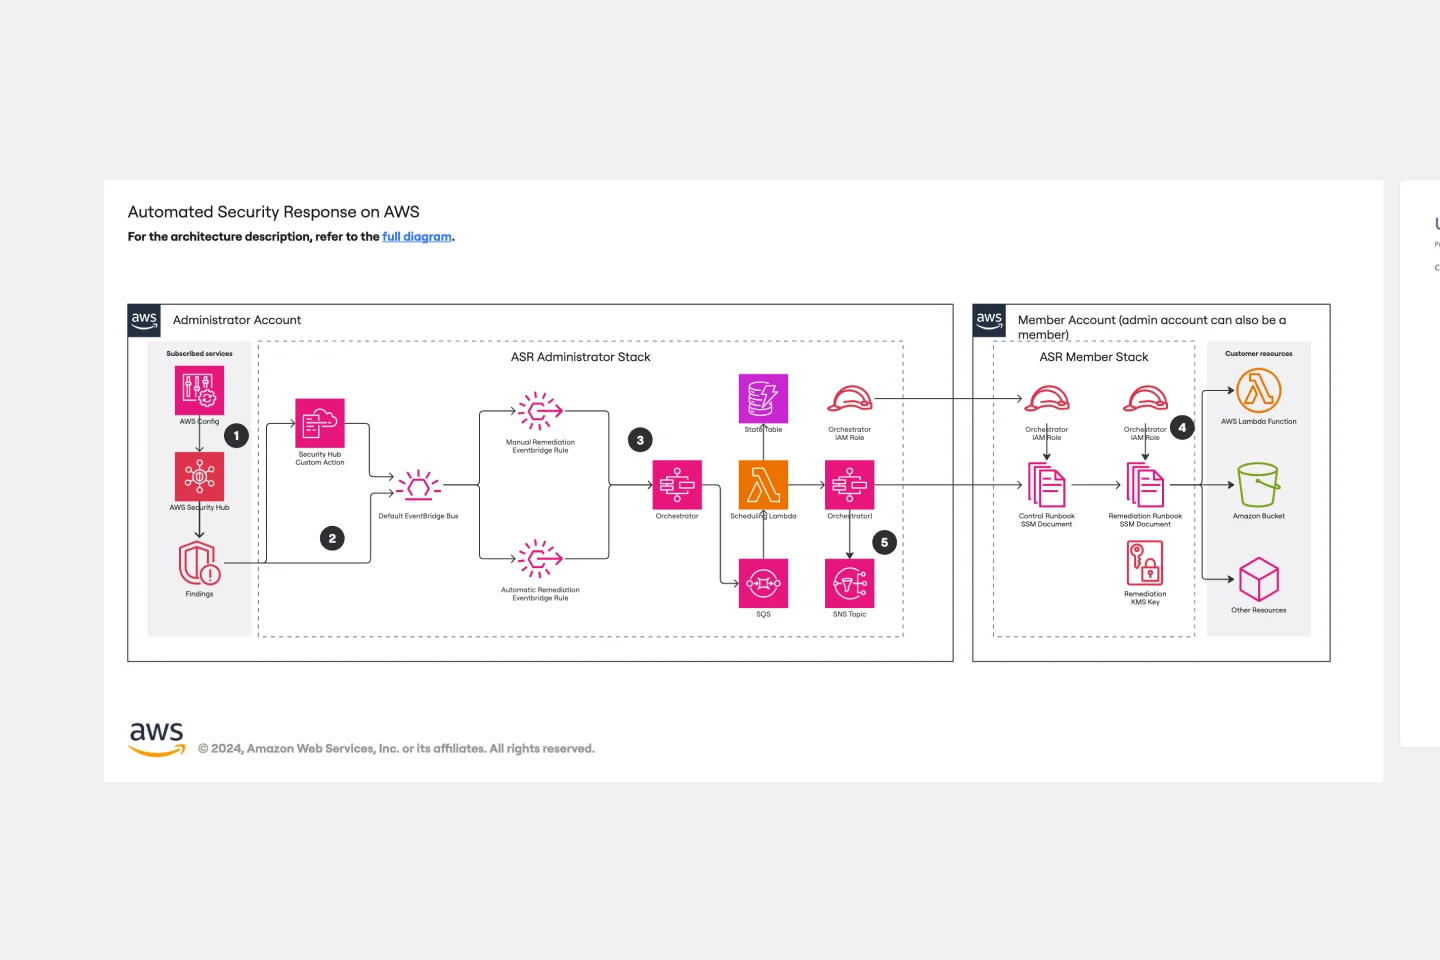
The Automated Security Response on AWS template is a tool for enhancing AWS security through automation, enabling quick identification and mitigation of threats with minimal manual effort. It integrates with AWS security services for a dynamic response mechanism, ensuring infrastructure security against evolving threats. This template streamlines operational efficiency, offers scalable and customizable security strategies, and accelerates threat response times, making it essential for improving AWS security posture.
CI/CD Pipeline Diagram Template
Works best for:
Diagramming, Development
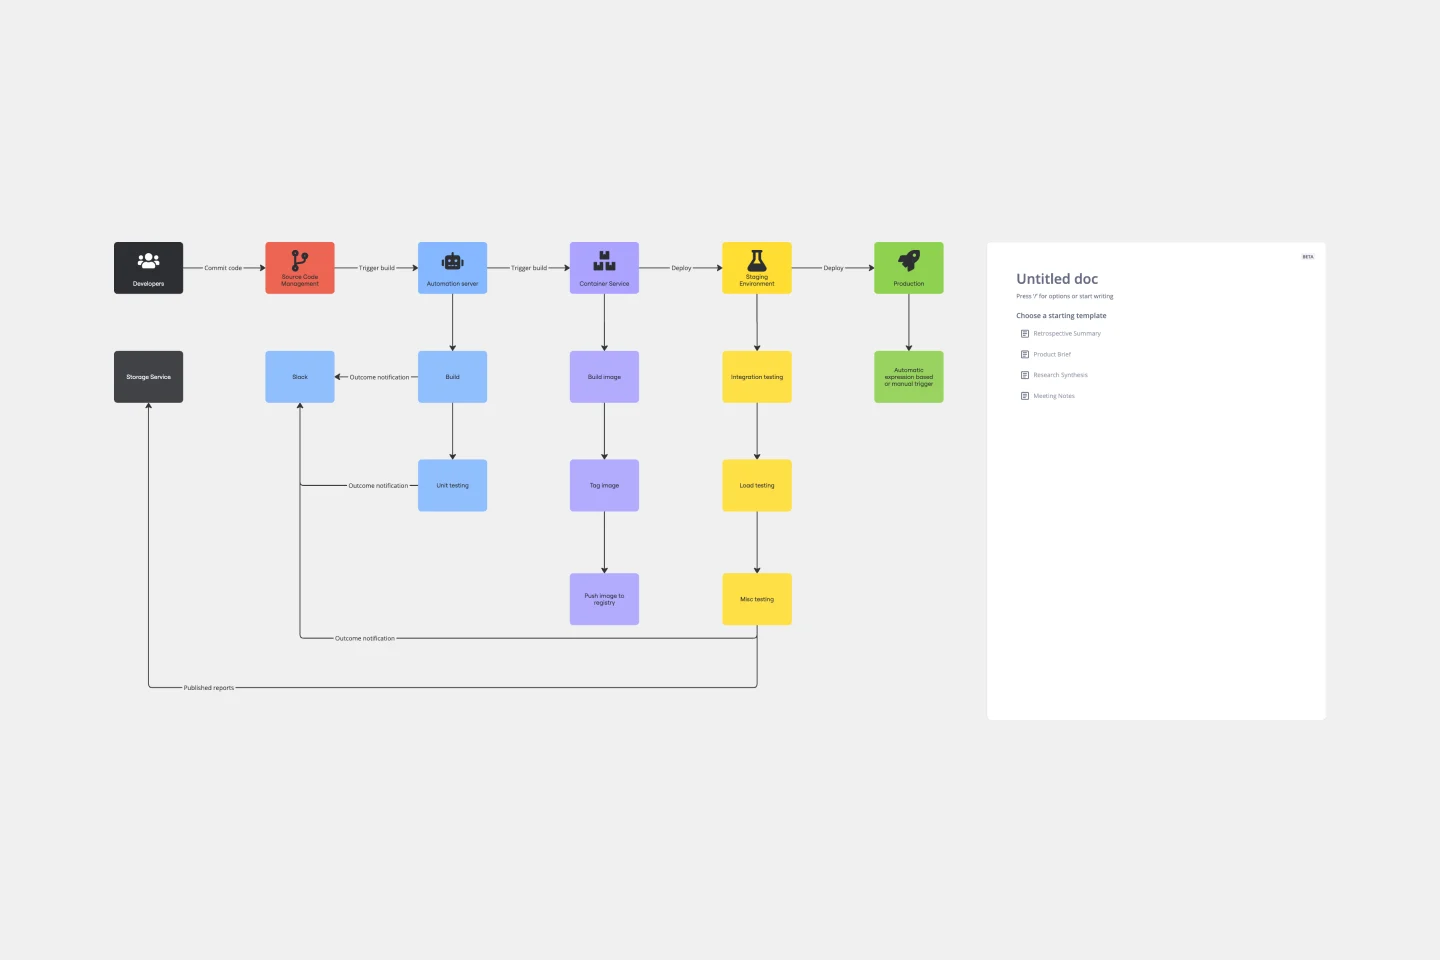
The CI/CD template is a well-designed roadmap for software deployment that enables a smooth and automated flow from development to production. This strategic layout includes critical elements such as source code management, automation servers, container orchestration, staging environments, and the final deployment to production. One of the key benefits of using such a template is that it builds a robust deployment pipeline, which significantly reduces manual intervention and human error. By visualizing each step and integrating automation throughout, teams can achieve faster deployment cycles, ensuring that new features, updates, and fixes are delivered to users promptly and reliably. This enhanced pace does not compromise quality, as the template inherently supports continuous testing and quality assurance, ensuring that each update is quick but also secure and stable before it is delivered to the end user.
Brace Map Template
Works best for:
Diagramming, Planning
Transform your brainstorming and planning tasks with Miro's Brace Map Template. This powerful visual thinking tool clarifies complex concepts by creating a visual hierarchy that organizes each element precisely. The central idea connects seamlessly to sub-elements through intuitive braces, providing an easily understandable framework. This clarity enhances individual understanding and fosters collaborative efforts, allowing teams to navigate complex ideas with precision and coherence. The Brace Map Template will enable you to organize your thoughts efficiently and solve complexities visually.
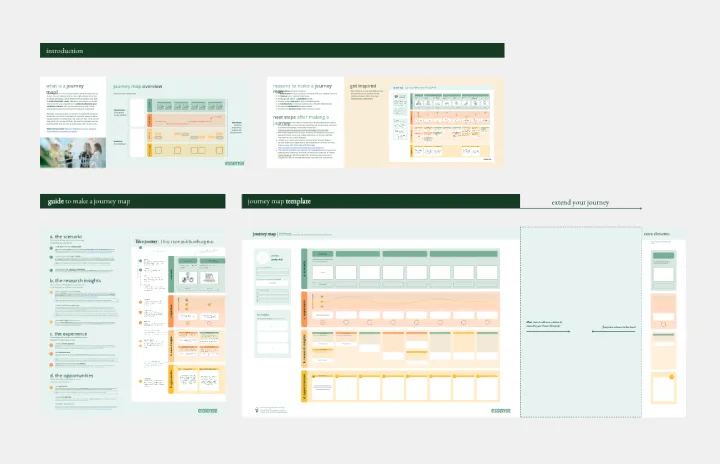
Journey Map To Plot the Customer Experience
Works best for:
Customer Journey Map
A journey is a tool to map out the customer experience of (a part of) your product/service in a visual way.