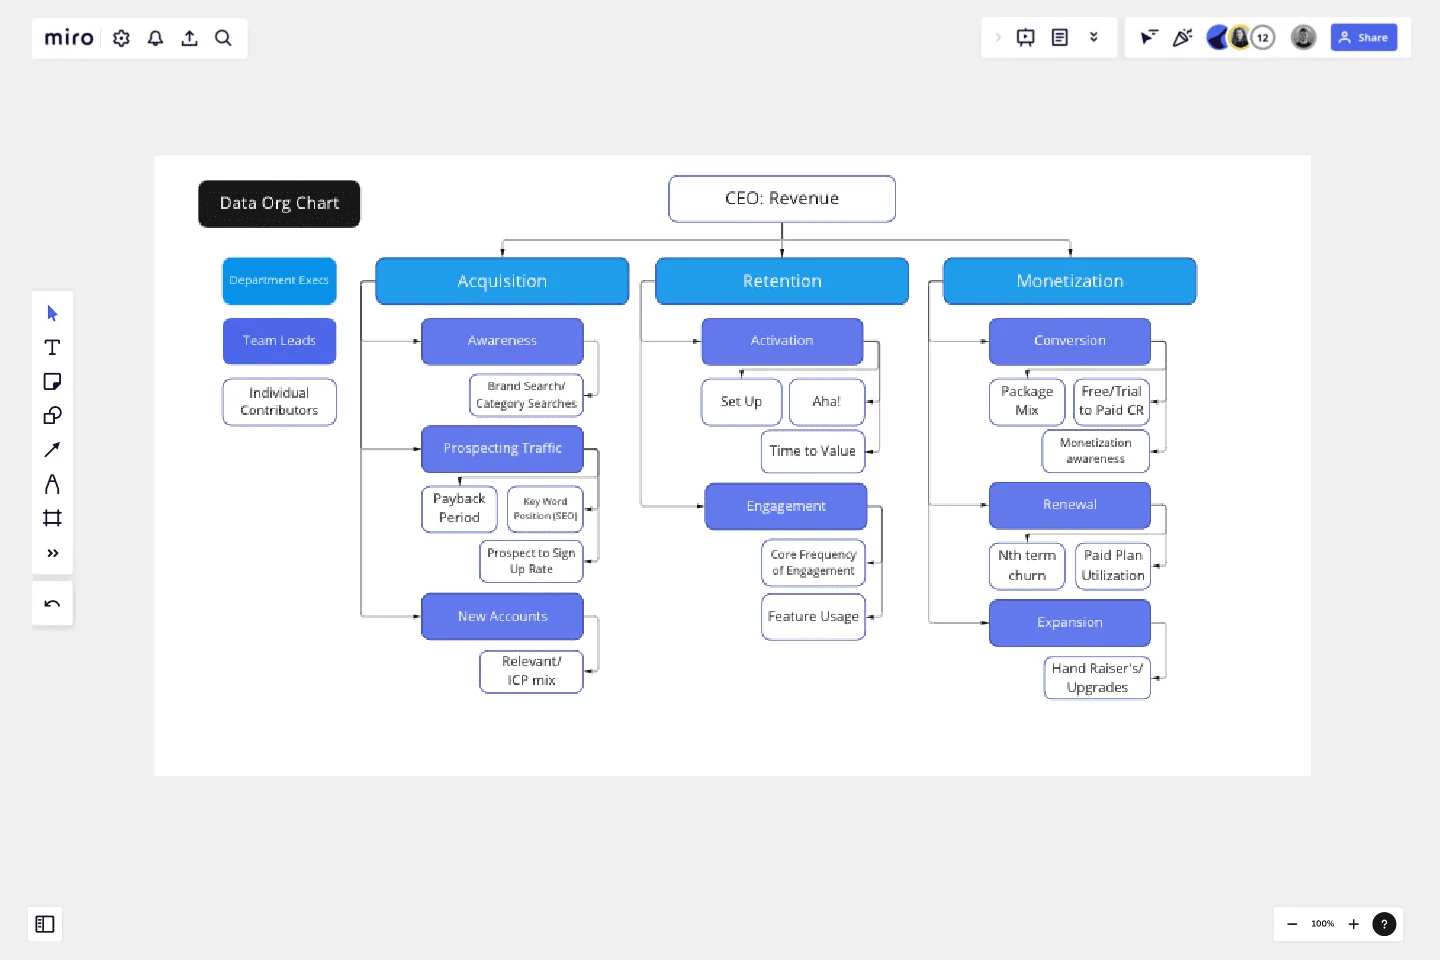
Data Org Chart
Succeed with your data-driven culture by creating a data 'org chart'.
This template will be most useful for Analysts, PMs, Marketers and Department Leaders who want to achieve data accountability with tight connection between initiatives and business outcomes. Having clear roles and responsibilities is always the key!
How to read this chart:
Individual Contributors — where 90% of the work is happening and how all of the growth initiatives are measured. Individual Contributor KPIs are constantly iterated (~ on quarterly basis) in the search for the best causality and predictive power. These KPIs are used for setting initiative goals and are often reflected in the individual team member quarterly goals.
Team Leads — responsible for the evaluation and selection of ICs. Team Lead metrics are often set as 'company metrics' on the leadership level and have a clear source of truth for self-serve consumption. Owned by PMs or Marketers.
Common pitfalls: The biggest mistake is to not set ownership of the team metrics. It can result in vanity IC selection or floating definitions ultimately leading to distrust and data-culture failure.
Department execs — data levers, not KPIs, and are the closest predictors to revenue. Department exec metrics are owned by the head of growth, product, marketing, etc.
Common pitfalls: Unfortunately, often misassigned. For example, in a product-led monetization model, only sales own revenue.
CEO — fearless leader, but not a doer.
Common pitfalls: Looking at revenue as your metric is being at least 3 months late to the party of your ability to impact it.
Use this template to:
Map out all of the metrics your cross-functional team is tracking and visualize the relationships (or lack thereof) to ‘Team Leads’ and ‘Department Execs’ metrics.
Highlight lack of ownership of certain metrics.
Understand over/under focus on certain growth levers, if no individual contributors are being tracked under ‘Team Lead’ or ‘Department Execs’ metrics.
Understand correlation vs. causation by reviewing data org chart on a quarterly basis.
Become hyper focused on metrics that matter the most.
This template was created by Elena Verna.
Get started with this template right now.
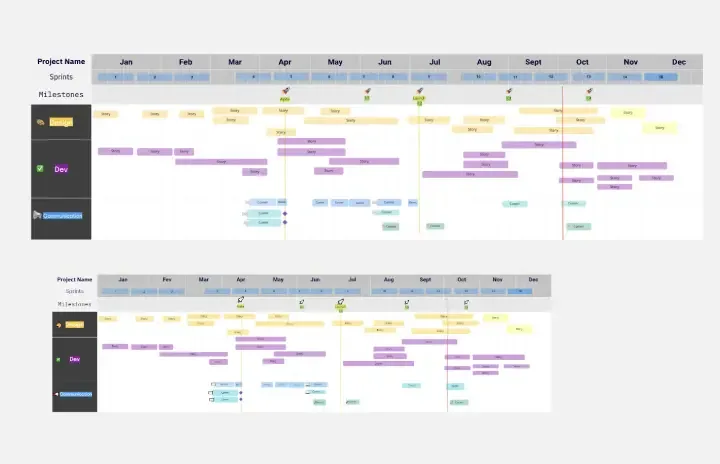
Project - Timeline & Key Infos
Works best for:
Agile, Project Management
The Project - Timeline & Key Infos template provides a visual framework for planning and tracking project timelines, milestones, and key information. It enables teams to align on project objectives, allocate resources, and monitor progress effectively. With customizable timelines and informative dashboards, this template empowers project managers and stakeholders to stay organized and informed throughout the project lifecycle, ensuring successful delivery within scope, time, and budget constraints.
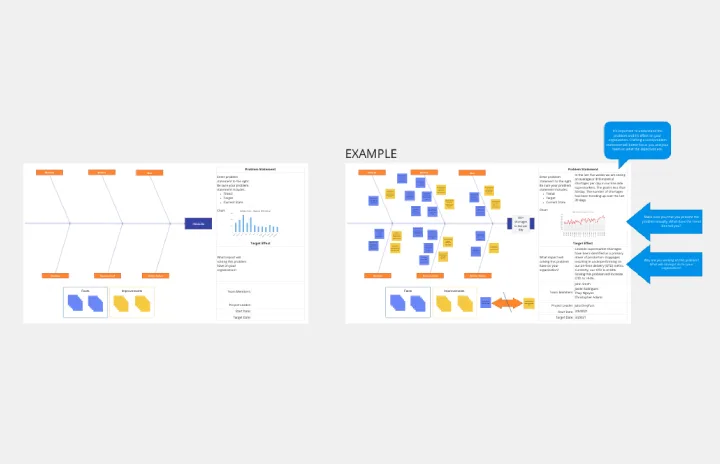
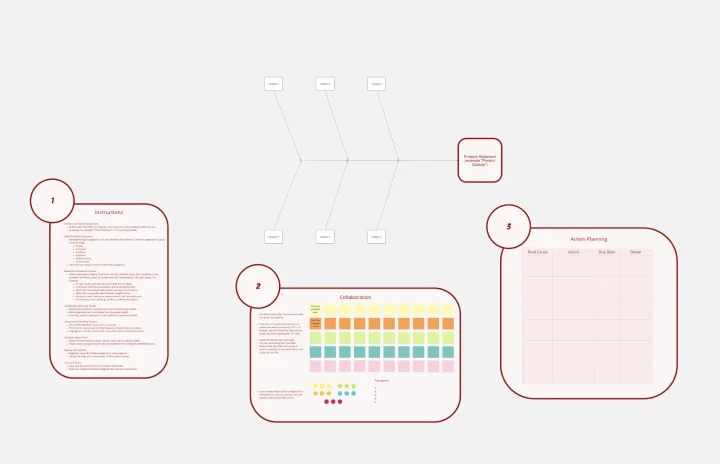
Crowd Sourced Cause and Effect
Works best for:
Fishbone Diagram, Problem solving
The Crowd Sourced Cause and Effect template leverages collective intelligence to identify root causes of problems. By involving multiple team members, you can gather diverse perspectives and uncover insights that might be overlooked. This collaborative approach ensures a comprehensive analysis and fosters team engagement.
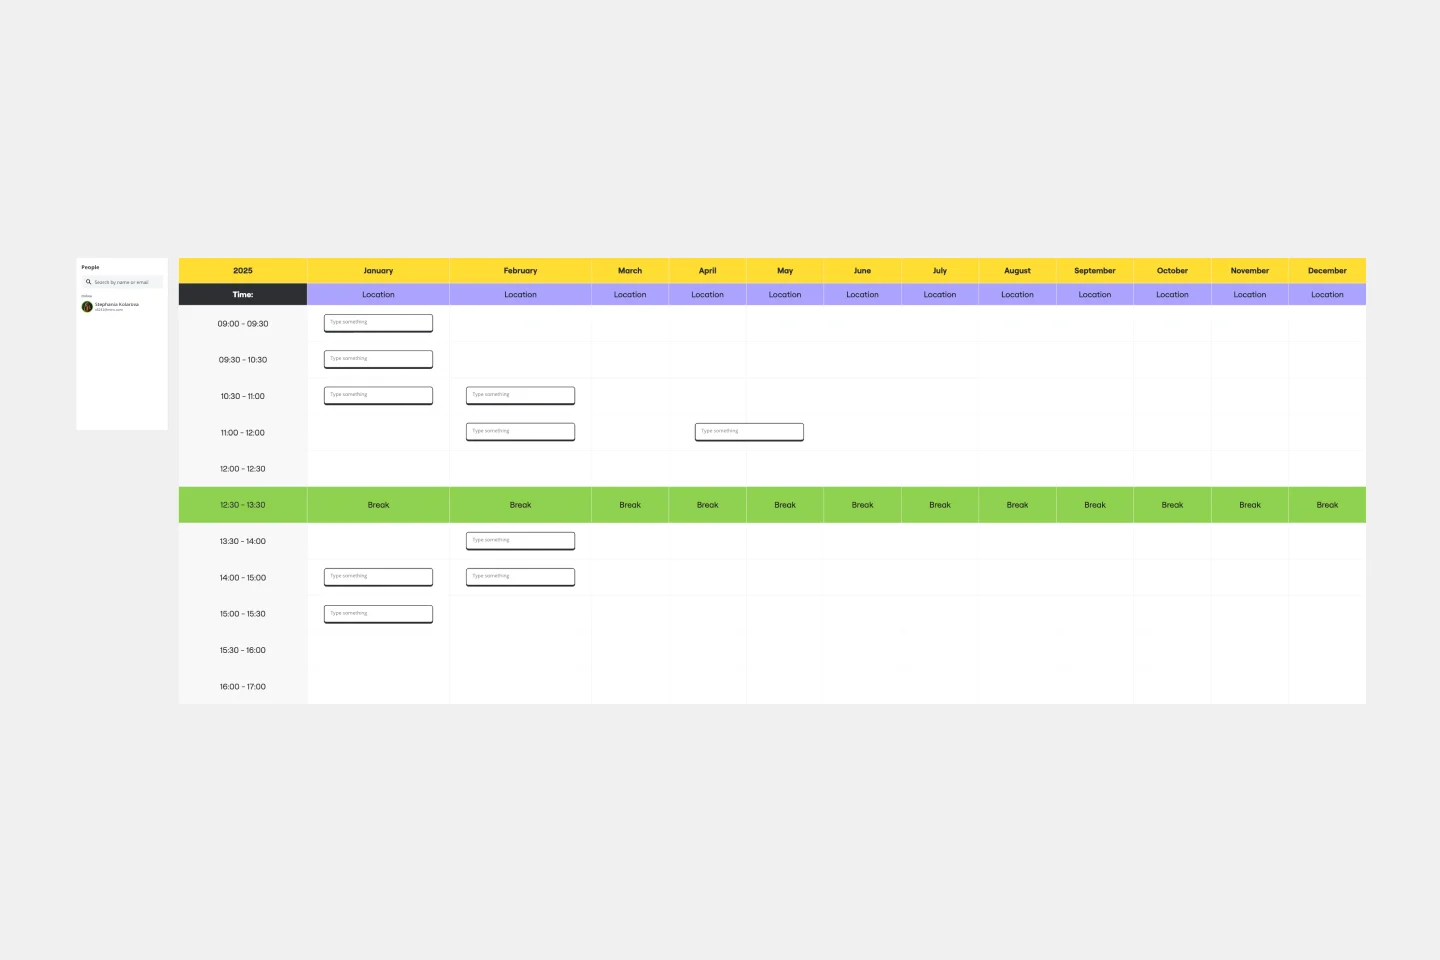
Monthly Schedule Template
Works best for:
Planning, Project Management
The Monthly Schedule Template is a flexible tool for long-term planning. It allows you to organize events, projects, and personal activities. You can easily adjust to accommodate changing priorities, unforeseen events, or long-term goals. This ensures sustained productivity and goal achievement.
Fishbone Diagram for Quality Control
Works best for:
Fishbone diagram
Maintaining high standards of quality is vital in any industry. The Fishbone Diagram for Quality Control template helps you identify and analyze the root causes of quality issues. Use it to categorize potential causes into areas such as materials, methods, manpower, and machinery. This structured approach ensures a thorough examination of all possible factors affecting quality, leading to more effective solutions and continuous improvement.
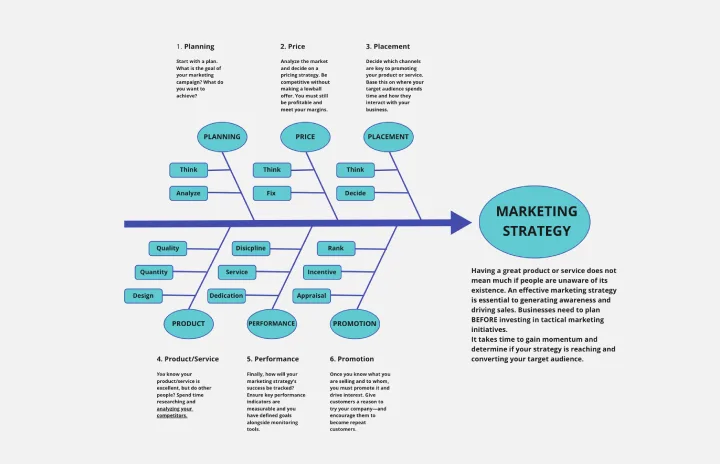
Fishbone Diagram for Marketing
Works best for:
Fishbone diagram
Identifying the root causes of marketing challenges is essential for effective strategy development. The Fishbone Diagram for Marketing template helps you systematically explore factors affecting your marketing efforts. Categorize potential causes into areas such as market research, product positioning, promotional strategies, and distribution channels. This structured analysis enables your team to pinpoint and address issues, optimizing marketing campaigns.
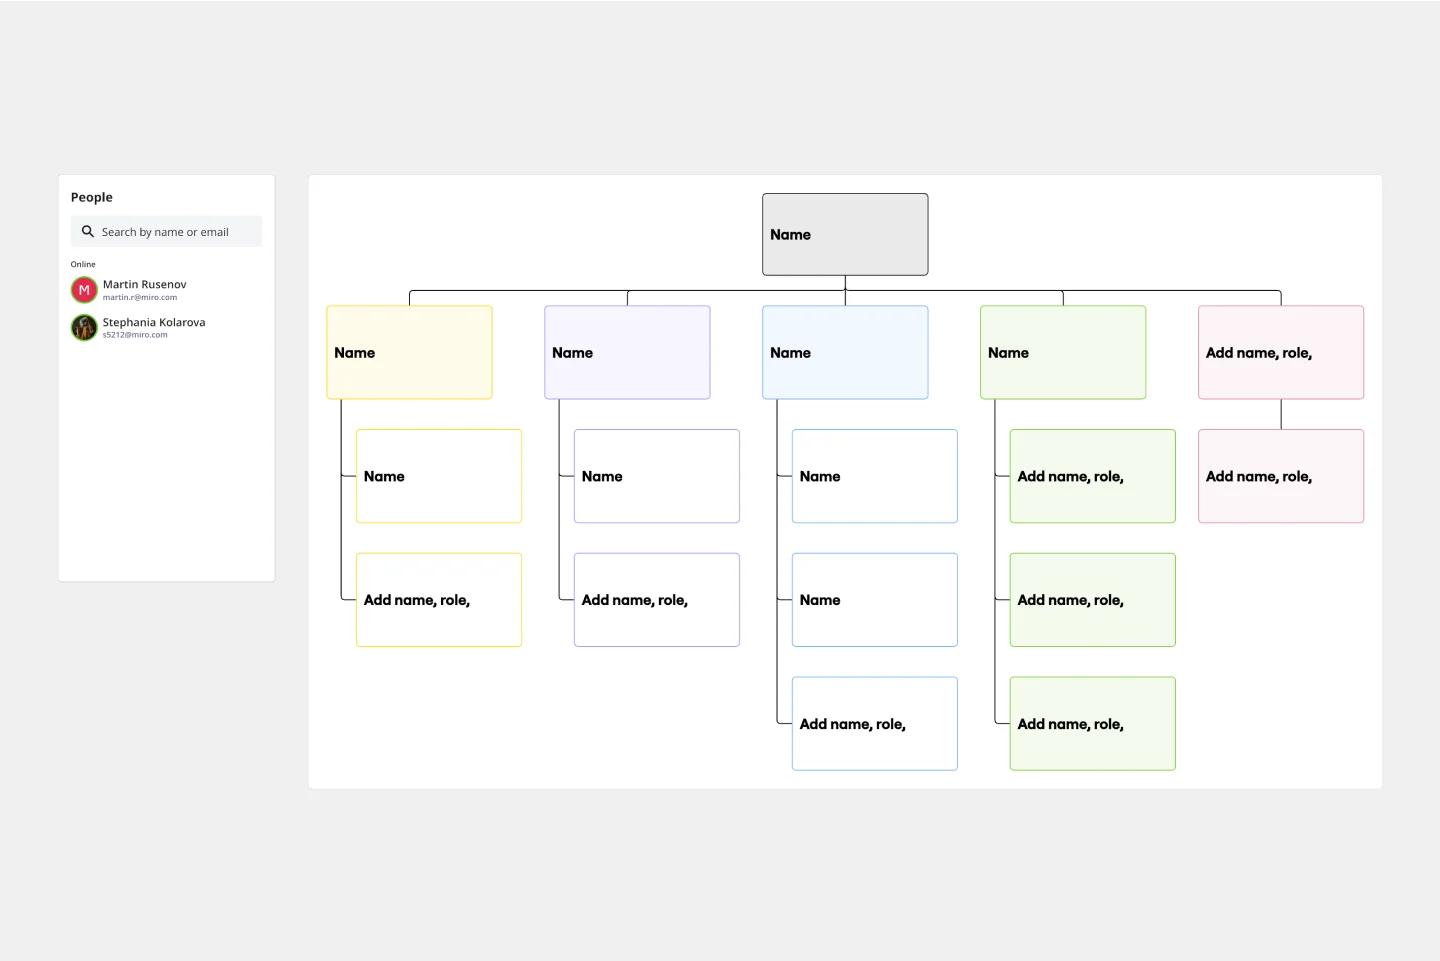
Organizational Chart Template
Works best for:
Org Charts, Operations, Mapping
Who makes up the team? What roles do they play? Who does each member report to? An organizational chart, or org chart, can answer it all at a glance. Ideal for onboarding new employees, these visual diagrams plot out company structure and the chain of command to help your team members understand reporting relationships, their role, and how they fit into the broader organization. Our template lets you choose your own chart structure and easily plot the connections between employees, roles, and departments.