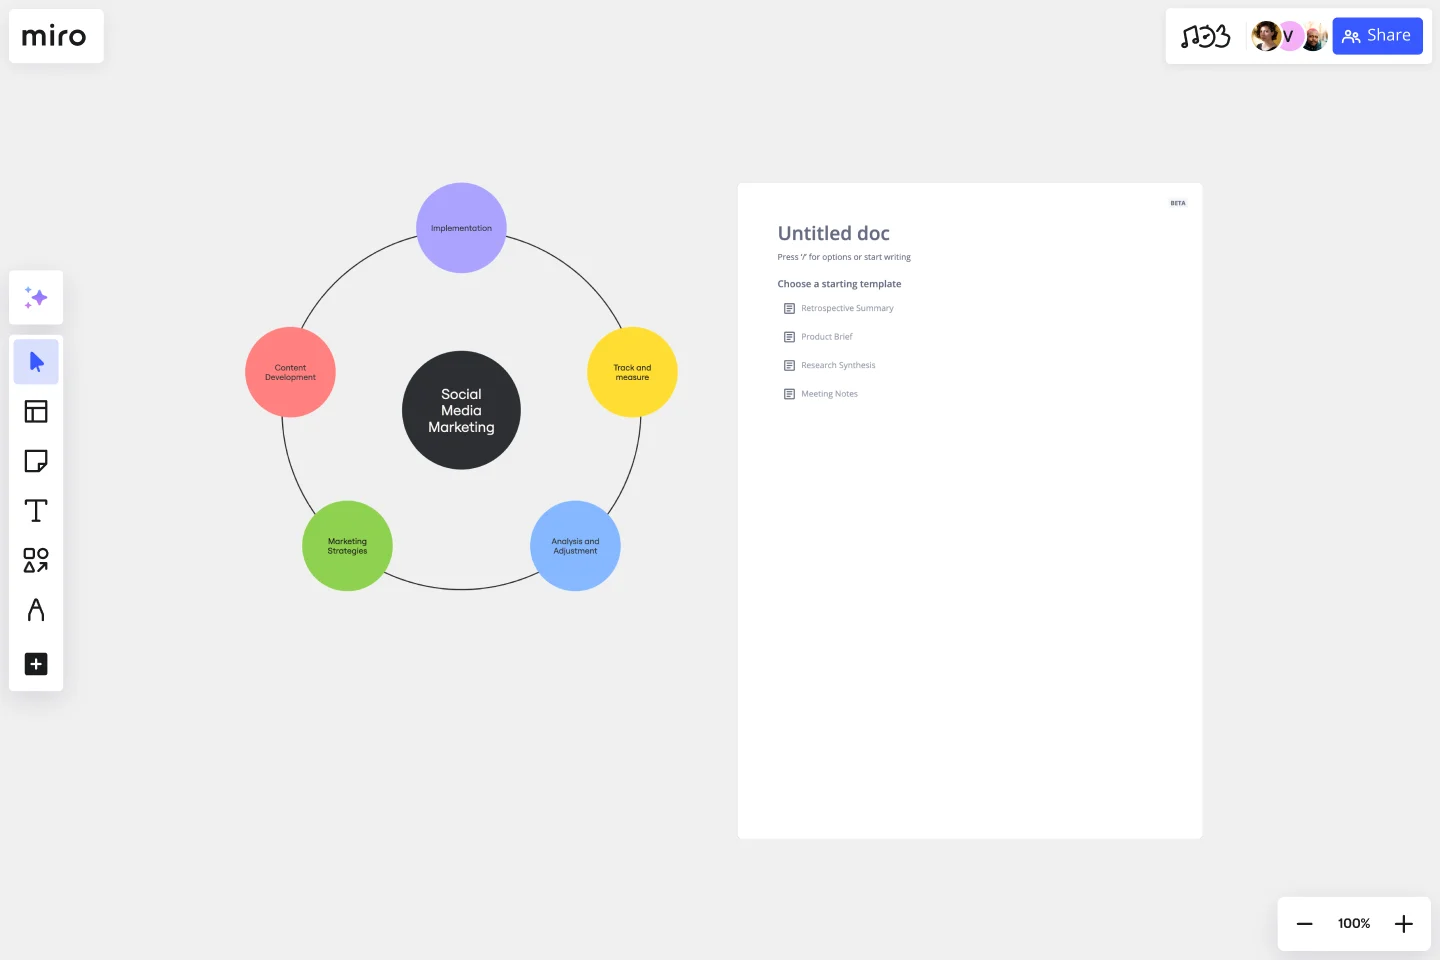
Cycle Diagram Template
Effortlessly represent complex cycles, enhance presentations, and collaborate seamlessly using the cycle diagram template.
About the Cycle Diagram Template
The cycle diagram template helps you streamline visual communication by mapping project cycles, illustrating process flows, or visualizing interconnected concepts. With this template, you can create compelling and insightful diagrams that will help you communicate your ideas more effectively.
Understanding the cycle diagram template
Cycle diagrams are a great way to visually represent processes, relationships, or events in an organized manner. They provide a structure that easily depicts the continuous flow and interdependence of elements within a system. You can simplify complex concepts using cycle diagrams, making it an invaluable asset for anyone seeking clarity in their visual storytelling.
How to use the cycle diagram template in Miro
Customize with ease: Effortlessly edit the template by adding, removing, or rearranging elements with just a few clicks.
Automated diagramming: Leverage Miro's automated diagram maker to expand and enhance your cycle diagram. Connect elements seamlessly, allowing the diagram to evolve dynamically as your ideas take shape.
Contextual artifacts: Elevate your diagram by incorporating additional artifacts from your Miro board. Whether it's notes, images, or data, provide context that enriches the understanding of your audience.
Why should you use a cycle diagram template?
Clarity and understanding: The template promotes clarity, enabling you to communicate complex processes with simplicity.
Efficiency in visualization: Quickly map out cyclical relationships and processes, saving time and effort in creating visually impactful diagrams.
Collaborative advantage: Enhance collaboration by creating a shared visual language that fosters clear communication among team members.
Versatility: The template adapts to various contexts, making it suitable for project management, strategic planning, or educational purposes.
Professional Presentation: Elevate your presentations and reports with professionally crafted cycle diagrams that resonate with your audience.
Can I change the colors and styles of the cycle diagram template?
Achieve your desired look by customizing the template with ease. Adjust colors, fonts, and styles by selecting shapes and editing in the context menu bar.
Can I export the cycle diagram to other formats?
Yes, Miro allows you to export your cycle diagram in various formats, ensuring compatibility with your preferred tools and platforms.
Get started with this template right now.
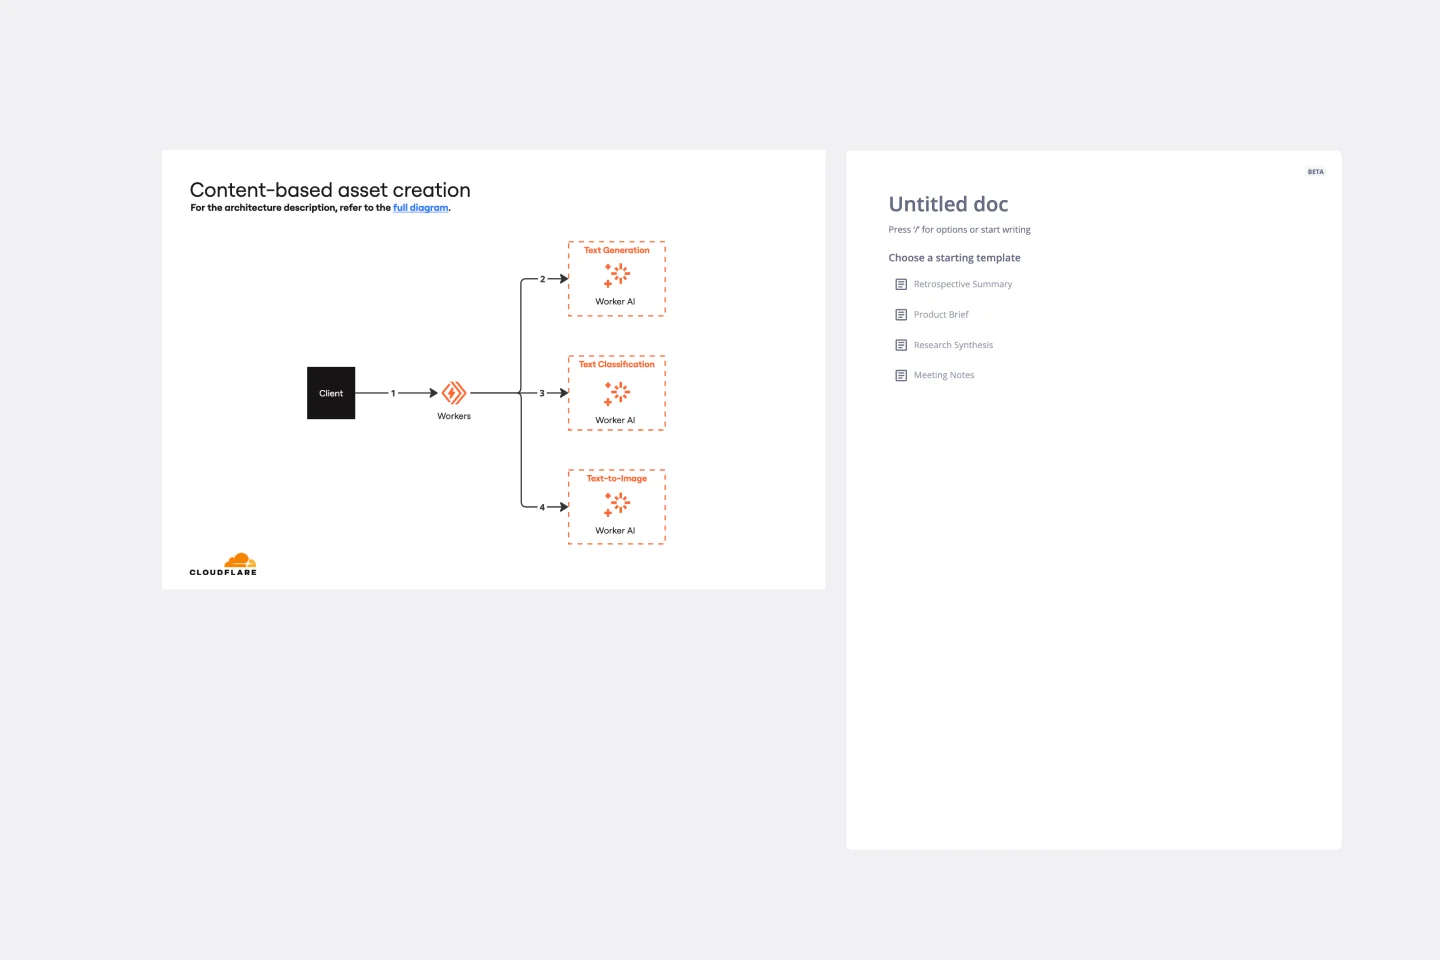
Cloudflare Content-based Asset Creation Template
The Cloudflare Content-based Asset Creation Template enhances efficiency and collaboration within teams working on cloud infrastructure projects. This template provides a structured and intuitive framework for creating and managing digital assets, which streamlines the asset creation process.
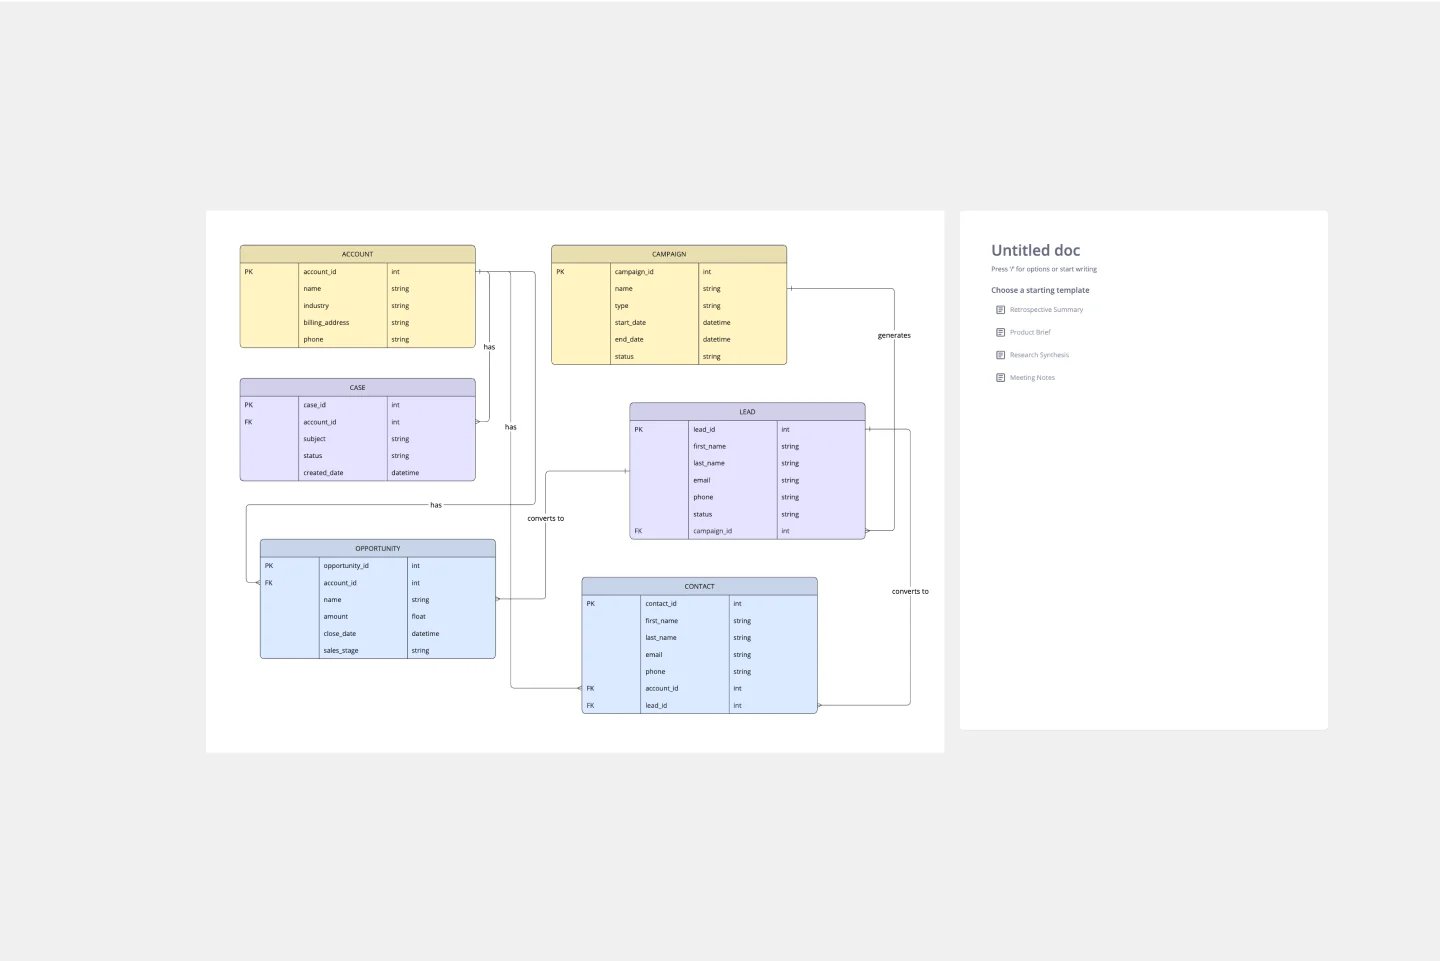
ERD Customer Relationship Management (CRM) Template
Works best for:
ERD, CRM
The ERD Customer Relationship Management (CRM) template streamlines and enhances the management of customer relationships within businesses. It focuses on organizing customer information and interactions in a visually intuitive manner. Key entities such as Customer, Interaction, Sales Opportunity, Product, and Support Ticket are central to the template, facilitating the tracking of customer relationships, sales funnel activities, product purchases, and customer service interactions. This structured approach is critical for boosting customer satisfaction and optimizing sales strategies, making the ERD CRM template an invaluable asset for businesses aiming to improve their CRM processes.
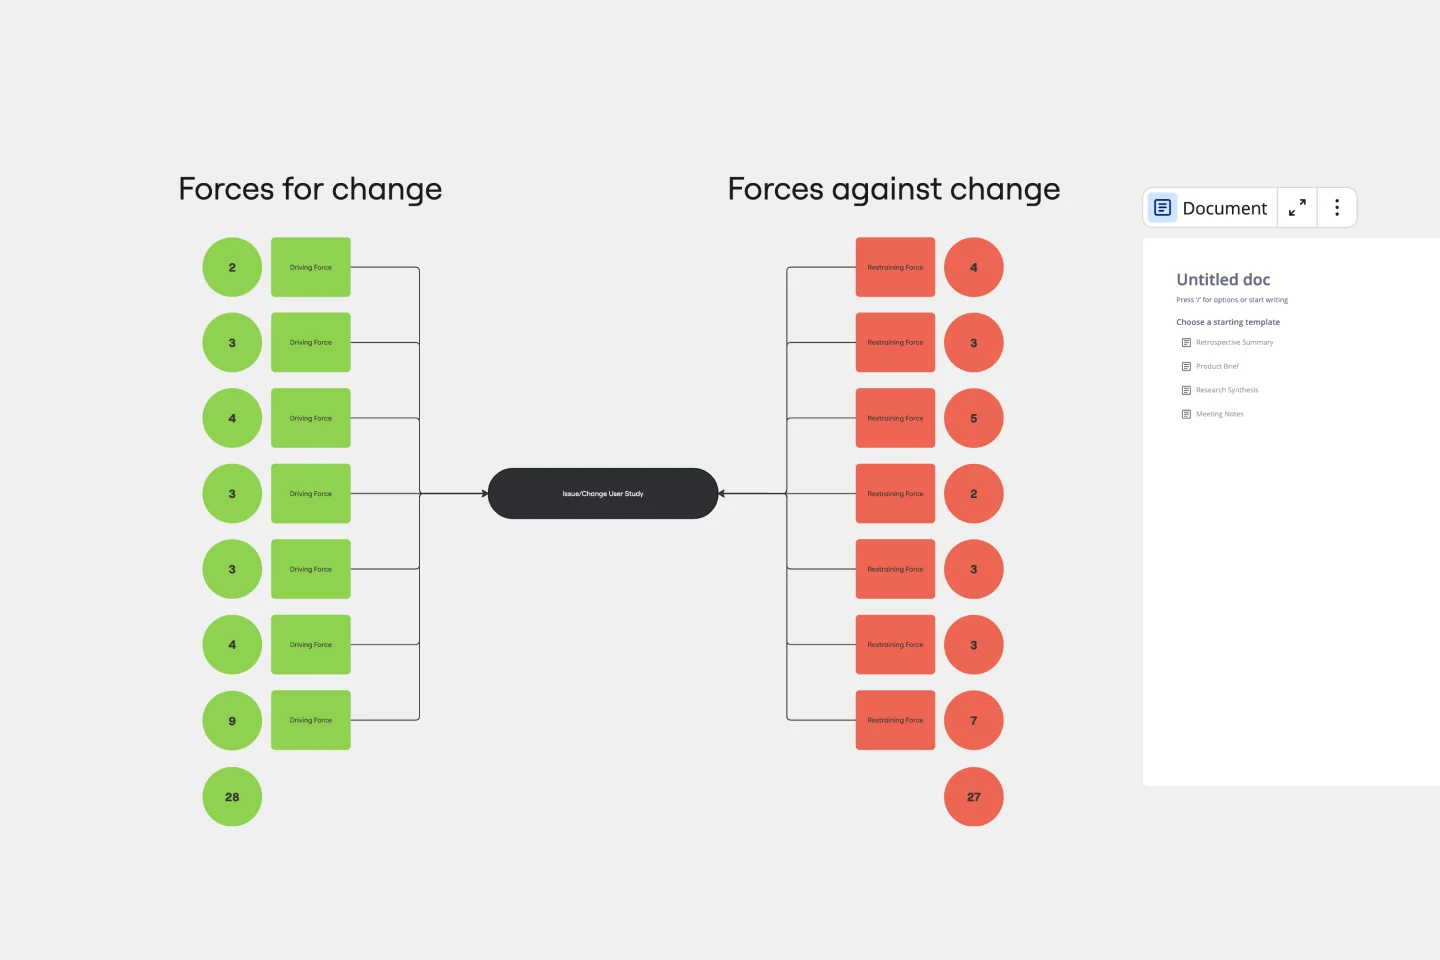
Force Field Analysis Template
Works best for:
Diagramming, Strategic Planning
A Force Field Analysis Template is a powerful tool that helps teams identify and analyze the forces supporting or hindering progress toward a specific change or goal. This template provides a visual space where you can brainstorm and plot out 'driving forces' that push objectives forward and 'restraining forces' that prevent advancement, all on a single, intuitive board. One of the primary benefits of utilizing the Force Field Analysis template is that it fosters a shared understanding among team members. By visually mapping out and discussing each force, teams can prioritize efforts, build consensus on the central issues to tackle, and collaboratively devise strategic plans to strengthen positive influences while reducing negative ones.
Ecomap Template
Works best for:
Strategy & Planning, Diagramming
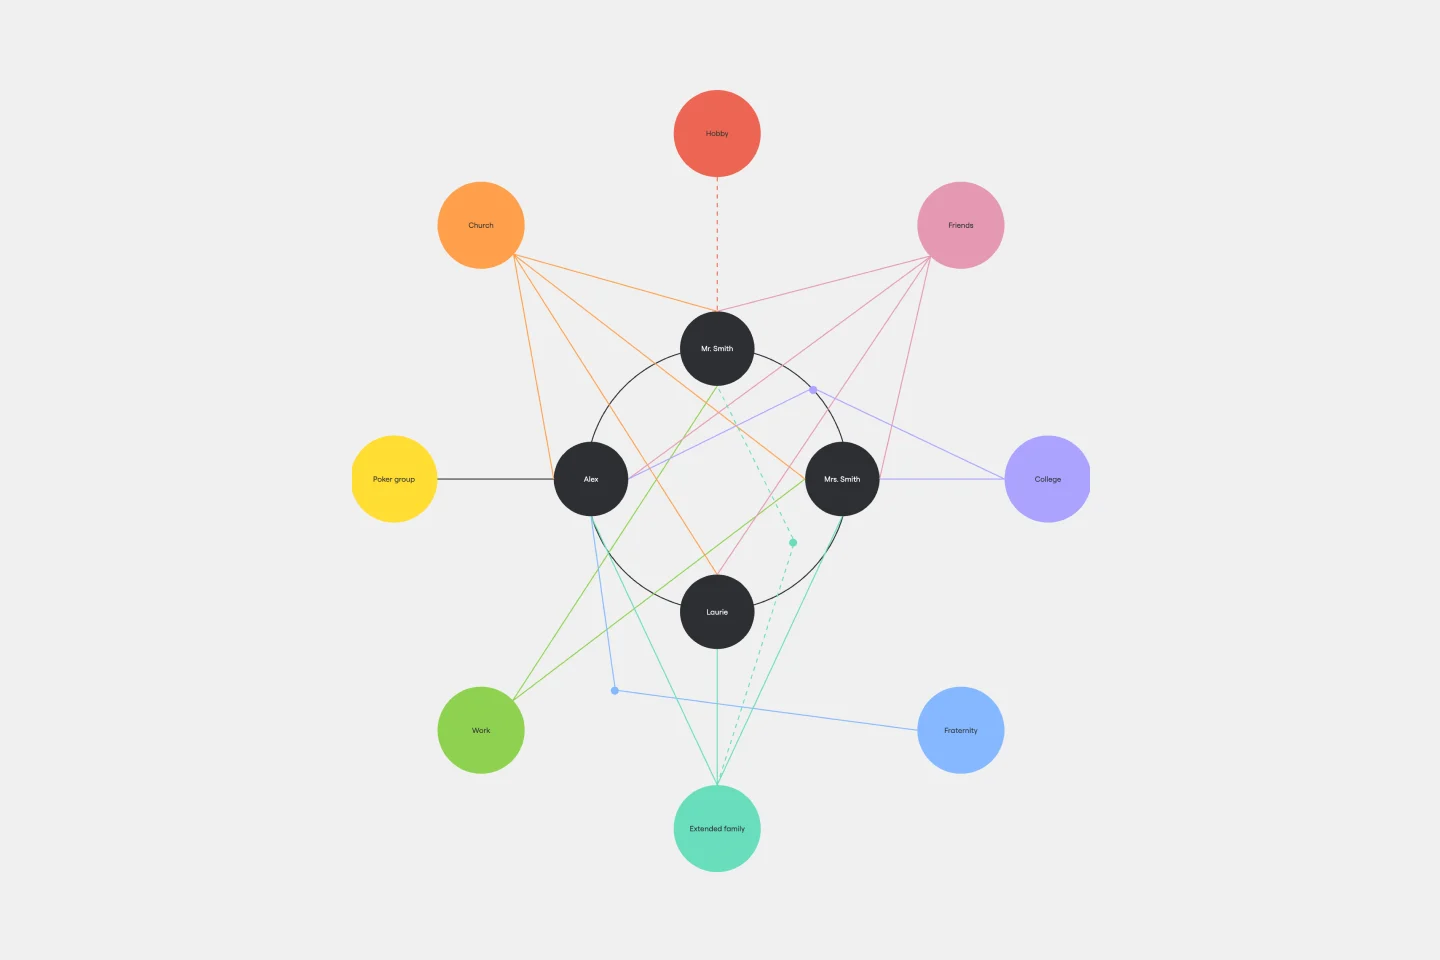
The Ecomap Template illustrates the multifaceted relationships and environmental interactions encircling an individual or entity. Determine crucial patterns and dynamics by providing a clear and comprehensive visualization of how different systems intertwine and influence each other.
CI/CD Pipeline Diagram Template
Works best for:
Diagramming, Development
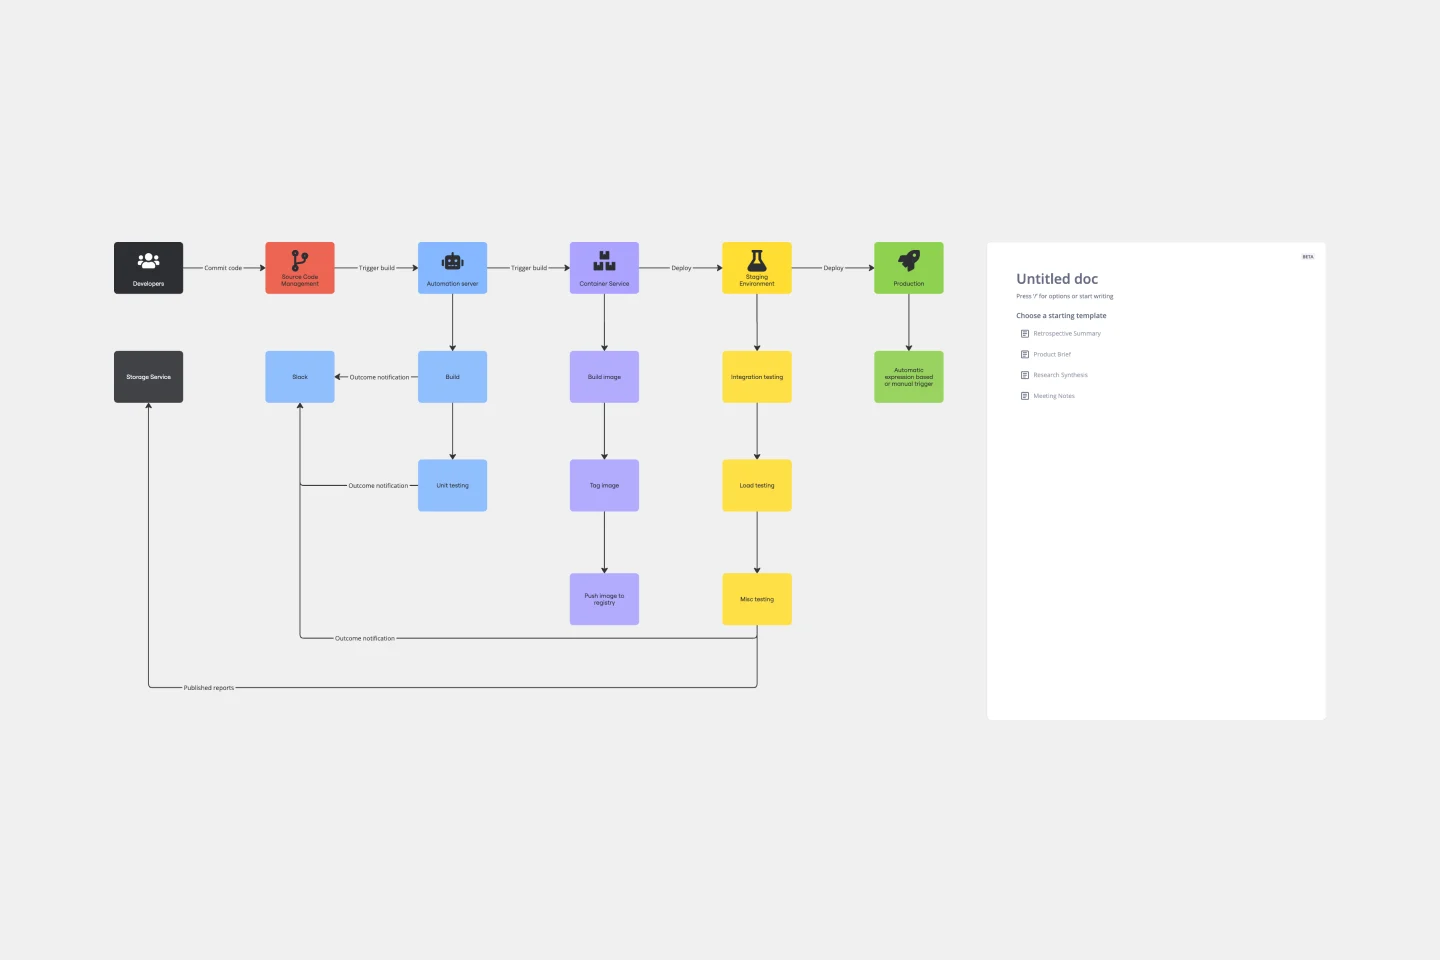
The CI/CD template is a well-designed roadmap for software deployment that enables a smooth and automated flow from development to production. This strategic layout includes critical elements such as source code management, automation servers, container orchestration, staging environments, and the final deployment to production. One of the key benefits of using such a template is that it builds a robust deployment pipeline, which significantly reduces manual intervention and human error. By visualizing each step and integrating automation throughout, teams can achieve faster deployment cycles, ensuring that new features, updates, and fixes are delivered to users promptly and reliably. This enhanced pace does not compromise quality, as the template inherently supports continuous testing and quality assurance, ensuring that each update is quick but also secure and stable before it is delivered to the end user.
4-Circle Venn Diagram Template
Works best for:
Diagramming, Mapping, Brainstorming
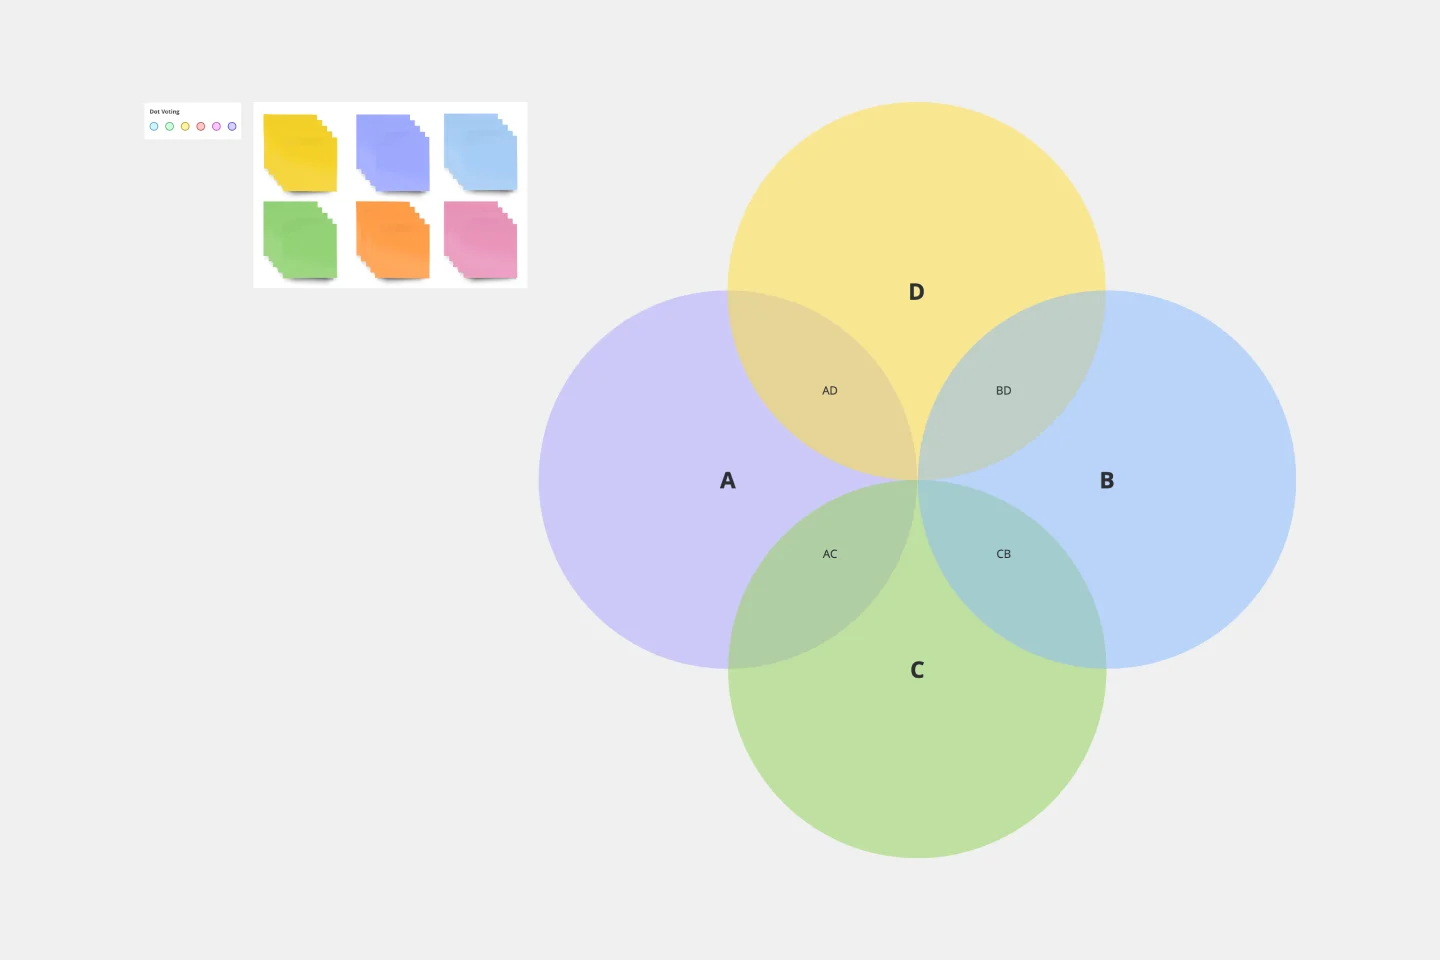
The 4-Circle Venn Diagram Template has an easy, interactive, and dynamic way to visualize complex relationships between data sets. Empower your team's collaboration and communication with this powerful tool.