Current State vs. Future State Flowchart Template
Strategically allocate tasks, visualize process changes, and identify bottlenecks with the current state vs. future state flowchart template.
About the Current State vs. Future State Flowchart Template
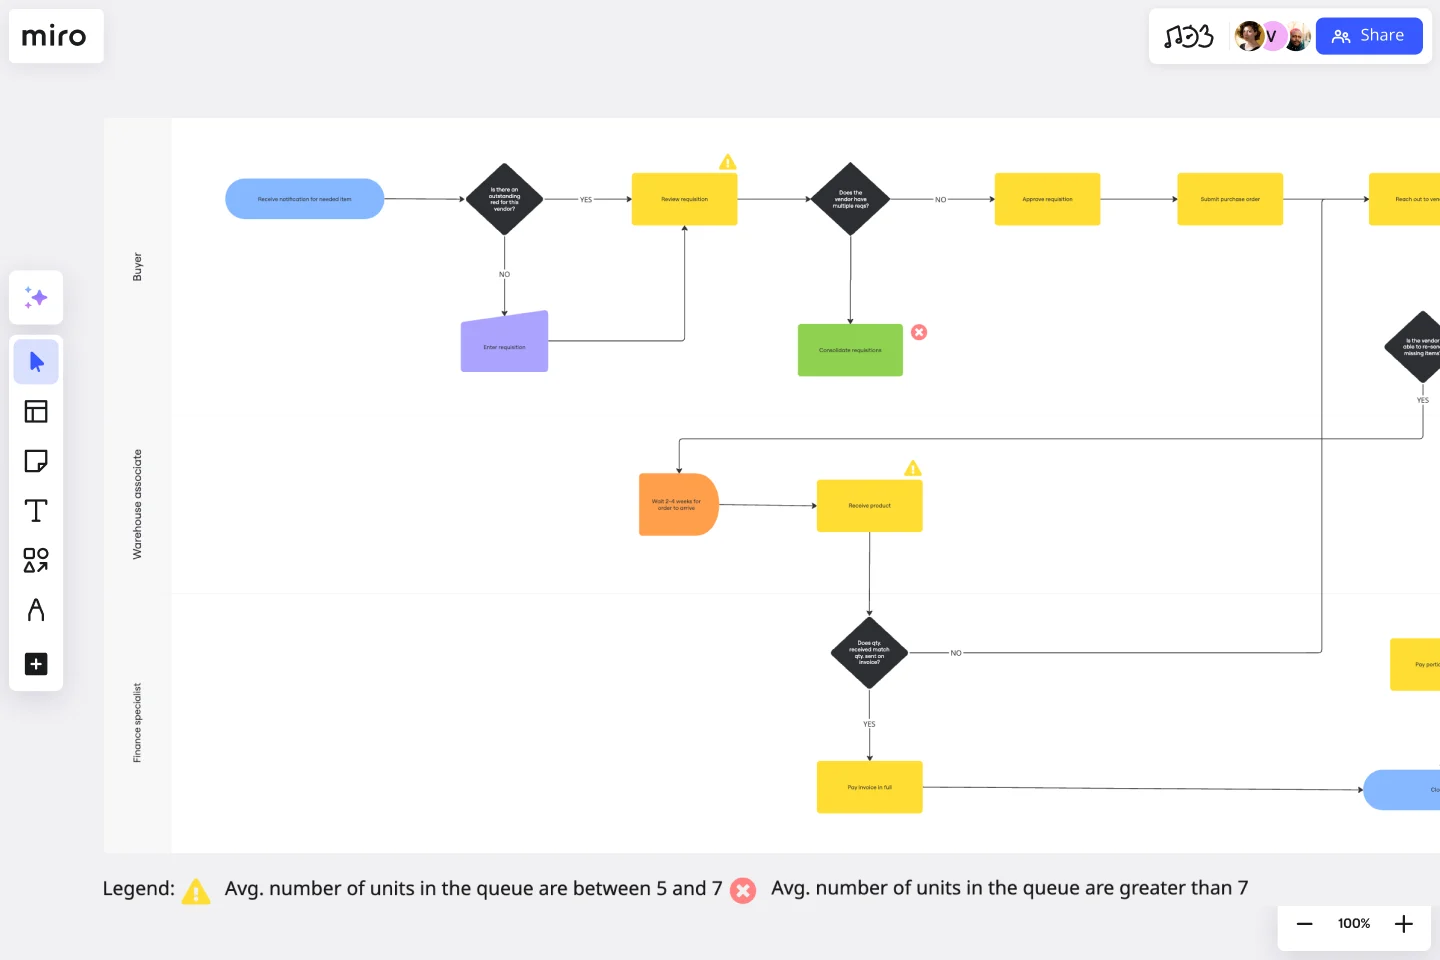
The Current State vs Future State Flowchart Template is essential for teams facing complex processes. This powerful asset provides clarity and structure to workflows, employing swimlanes to clarify departmental responsibilities and layers to offer a nuanced view of process changes. With its strategic guidance, teams can identify and address bottlenecks with precision, empowering them to navigate their transformational journey with confidence and ease. Don't let complex processes slow you down - use the Current State vs Future State Flowchart Template to take control.
Understanding the template
The Current State vs Future State Flowchart Template is designed to allocate tasks to respective departments using swimlanes, which helps to define roles and responsibilities clearly. The template also has layers that allow for dynamic representation of changes between the current and future states. This tool goes beyond just visualizing the process, as it can help teams identify bottlenecks and improve efficiency by streamlining workflows.
How to use the current state vs. future state flowchart template in Miro
Optimize task allocation with swimlanes: Use swimlanes to assign tasks to specific departments, fostering transparency in responsibilities and facilitating streamlined communication.
Enhance visualization with layers: Leverage layers to dynamically represent changes between current and future processes, offering a detailed and adaptable perspective on the transformation journey.
Proactively address bottlenecks: Analyze the flowchart to identify bottlenecks, providing teams with actionable insights to address challenges and optimize workflow efficiency proactively.
Why should you use a current state vs. future state flowchart template?
Precision with swimlanes: Clearly understand and communicate which department is responsible for each task, ensuring accountability and clarity within the team.
Nuanced process visualization: Employ layers to visualize complex changes between current and future processes, offering a comprehensive and adaptable representation of the transformational journey.
Identify bottlenecks: The template serves as a strategic tool, enabling teams to address challenges and optimize workflow efficiency strategically.
Transparent communication: Use swimlanes to precisely define responsibilities, promoting transparent communication and alignment on tasks and objectives.
Efficiency optimization: Pinpointing bottlenecks empowers teams to optimize workflows, enhancing overall efficiency and effectiveness.
If you'd prefer to start from scratch, flowcharting with Miro is easy! You can choose from a wide range of flowchart shapes in Miro's extensive library, so you'll find just what you need.
Can I export the flowchart for external use or presentations?
Miro provides export options, allowing you to save your flowchart as an image or PDF for external sharing or adding to presentations.
Are there any pre-built templates for specific industries or processes?
While the Current State vs Future State Flowchart Template provides a versatile framework, Miro also offers industry-specific templates that can be customized to meet your unique needs.
Get started with this template right now.
BPMN Template
Works best for:
Mapping, Diagrams, Business Management
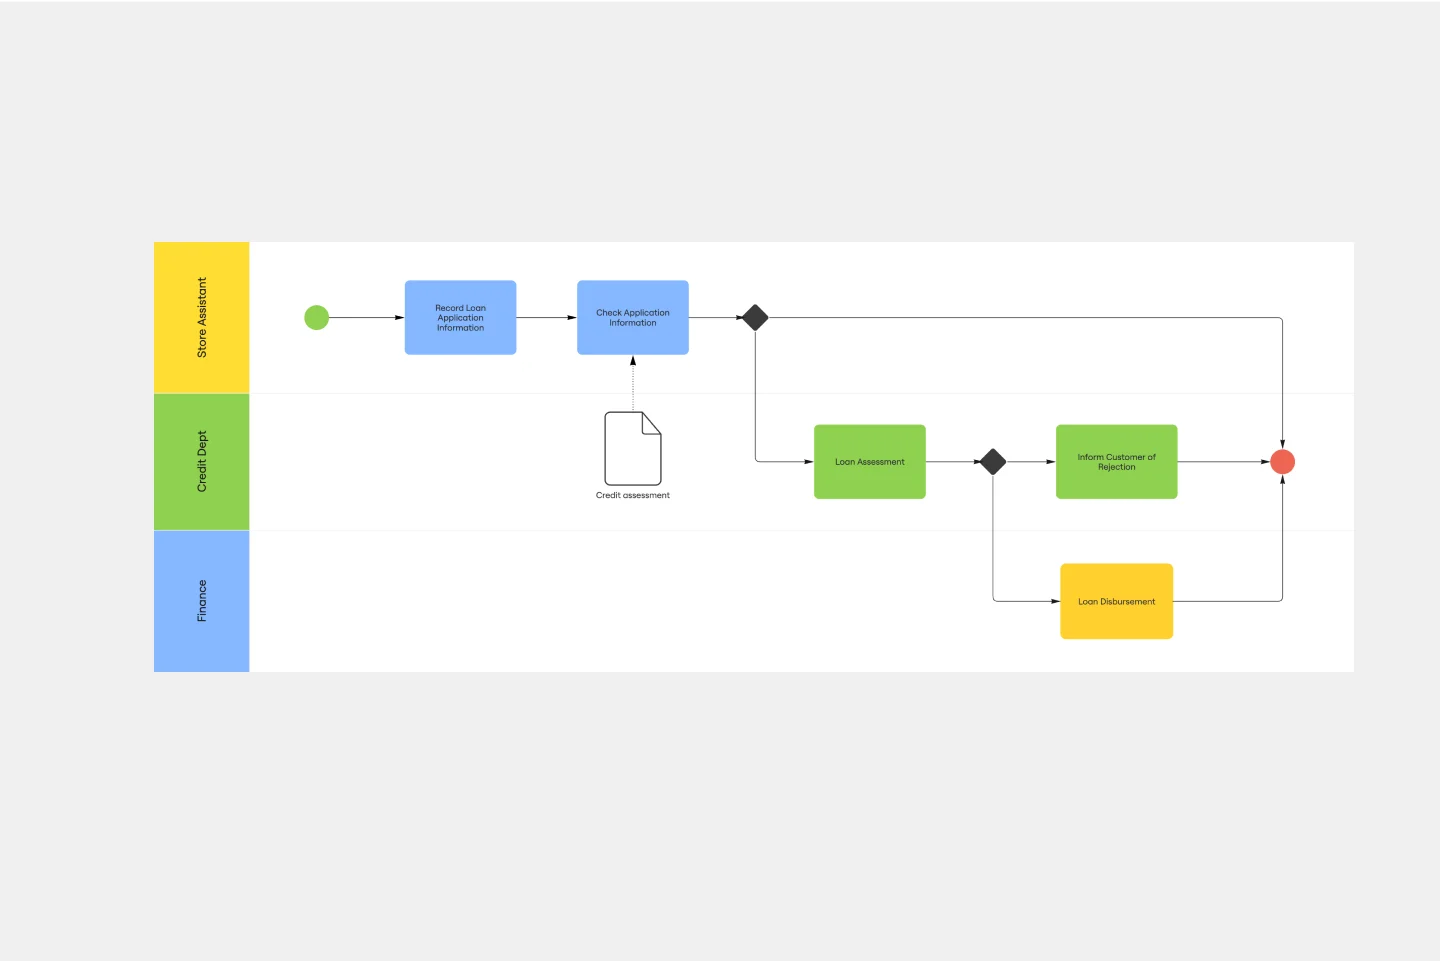
The BPMN template helps you track and get an overview of your business processes. It’s a great way to identify any bottlenecks and make your operations more efficient. The BPMN methodology became a universal language when managing business processes, and multiple industries use it as a management tool. Project managers, business analysts, and IT administrators use the BPMN process flow diagram to manage projects, visually communicate the process flows, and keep track of process constraints. Try it for yourself and see improvements in your organization’s agility.
Critical Path Method Template
Works best for:
Diagramming, Project Management
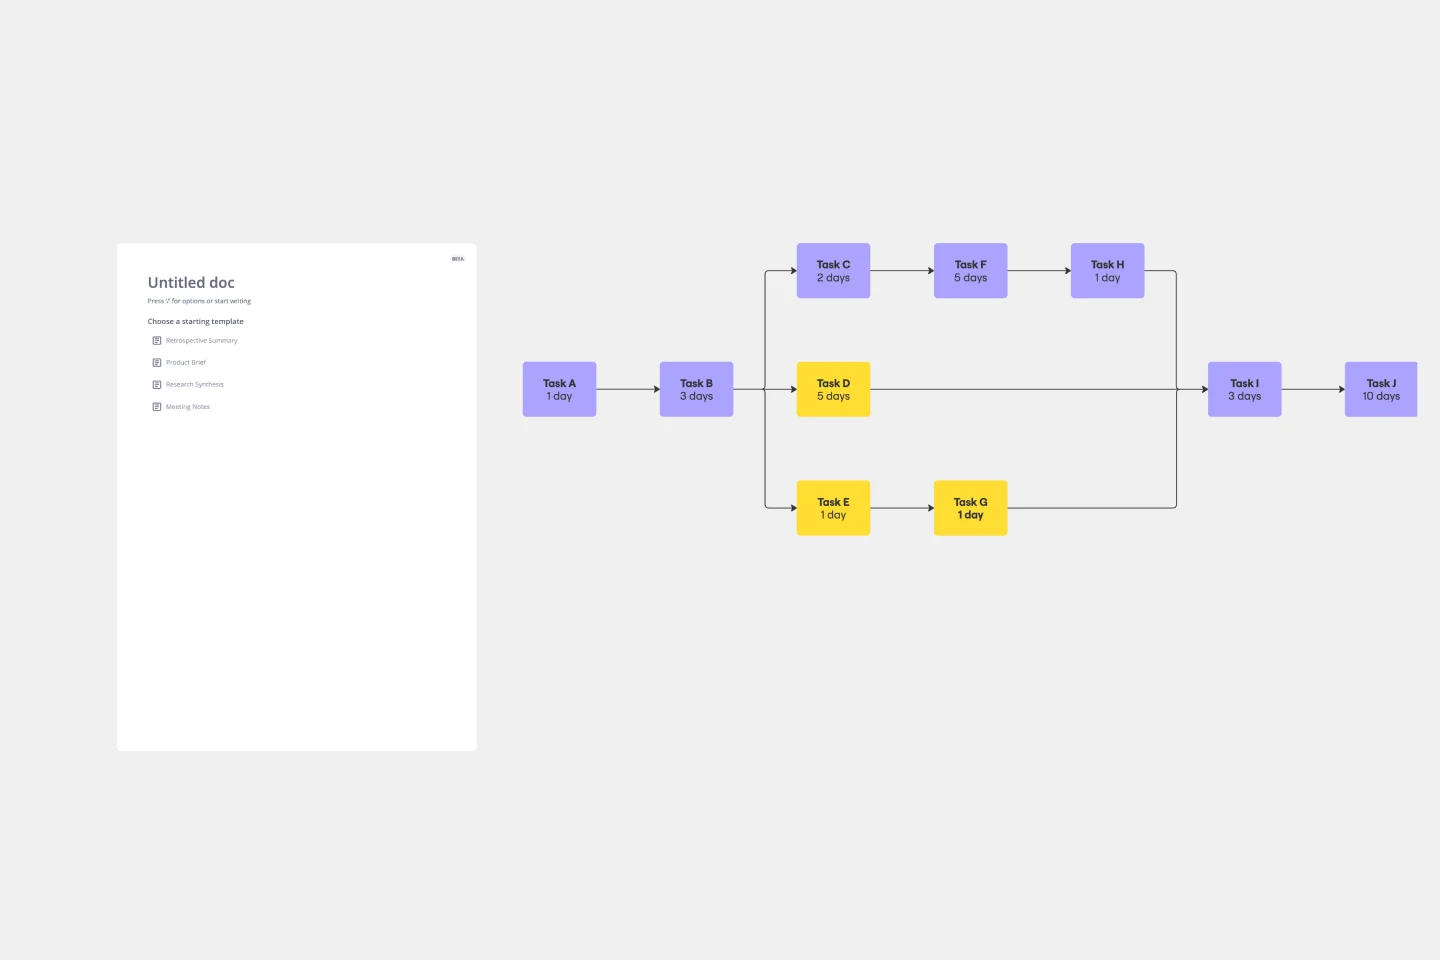
Elevate your project management game with the Critical Path Method Template—an indispensable tool that brings clarity and precision to your project timelines. The template instantaneously adjusts as you edit tasks and dependencies, ensuring that your critical path is consistently up-to-date. This capability not only simplifies the complex process of project scheduling but also empowers your team to proactively respond to evolving project dynamics, fostering adaptability and efficiency throughout the project lifecycle.
UML Communication Diagram Template
Works best for:
Software Development, Mapping, Diagrams
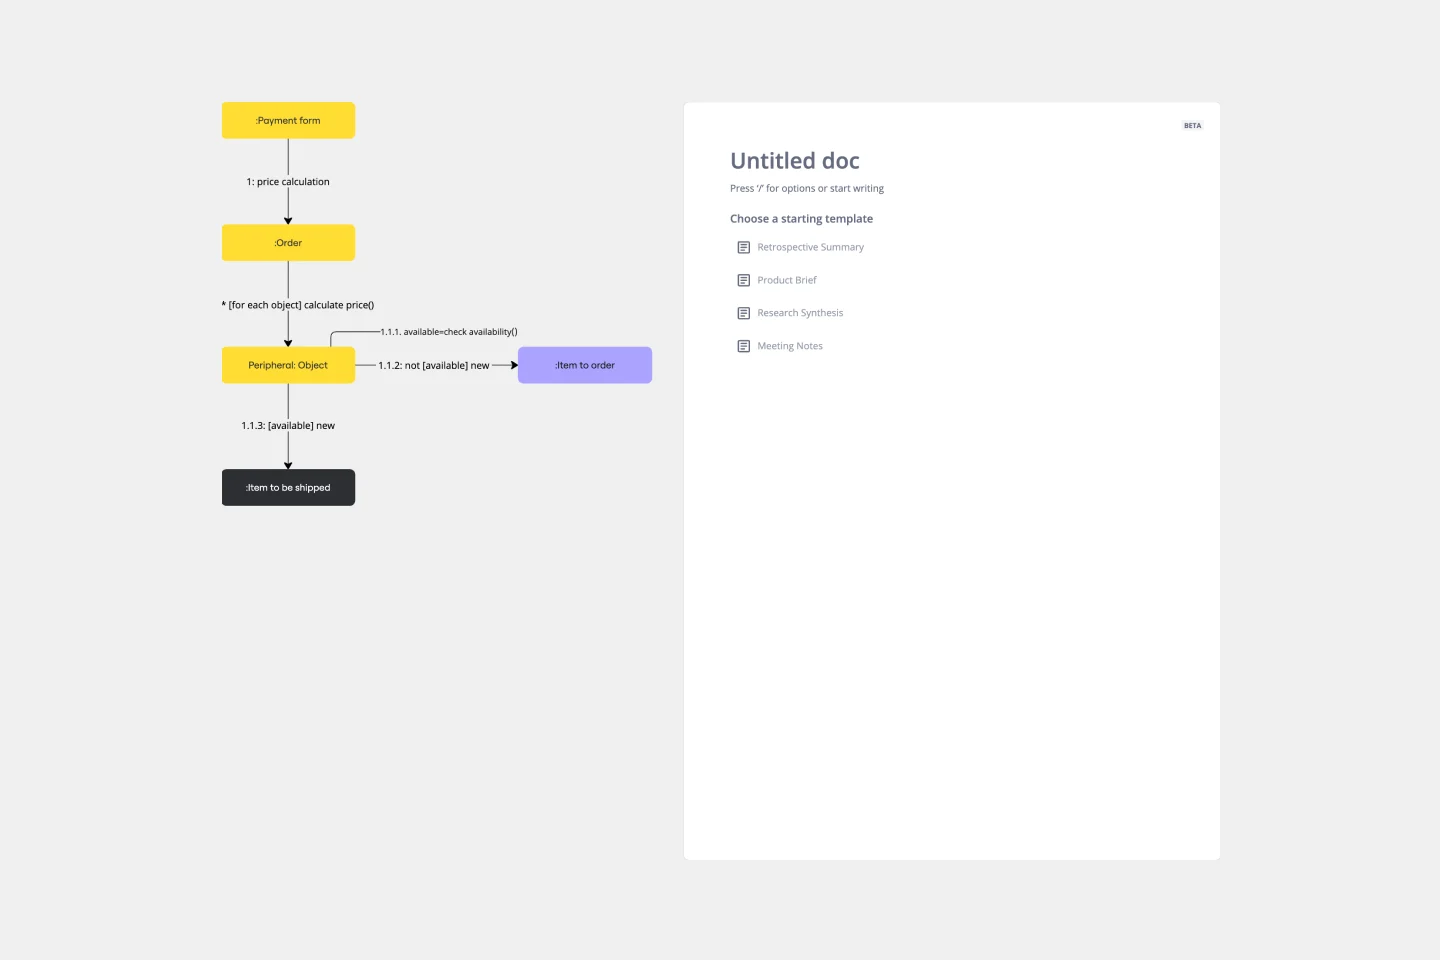
Most modern programs consist of many moving parts working to a precise set of instructions. With a communication diagram, you can visualize exactly how those parts work together, giving you a clearer understanding of your program as a whole. What’s more, the diagram leaves spaces for expanding the network of relationships as your product grows and evolves. A communication diagram is a vital tool in any software designer’s arsenal.
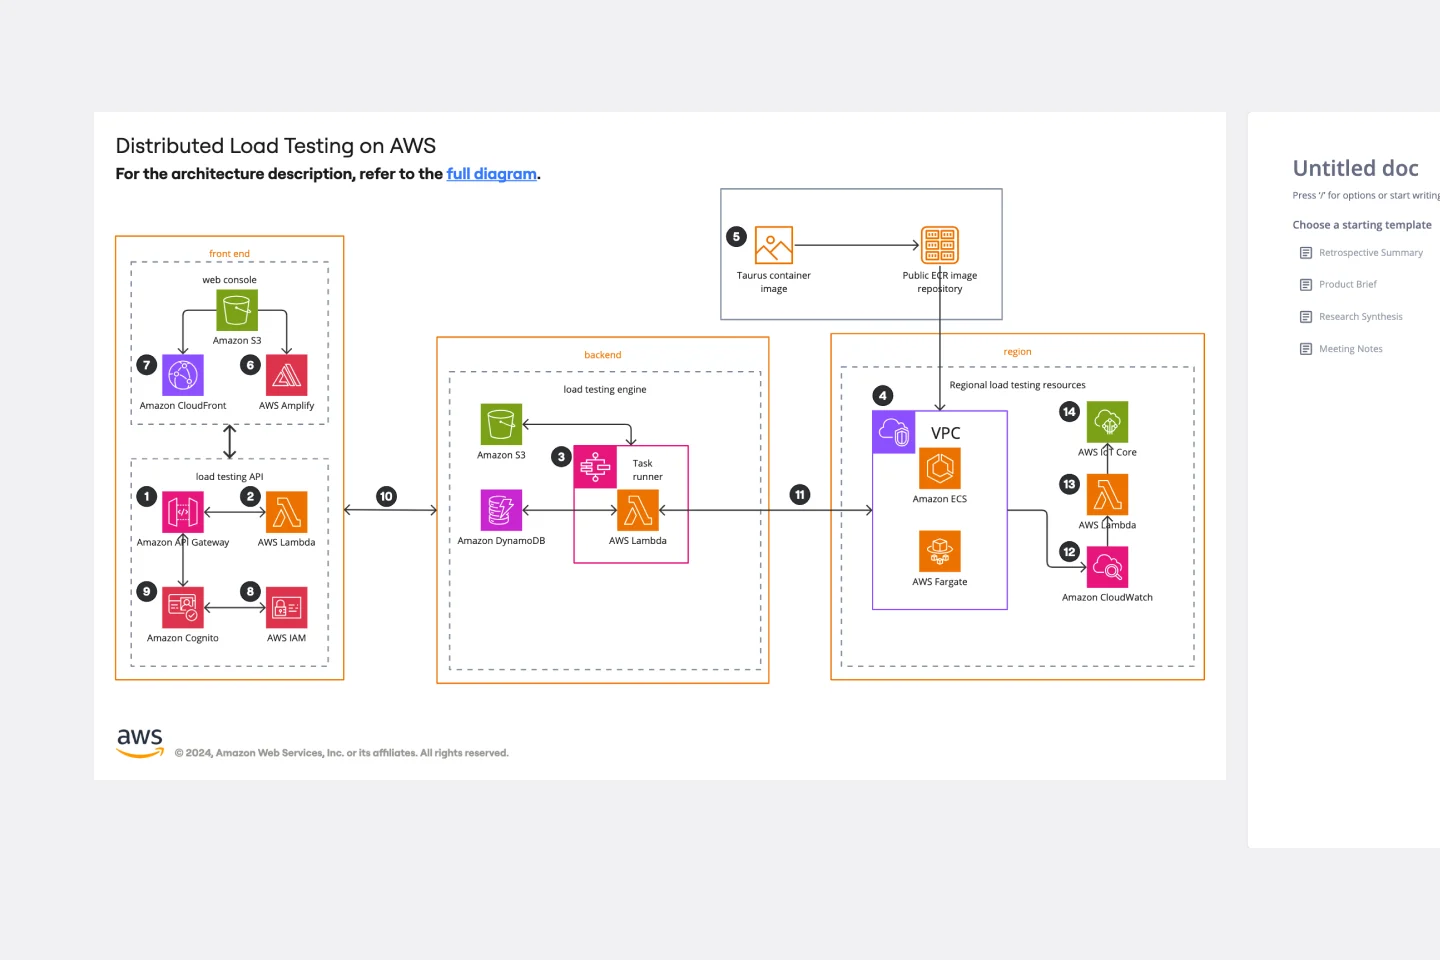
AWS Architecture Diagram Template
Works best for:
Software Development, Diagrams
The AWS Architecture Diagram is a visual representation of the AWS framework, and it also translates the best practices when using Amazon Web Services architecture. You can now have an overview of your AWS architecture with Miro’s AWS Architecture Diagram Template, track your cloud solutions easily, and optimize processes like never before.
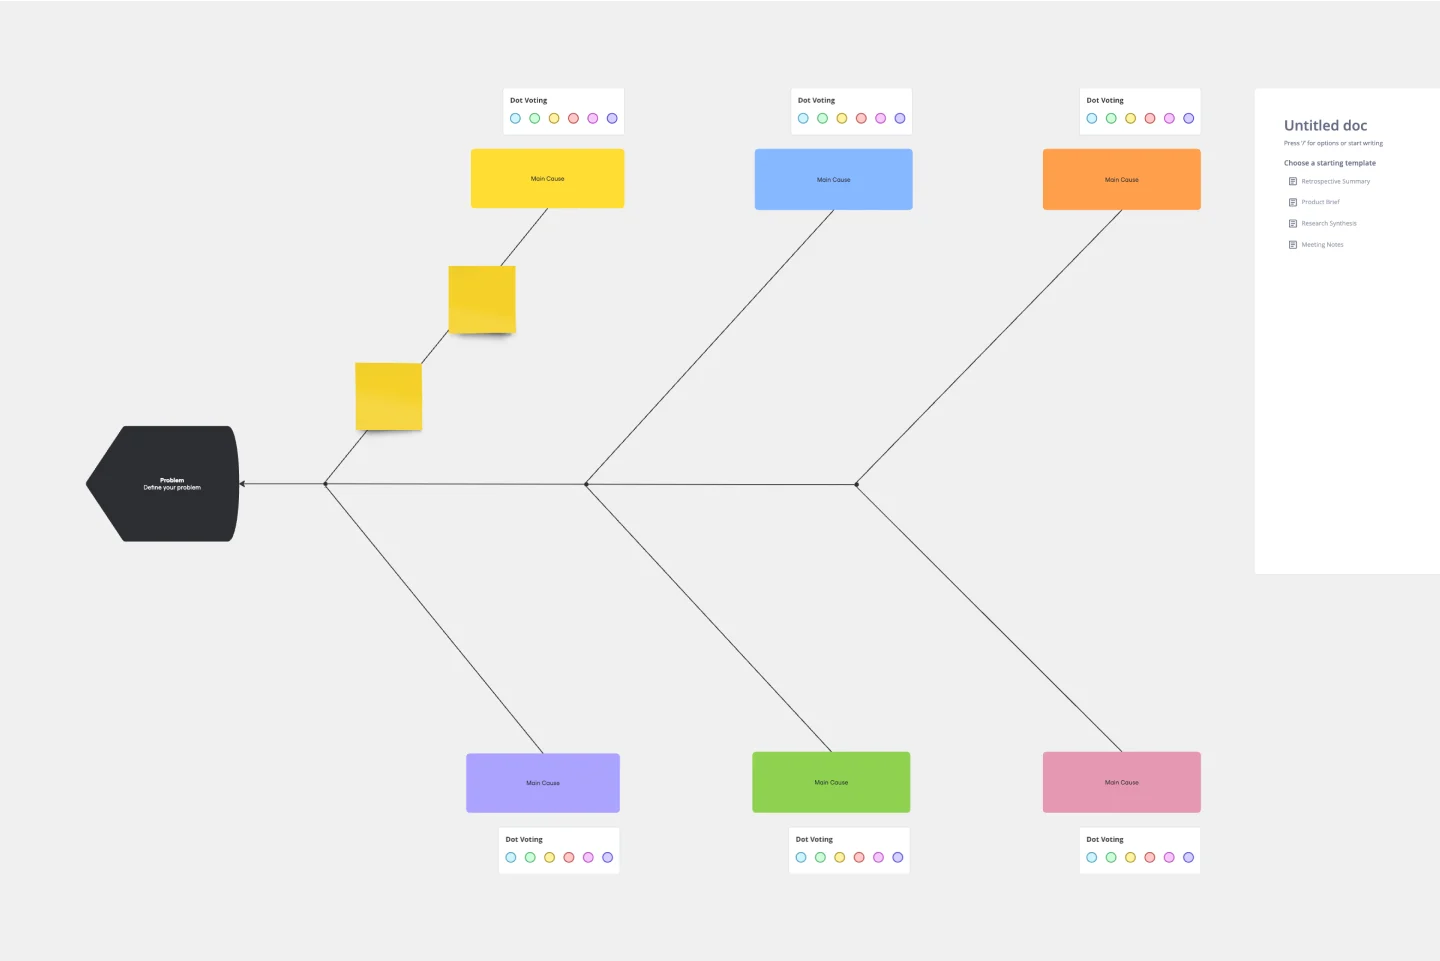
Fishbone Diagram Template
Works best for:
Operations, Diagrams, Workflows
What is the best way to solve any problem your team faces? Go straight to the root. That means identifying the root causes of the problem, and fishbone diagrams are designed to help you do it best. Also known as the Ishikawa Diagram (named after Japanese quality control expert Kaoru Ishikawa), fishbone diagrams allow teams to visualize all possible causes of a problem, to explore and understand how they fit together holistically. Teams can also use fishbone diagrams as a starting point for thinking about what the root cause of a future problem might be.

BPM
Works best for:
Diagramming
The BPM (Business Process Management) template is a visual tool for modeling, analyzing, and optimizing business processes. It provides a structured framework for documenting process flows, identifying bottlenecks, and improving efficiency. This template enables organizations to streamline operations, enhance productivity, and drive business performance. By promoting process transparency and agility, the BPM template empowers teams to achieve operational excellence and deliver value to stakeholders.