Crowd Sourced Cause and Effect
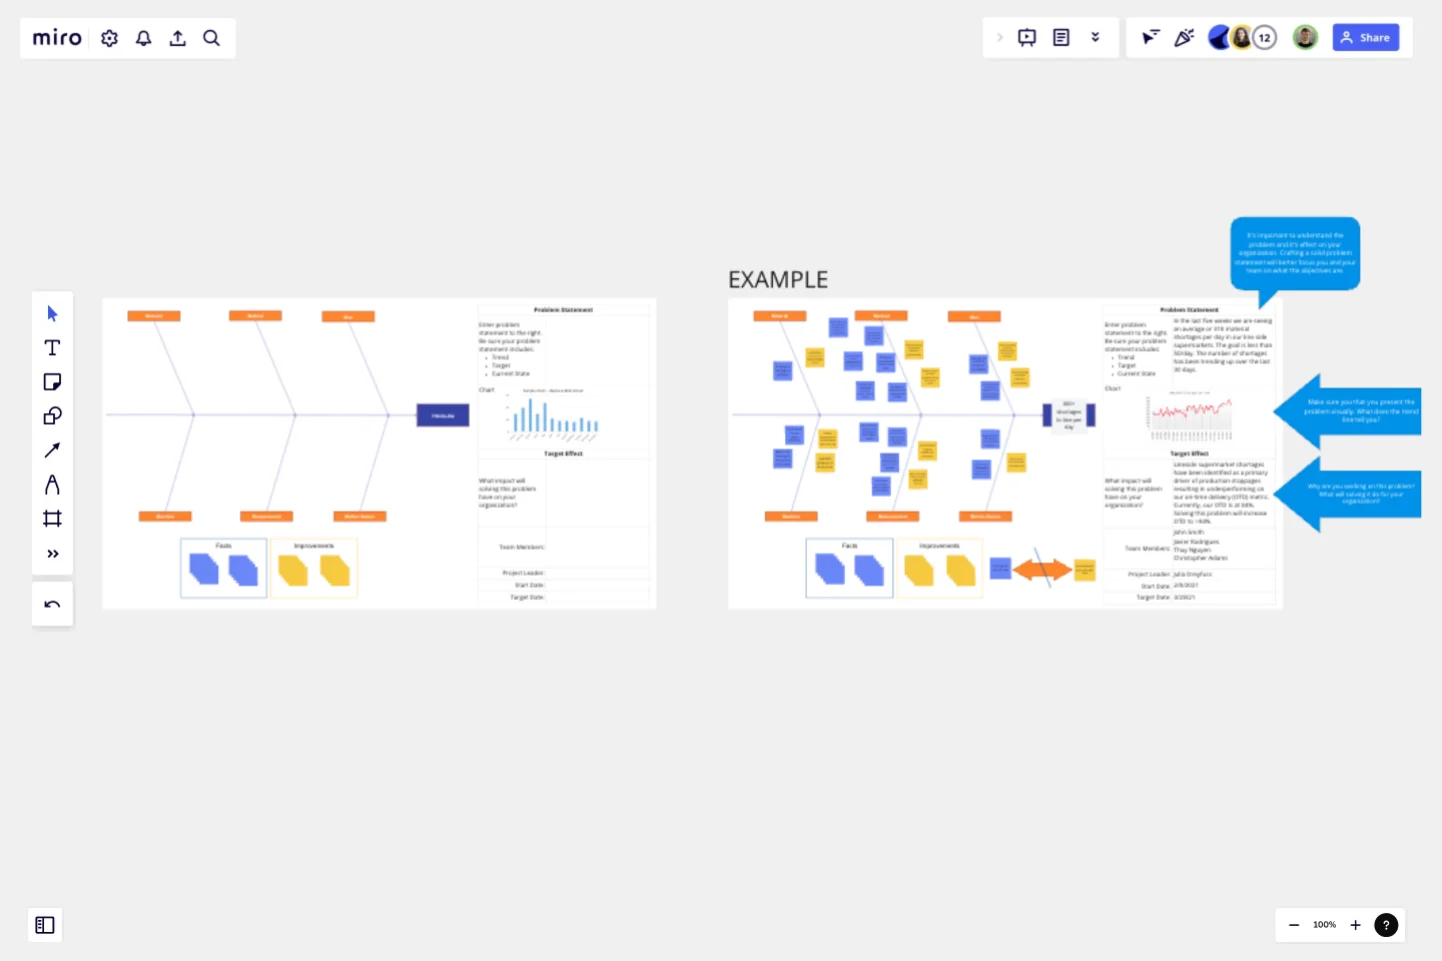
CEDAC stands for Cause and Effect Diagram with the Addition of Cards.
To many, CEDAC is a fishbone diagram with ribs that contain issues on one side of the rib and solutions on the other. But really, it was intended to be more than that. It’s inventor, Fukuda won a Deming Prize for its development. To him, CEDAC was a management technique. So, unlike many other techniques used by practitioners of lean that assume the answer/solution can be created from what is already available, Fukuda’s CEDAC can spawn experiments and research to gain better understanding.
The CEDAC tool is highly diverse and can be used to visualize and problem solve across a wide variety of issues. You can use it to understand issues with new product development, to discern why certain software features are not working as intended, to define possible failure modes in product design, or to comprehend why your accounts receivable backlog is growing (just to name a few). Perhaps the most interesting applications come in defining obstacles where the problem is “created” and the solution is not readily apparent. Created problems don’t necessarily look back historically at what happened to get us here but define a future state not yet achieved. Utilizing CEDAC it’s possible to visualize obstacles that must be overcome before reaching our defined target. These targets could be driven by a desire to increase market share, launch a new business, increase our customers spend per transaction, the list really goes on and on.
Using this tool in Miro you have the ability to gain insights from far more resources than what is available to you with a physical board. Perhaps you can make the board public and get insights from other industry professionals via a post of your favorite social media outlet. Or, you can imbed the board into a collaboration space that you use frequently and challenge your team members to add a number of cards throughout their workday. Think of the possibilities for crowdsourcing solutions!
This template was created by NEXT LEVEL Partners.
Get started with this template right now.
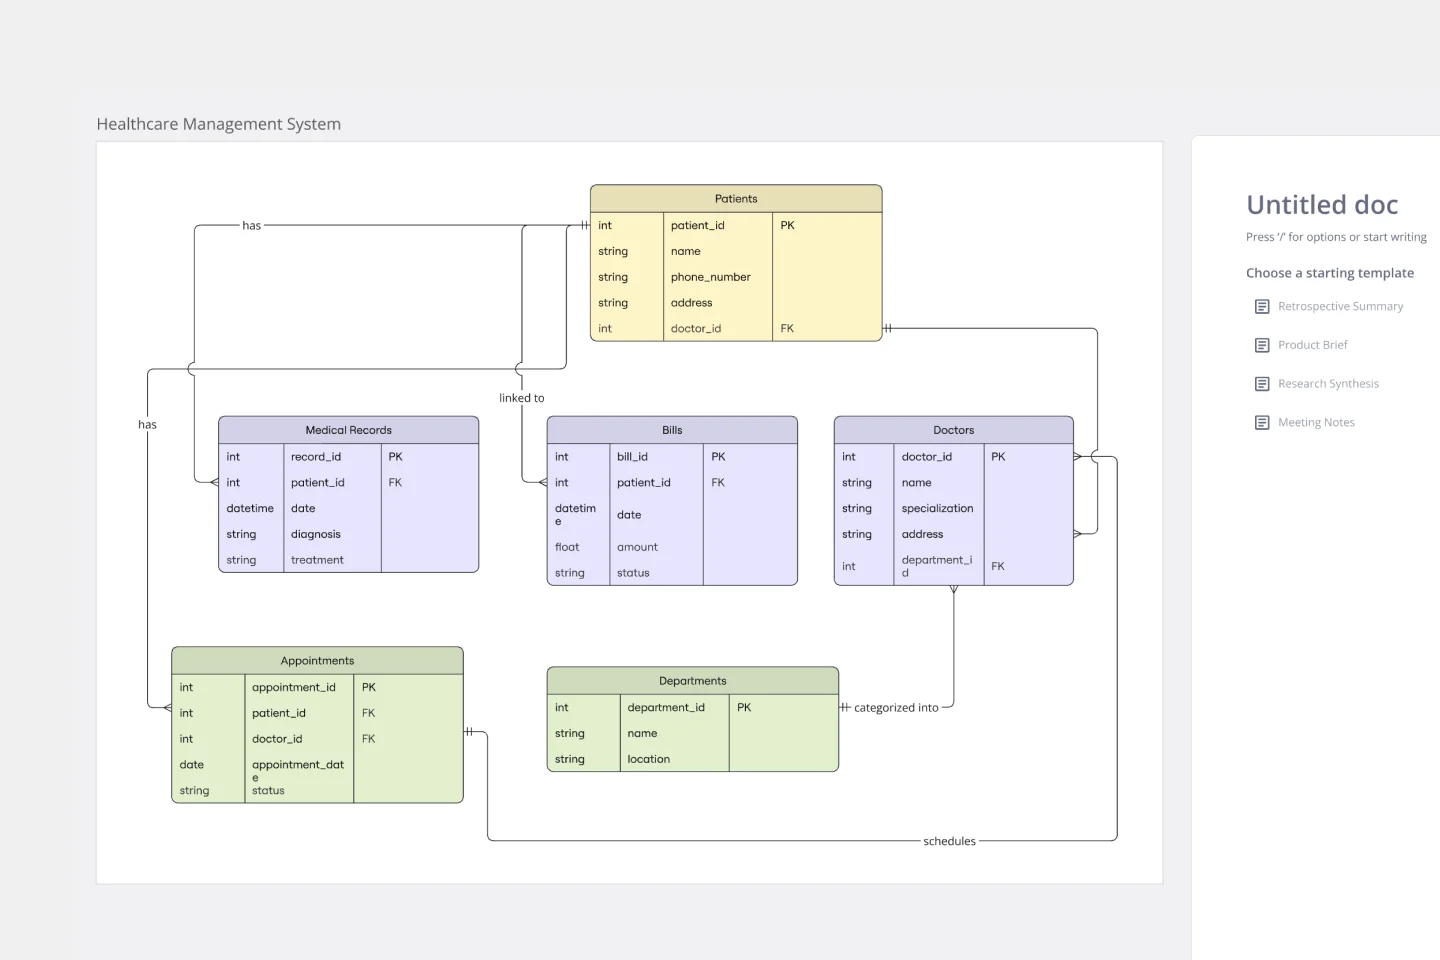
ERD Healthcare Management System Template
Works best for:
ERD
The ERD Healthcare Management System Template streamlines the process of creating and managing entity-relationship diagrams for healthcare management systems. This template helps users visualize the complex relationships between different entities such as patients, healthcare providers, medical records, and billing information. It offers a flexible and customizable framework that can be adapted to fit the specific needs of any healthcare management system, ensuring clarity and efficiency in system design and database structure.
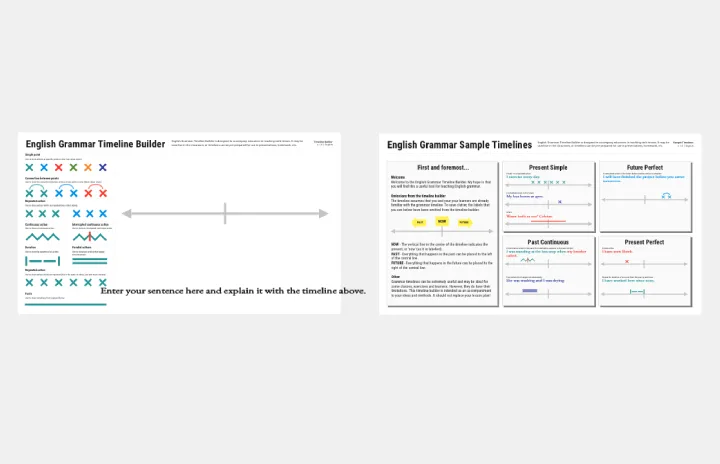
English Grammar Timeline Builder
The English Grammar Timeline template helps you map out the progression of grammar concepts over time. This is a great tool for educators and students to visualize the sequence and relationship between different grammar topics, making learning and teaching more effective.
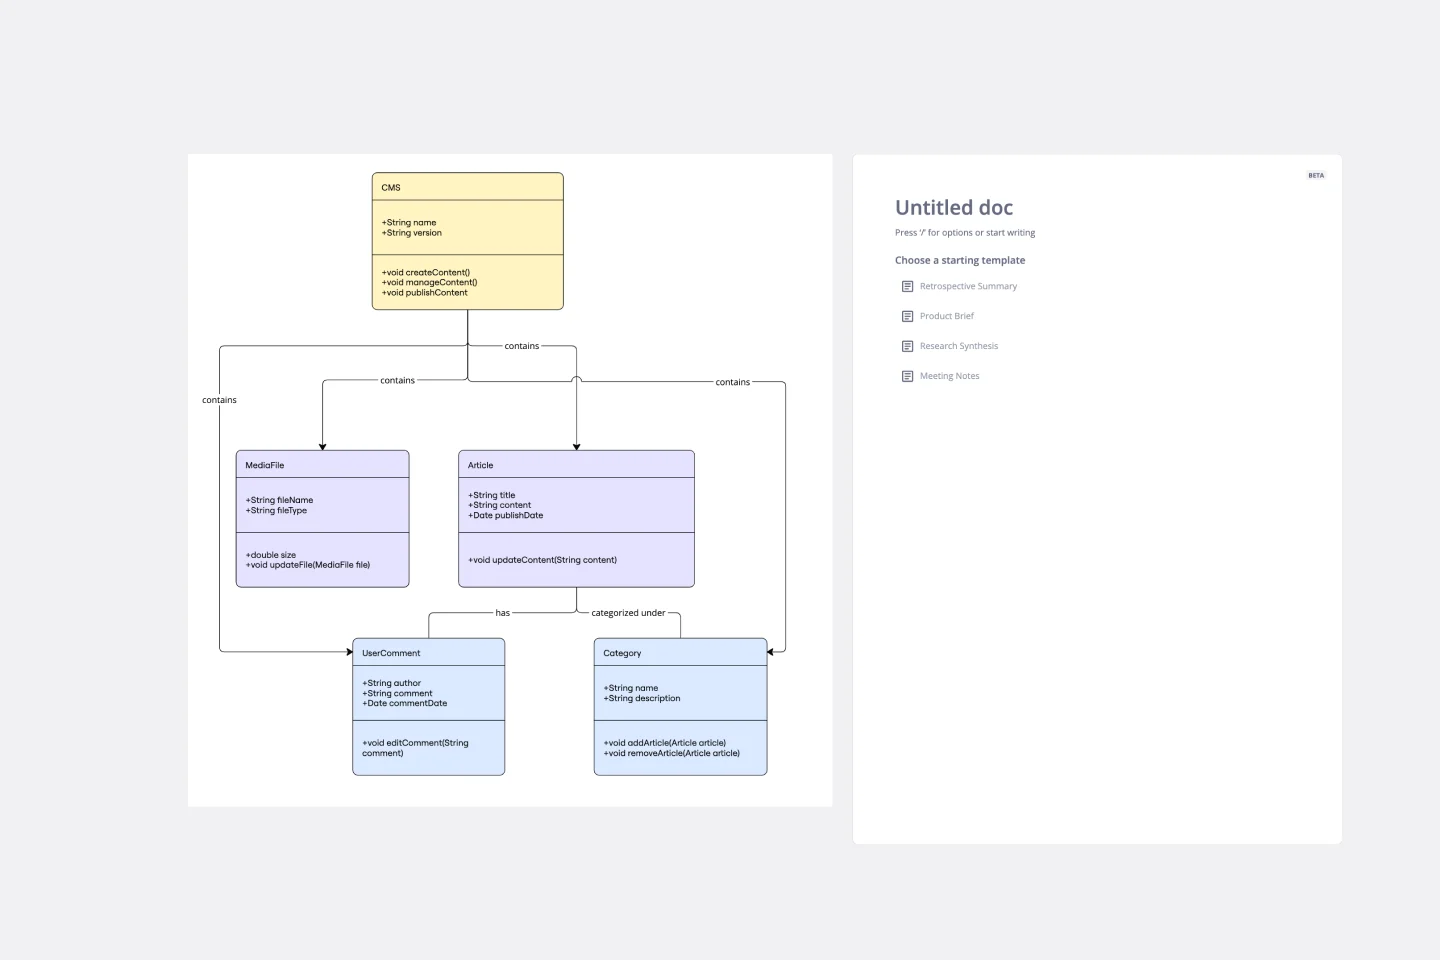
UML Class Content Management System (CMS) Template
Works best for:
UML
The UML Class Content Management System CMS Template simplifies documenting and designing the architecture of a Content Management System. It allows for the creation of UML class diagrams to visualize the structure of a CMS. Teams can efficiently map out key classes and their interactions, such as how users create, manage, and publish digital content. The template's integration into Miro's collaborative platform allows for real-time teamwork, customization, and easy sharing of feedback. This streamlines the documentation process and is valuable for software development projects aiming to develop or refine a CMS.
Product Vision Statement
Works best for:
Product Management, Planning
The Product Vision Statement template helps product teams articulate clear and inspiring visions for product development. By defining long-term goals, market aspirations, and customer value propositions, this template aligns teams around a shared vision for success. With sections for outlining strategic objectives, guiding principles, and success metrics, it provides clarity and direction for product development efforts. This template serves as a compass for product teams, guiding them towards meaningful outcomes and driving innovation and growth.
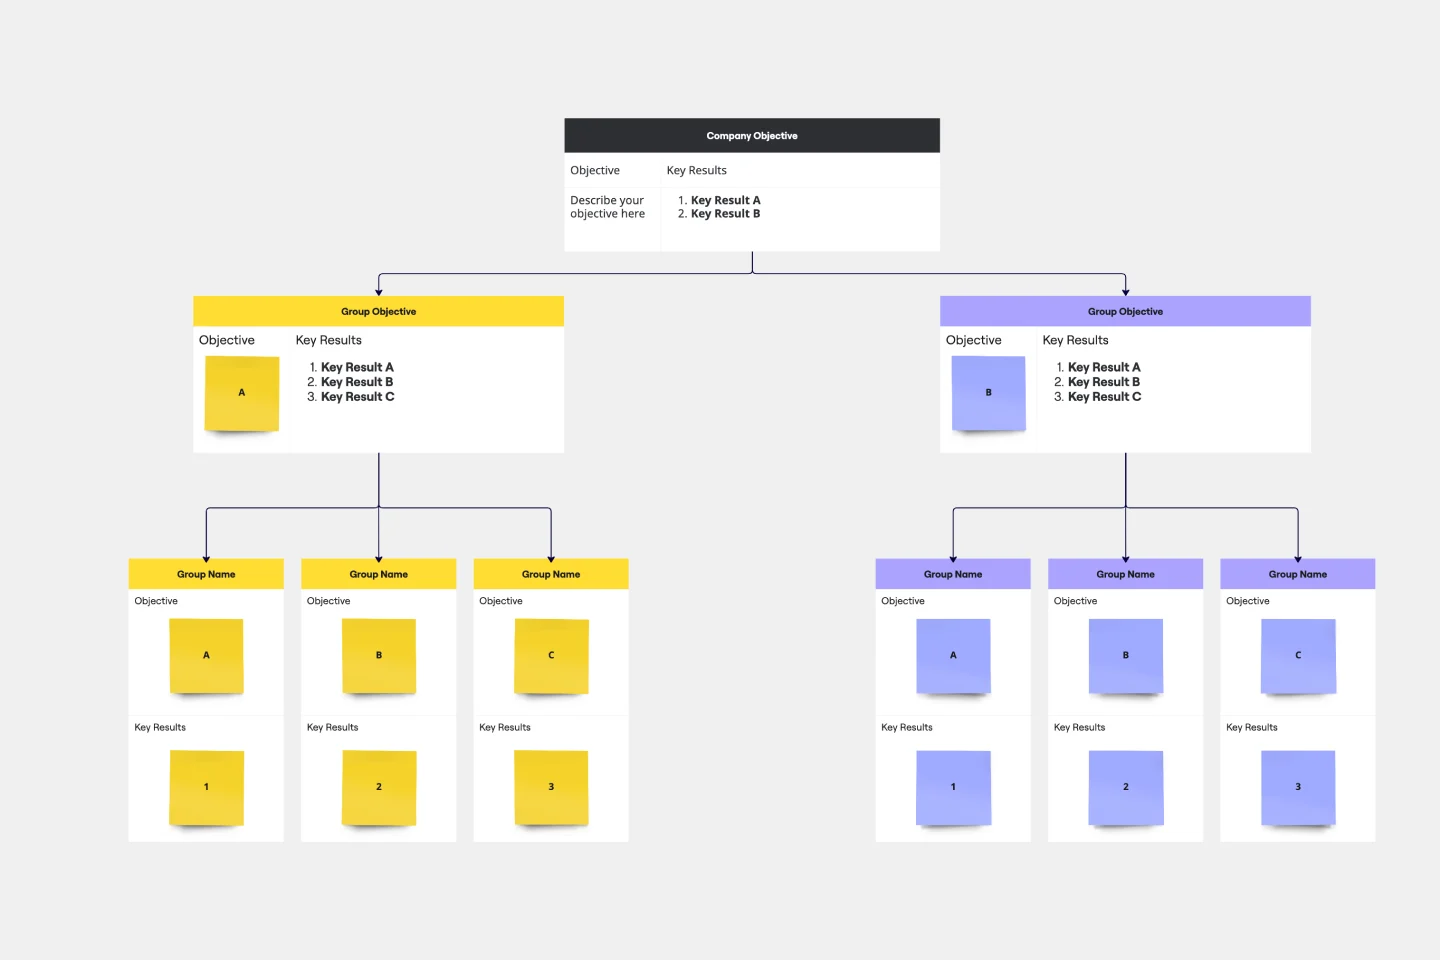
Objectives and Key Results (OKRs) Template
Works best for:
Leadership, Strategic Planning, Project Planning
Clarity, focus, and structure — those are the key ingredients to feeling confident in your company’s directions and decisions, and an OKR framework is designed to give them to you. Working on two main levels — strategic and operational — OKRs (short for objectives and key results) help an organization’s leaders determine the strategic objectives and define quarterly key results, which are then connected to initiatives. That’s how OKRs empower teams to focus on solving the most pressing organizational problems they face.
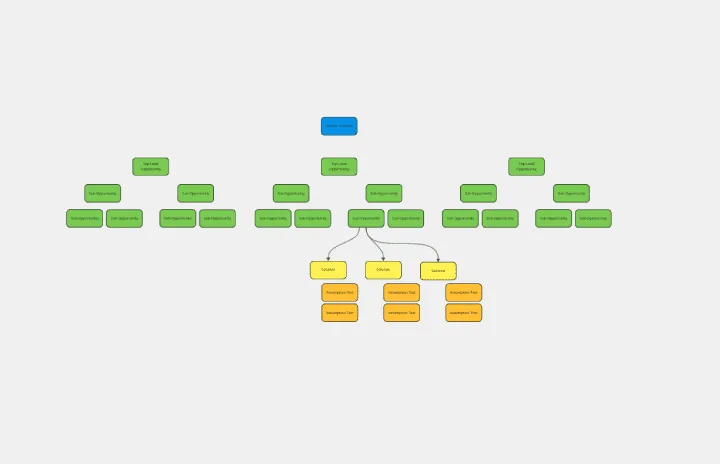
Opportunity Solution Tree
Works best for:
Diagramming
The Opportunity Solution Tree template is a visual tool for identifying and prioritizing opportunities and solutions. It provides a structured framework for mapping customer needs, pain points, and potential solutions. This template enables teams to explore divergent ideas, evaluate alternatives, and focus on high-impact solutions. By promoting customer-centricity and innovation, the Opportunity Solution Tree empowers teams to address market needs effectively and deliver value-driven solutions.