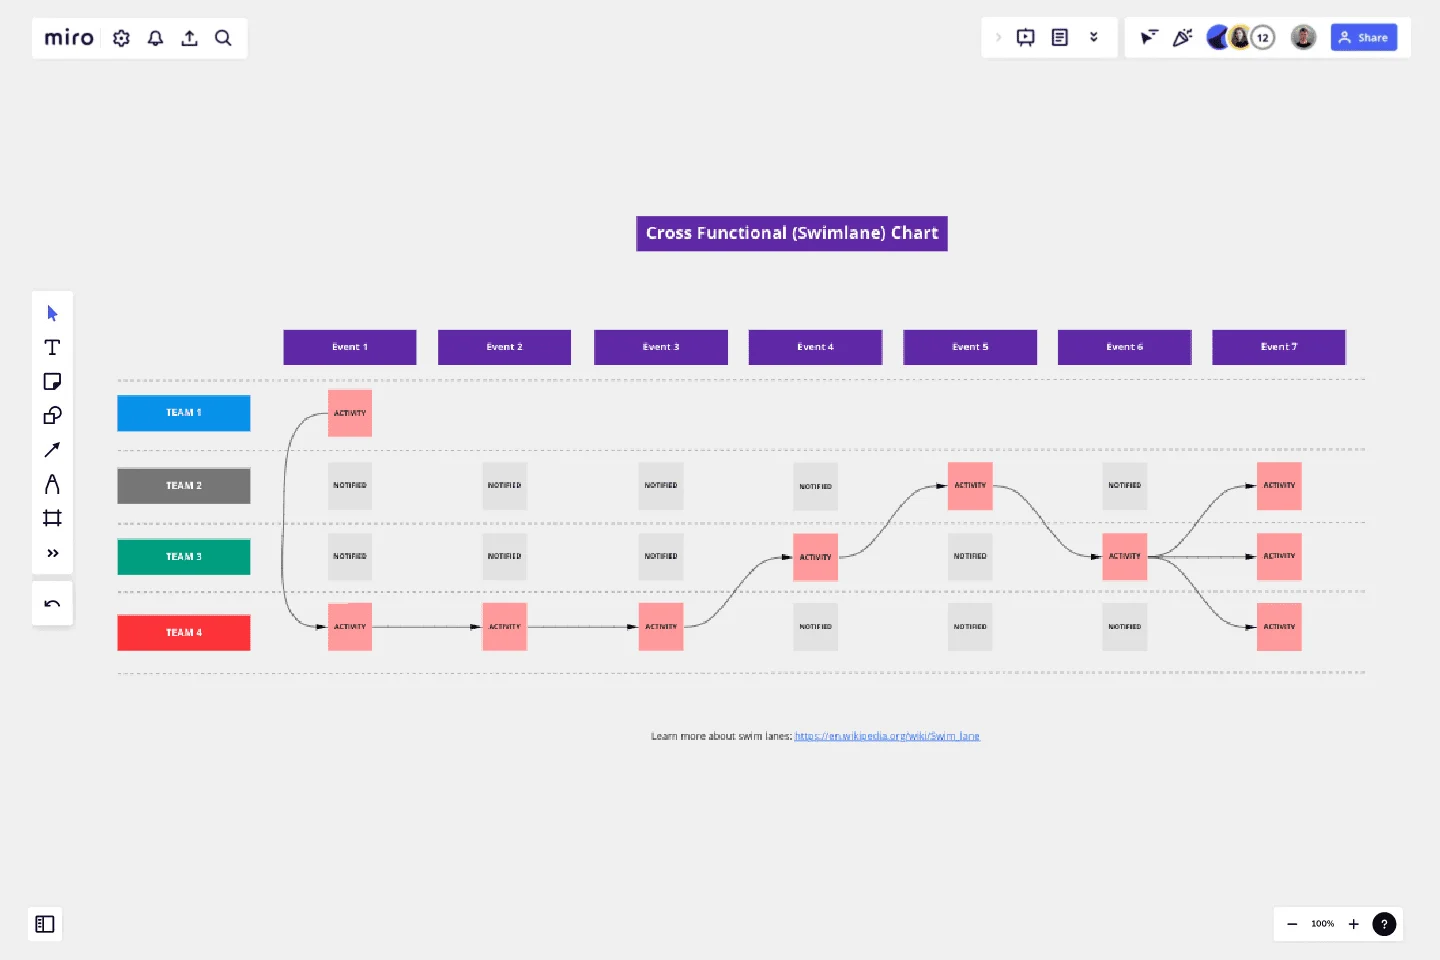
Cross Functional (Swimlane) Chart
Use this template to visualize how a process moves through various teams.
I use this template to visualize how a process moves through various teams, departments or stakeholders, demonstrating steps within a process, the owner of those steps and the inputs as well as output segments noted within the flow.
If you have non-linear processes, what to review INPUT/OUTPUT, or are simply looking to provide an overview of team activities to management or users, then this Cross Functional (Swimlane) Chart is an excellent way to visualize this.
Get started with this template right now.
SDLC Template
Works best for:
Diagramming
The Software Development Life Cycle (SDLC) template is a well-designed visual tool that helps software development teams follow a structured approach from the initial concept to the final deployment of the software. One of the most significant benefits of using this template is that it promotes clear, streamlined communication among team members. By breaking the development cycle into distinct phases, all stakeholders can stay informed about the progress of the project and understand their responsibilities within the larger context. This enhanced communication reduces the chances of misunderstandings and ensures that everyone works together towards the common goal of delivering high-quality software. The template acts not only as a roadmap but also as a shared language for the team, improving collaboration and the efficient progression of the project through each critical stage.
OKR Planning Template
Works best for:
Strategic Planning, Meetings, Workshops
The OKR Planning template helps you turn exhaustive OKR sessions into dynamic and productive meetings. Use this template to make OKR planning more interactive, guiding your team through the session with creative Ice Breakers and Brainstorms, so you can co-create your OKRs and define the key results and action plans to achieve them.
KPI Tree Template
Works best for:
Strategy & Planning
The KPI Tree Diagram is a visual tool that hierarchically illustrates an organization's objectives and breaks them down into their subsequent strategies, tactics, and measurable KPIs. By arranging these components in a tree-like structure, the diagram captures the interrelationships and dependencies between the overarching goals and the specific steps to achieve them.
Product / Market Fit Canvas Template
Works best for:
Market Research, Strategic Planning, Product Management
The product/market fit canvas template is used to help product teams meet customer and market needs with their product design. This template looks at a product in two dimensions: first, how the product fits user needs, and second, how the fully designed product fits within the market landscape. This combined metric understands a product holistically from the way customers use and desire a product, to the market demand. By comparing customer and product qualities side by side, users should better understand their product space and key metrics.
ERD Educational Learning Management System Template
Works best for:
ERD
The ERD Educational Learning Management System Template is designed to streamline the management and organization of educational systems, particularly useful for institutions adapting to online and hybrid learning environments. It helps in efficiently planning and implementing Learning Management System (LMS) features by identifying key entities such as Students, Courses, Instructors, Assignments, and Grades, and the relationships between them.
Calendar 2024 - a Year timeline
Works best for:
Strategy, Planning
The Calendar 2024 a year Timeline template is perfect for planning and organizing your year. It helps you schedule important dates, track annual goals, and stay on top of deadlines. This template ensures you have a clear overview of your year ahead.
