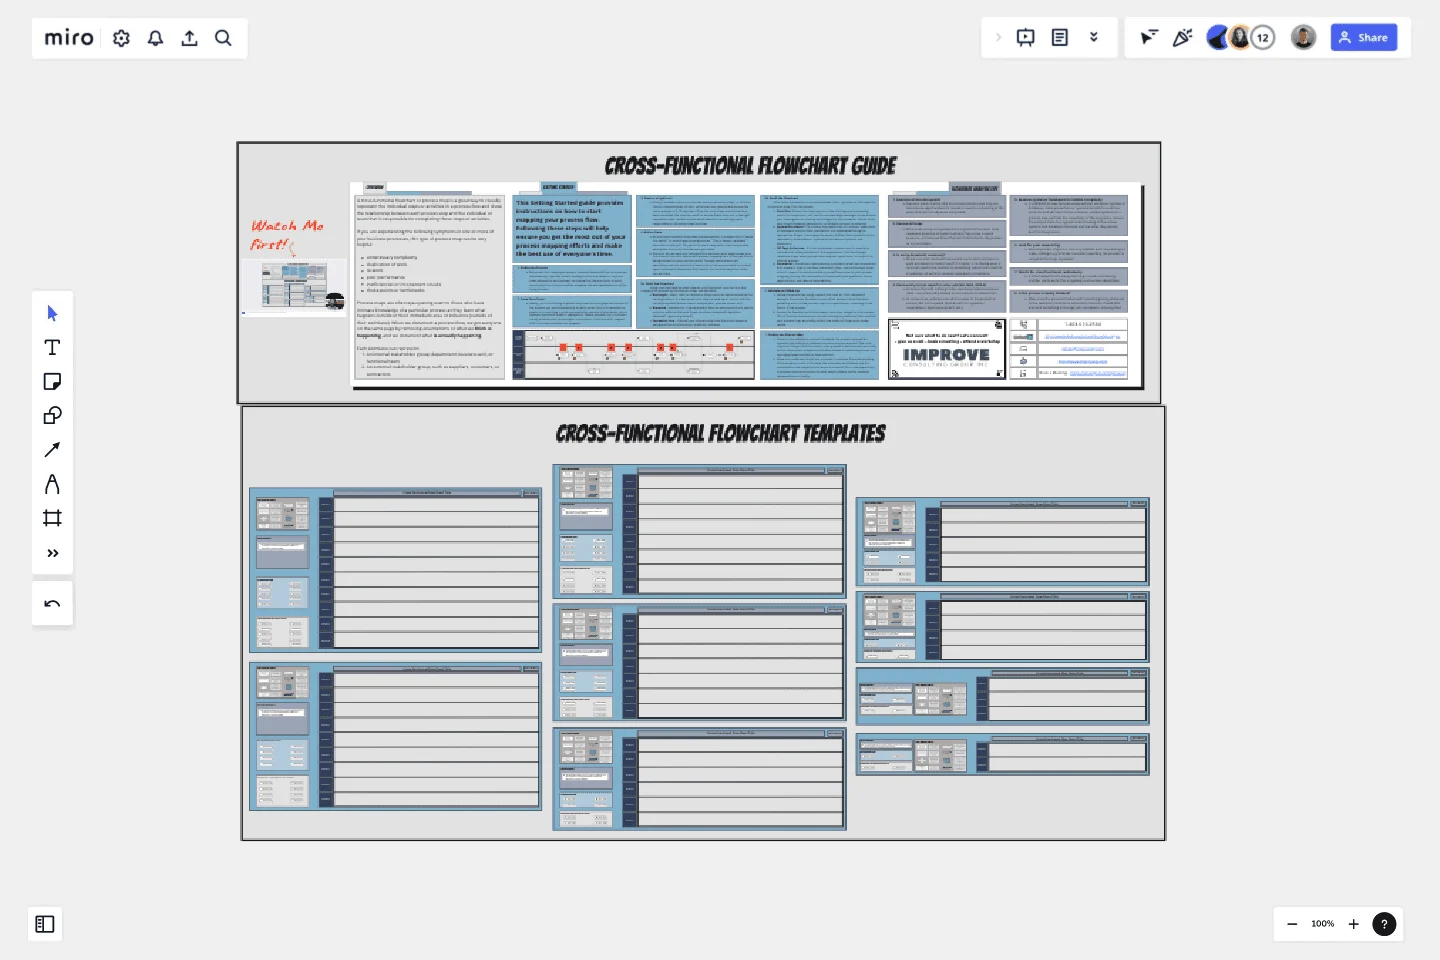
Cross-Functional Flowchart by Hiro Studio
A cross-functional flowchart or process map is a great way to visually represent the individual steps or activities in a process flow and show the relationship between each process step and the individual or team that is responsible for completing those steps or activities.
If you are experiencing the following symptoms in one or more of your business processes, this type of process map can be very helpful:
unnecessary complexity
duplication of work
re-work
poor performance
inefficiencies or inconsistent results
choke points or bottlenecks
Process maps are often eye-opening even to those who have intimate knowledge of a particular process as they learn what happens outside of their immediate area of influence (outside of their swimlane). When we document a process flow, we get everyone on the same page by removing assumptions of what we think is happening, and we document what is actually happening.Each swimlane can represent:
An internal stakeholder group, department, business unit, or functional team
An external stakeholder group, such as suppliers, customers, or contractors"
This template was created by Hiro Studio.
Get started with this template right now.
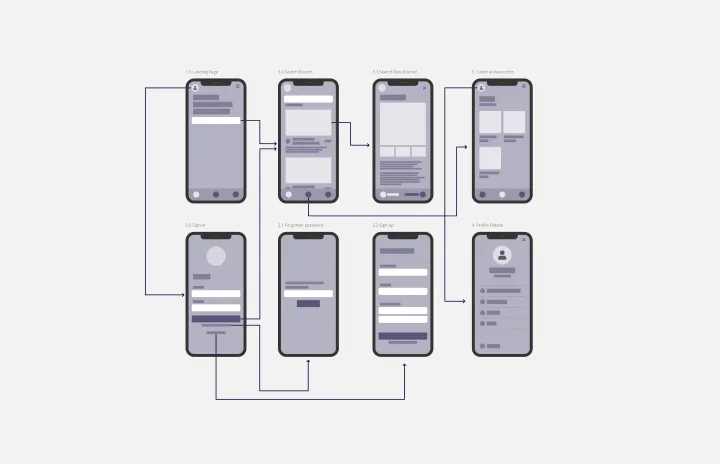
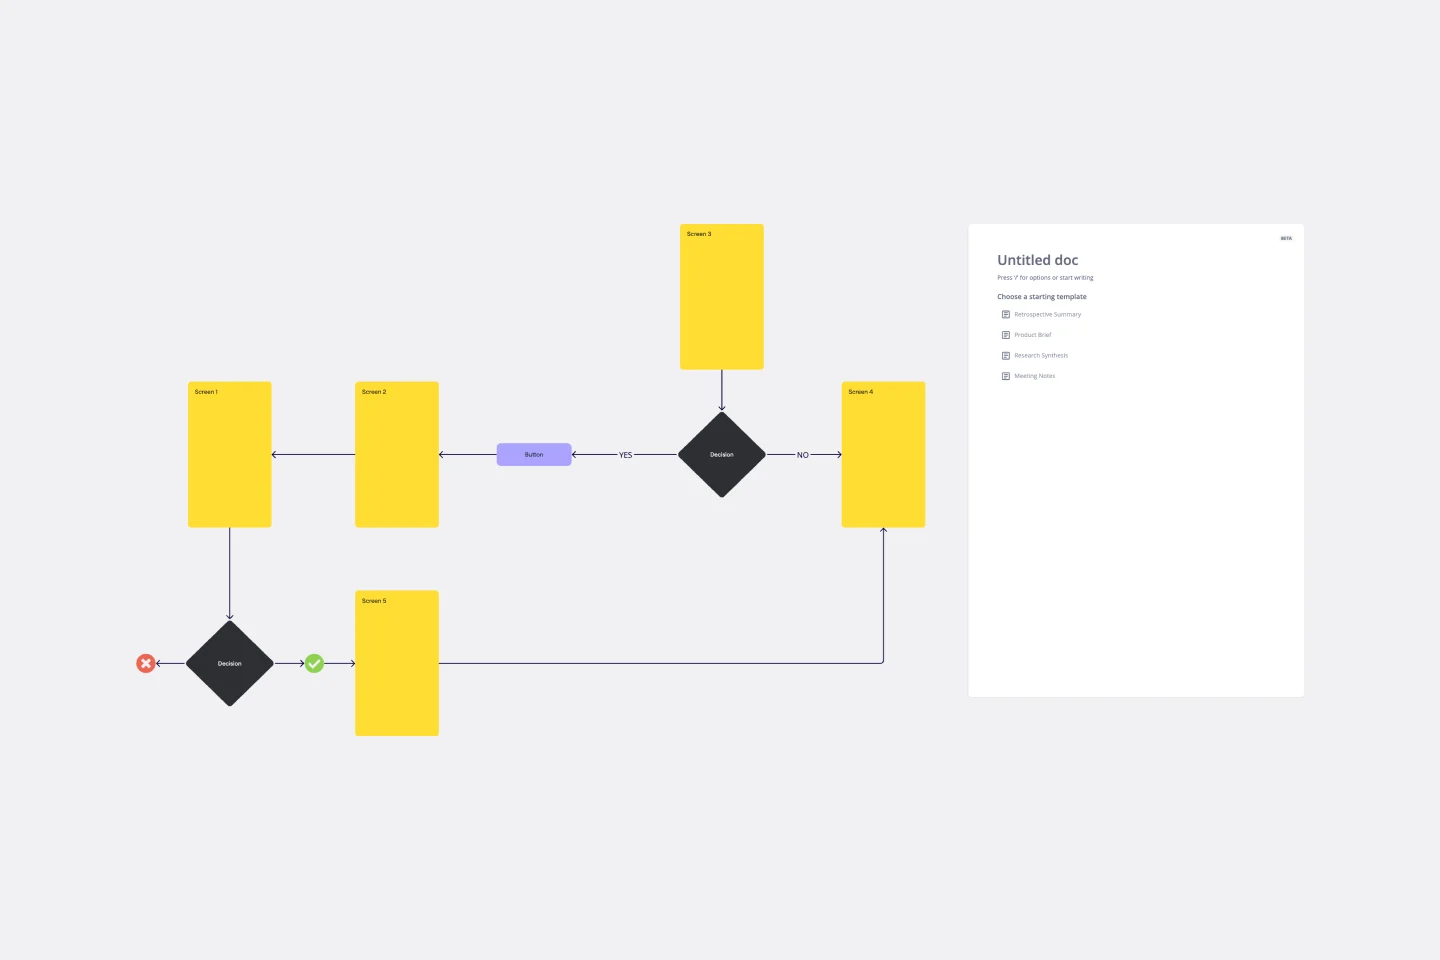
Screen Flow Template
Works best for:
UX Design, Product Management, Wireframes
A screen flow (or wireflow) brings together a multi-screen layout that combines wireframes with flowcharts. The result is an end-to-end flow that maps out what users see on each screen and how it impacts their decision-making process through your product or service. By thinking visually about what your customers are looking at, you can communicate with internal teams, stakeholders, and clients about the decisions you’ve made. You can also use a screen flow to find new opportunities to make the user experience frictionless and free of frustration from start to end.
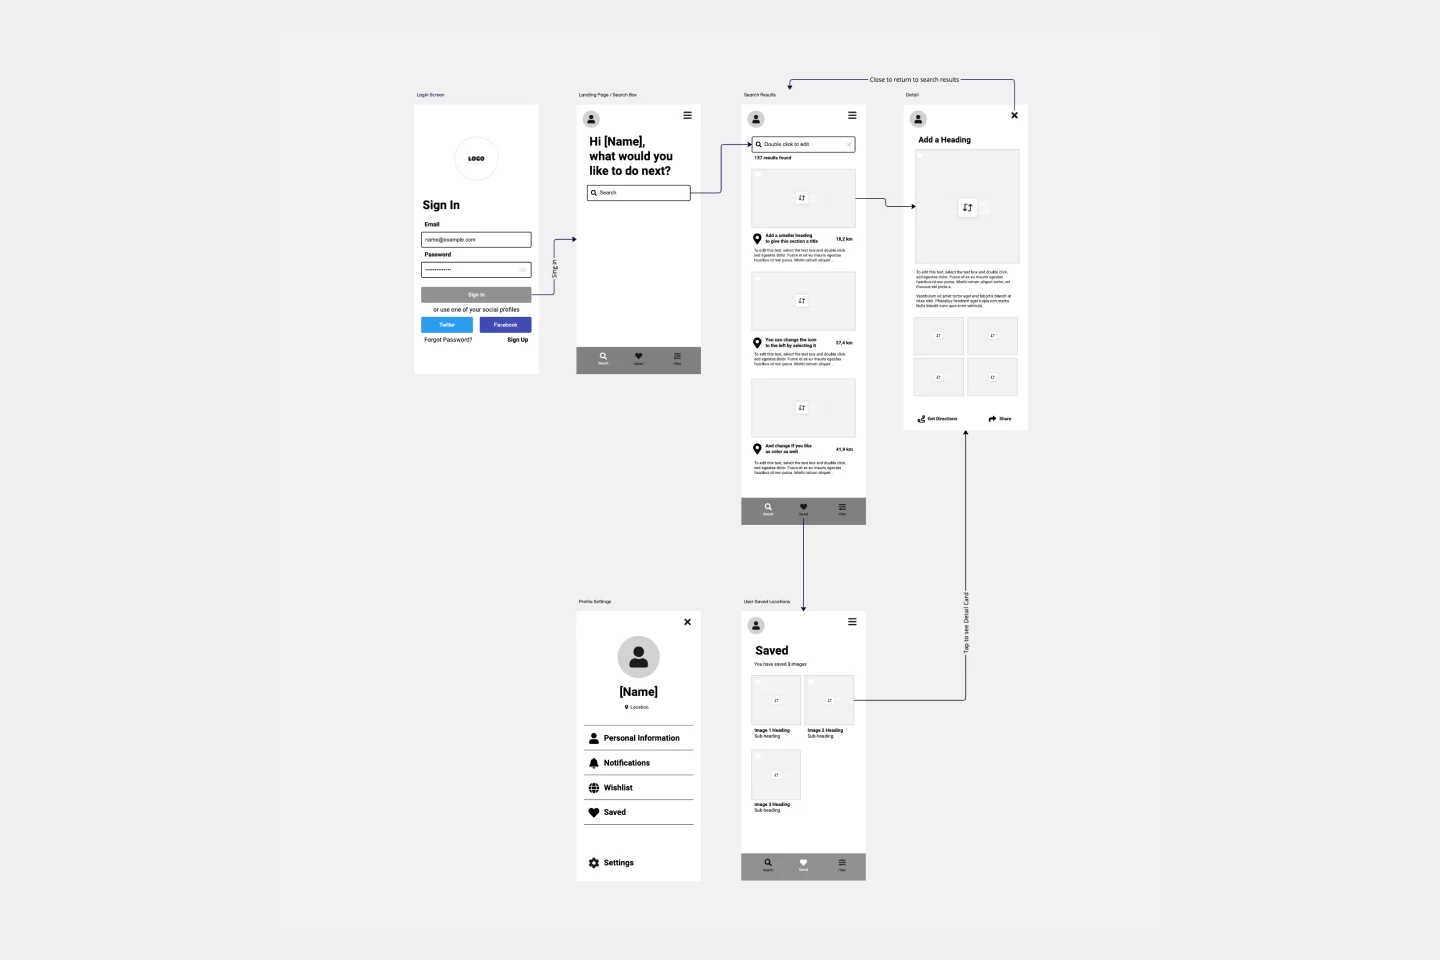
Prototype Template
Works best for:
UX Design, Design Thinking
A prototype is a live mockup of your product that defines the product’s structure, user flow, and navigational details (such as buttons and menus) without committing to final details like visual design. Prototyping allows you to simulate how a user might experience your product or service, map out user contexts and task flows, create scenarios to understand personas, and collect feedback on your product. Using a prototype helps you save money by locating roadblocks early in the process. Prototypes can vary, but they generally contain a series of screens or artboards connected by arrows or links.
AHA! Moment Flowchart
Works best for:
Mapping, Flowcharts
The AHA! Moment Flowchart template offers a visual tool for mapping out the journey of users or customers and identifying key moments of realization or insight (AHA moments). It provides a structured framework for documenting user interactions, emotions, and pain points throughout their journey. This template enables teams to understand user experiences, identify opportunities for improvement, and enhance product or service offerings. By promoting empathy and customer-centric design, the AHA! Moment Flowchart empowers organizations to create meaningful and impactful user experiences effectively.
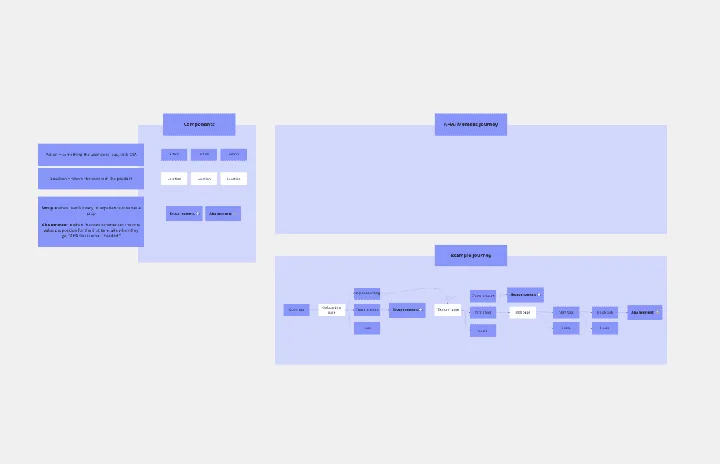
Impact Mapping Template
Works best for:
Agile Methodology, Mapping, Agile Workflows
When you’re building products and shipping goods (oh, and everything in between) there’s nothing more important than staying organized and on-task. Impact mapping is a great way to do it. This trusty product planning technique creates a graphical representation of all your goals and the steps it’ll take to reach each one — so you can clearly communicate with your teammates, align on business objectives, and build better roadmaps. Our template will help you do impact mapping for any type of project planning.
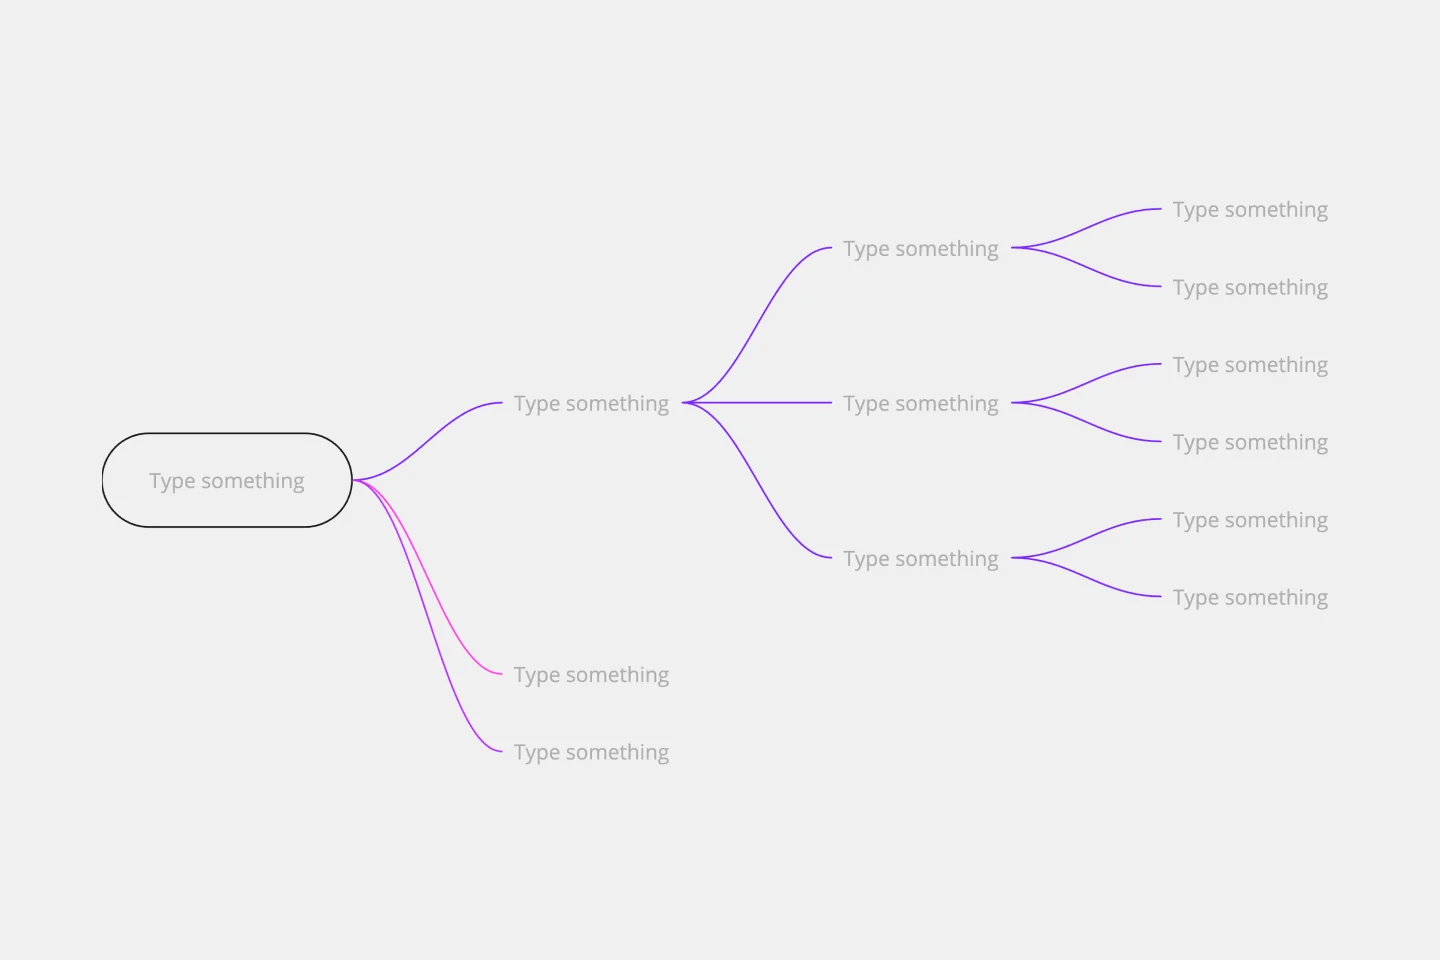
User Flow Template
Works best for:
Desk Research, Flowcharts, Mapping
User flows are diagrams that help UX and product teams map out the logical path a user should take when interacting with a system. As a visual tool, the user flow shows the relationship between a website or app’s functionality, potential actions a user could take, and the outcome of what the user decides to do. User flows help you understand what a user does to finish a task or complete a goal through your product or experience.
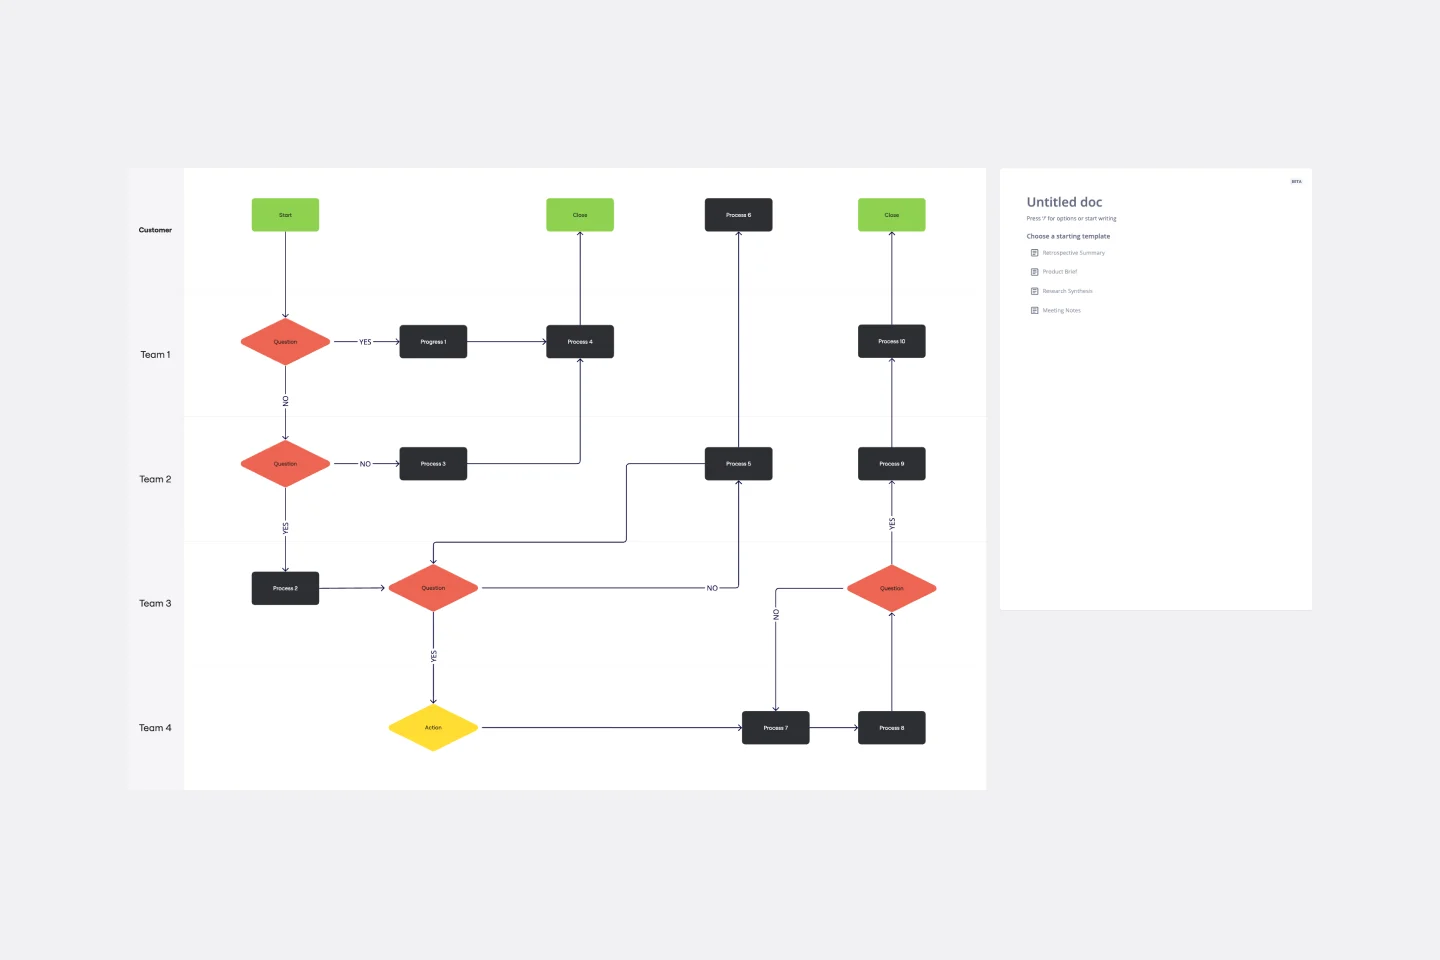
Cross Functional Flowchart
Works best for:
Org Charts, Business Management
Have a quick look at everyone on a project and see exactly what they’ll contribute. That’s the clarity and transparency a cross-functional flowchart will give you. These are also called “swim lane” flowcharts because each person (each customer, client, or representative from a specific function) is assigned a lane—a clear line—that will help you visualize their roles at each stage of the project. This template will empower you to streamline processes, reduce inefficiencies, and make meaningful cross-functional relationships.