Context Diagram Template
Understand how external entities affect your system at a high level with a context diagram.
About the Context Diagram Template
A context diagram lays out an entire software system as a single process and displays how external entities interact with the system.
The system can be a website, application, platform, or product. The external entity could be a customer, manager, teams within the same organization, other companies, and more.
The diagram is used in the discovery phase of a new project. It helps business analysts and stakeholders get an overview of the scope of the system. Management can then voice their concerns and give feedback before the project begins.
A context diagram is often referred to as a system context diagram or level 0 data flow diagram.
A data flow diagram (DFD) at subsequent levels shows the data flow through a system and contains additional information that a context diagram does not. As a level 0 DFD, a context diagram shows the highest-level overview of a system without going into detail.
The benefits of a context diagram
Here are the key benefits of a context diagram:
1. Gives a visual overview of a plan or project scope
A context diagram helps project stakeholders understand an entire software system at a single glance. It visualizes a project plan or project scope at a high level.
2. Helps you notice errors or omissions
Because the entire system is laid out in a simple, dynamic diagram, it helps teams and management identify errors in a business plan or project requirement. A context diagram can also be used to identify issues within an existing system.
3. Easy to make amendments
Context diagrams are easy to modify as new information is provided. You can edit, add, and remove every element of the diagram when there is a change in the system or an external factor.
4. Very customizable
Teams can customize an online context diagram using whichever shapes, colors, or fonts they want. They can add elements, reorganize existing ones, or simply change the visual aspects to best reflect a project's system.
5. Helps you identify your target user
Since a context diagram outlines an application's user groups and how they interact with it, developers can identify their core user groups. This then helps investors decide which projects to invest in.
6. Does not require technical knowledge
You don't need technical knowledge or coding experience to create a context diagram. Anyone can use an online tool like Miro to make one in a few minutes.
How to use your context diagram template
You can use our visual workspace to create and share context diagrams for all your projects. First, get our context diagram template and follow these steps:
Step 1:
Place your system in the center circle. Your system is the main process — it’s the focal point of the context diagram. All the other elements interact with this circle.
Step 2:
Use squares or rectangles to list external entities that interact with the system. Place them around the circle.
Step 3:
Use arrows to and from the center circle to show how the external entities communicate with the system.
Step 4:
Share your diagram with others for their feedback. Miro makes it simple to collaborate, edit, and present your Context Diagram through its interactive diagram maker.
Common use case of an effective context diagram template
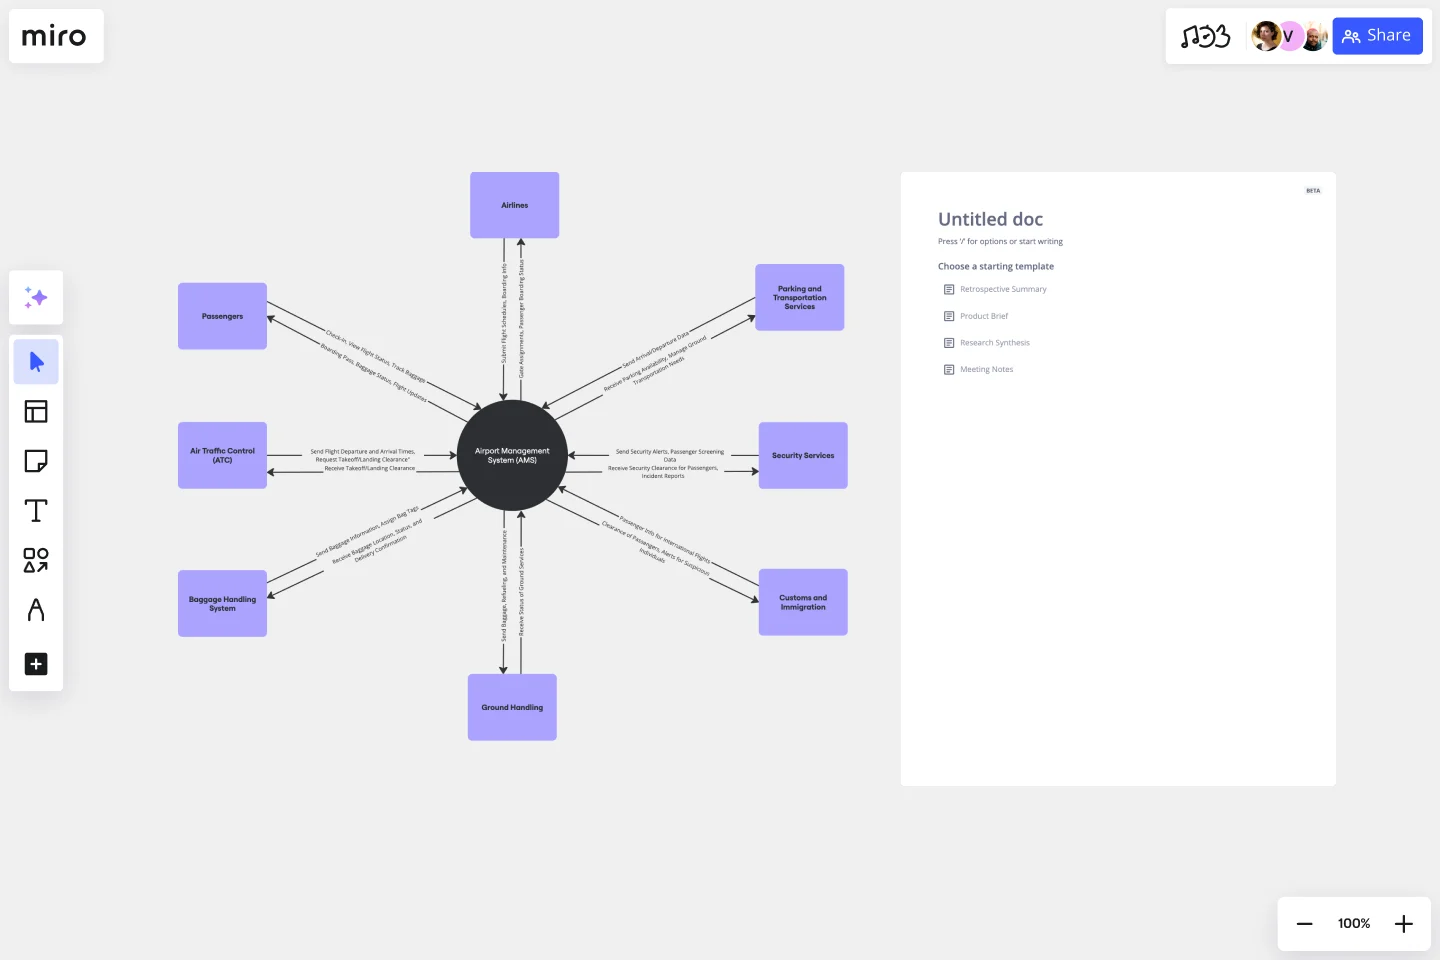
To help you better understand how our context diagram template works, let's consider a system built for a sales order. In this scenario, managers, employees, and customers interact to produce a sales order.
In a detailed and factually correct sales order, a customer buys the product and receives a sales order in return. Employees send updates and products into the system, while managers add new workers and receive data about existing employees and vendors.
A context diagram for this system will have "Sales Order System" in the center circle. The external entities are "Customers," "Employees," and "Managers."
You can draw arrows to represent an interaction. For example, you can add an arrow from Sales Order to Customer, saying "Order Invoice" to indicate that the system will send the invoice to the customer.
What should be included in a context diagram?
A context diagram must include a system or process at the center that is surrounded by external entities. Arrows are used to represent the data flow between the system and each external element.
What is the difference between a DFD and context diagram?
A data flow diagram (DFD) is a flowchart that shows data flow throughout a system. A context diagram is focused on the external entities. It shows the entire system as one element and highlights its relationship with external factors.
How do you create a context diagram?
Creating a context diagram is easy with Miro. All you have to do is select the context diagram template and edit the existing elements to represent your system. You can change the arrows to depict interactions and customize the visuals as required.
Get started with this template right now.
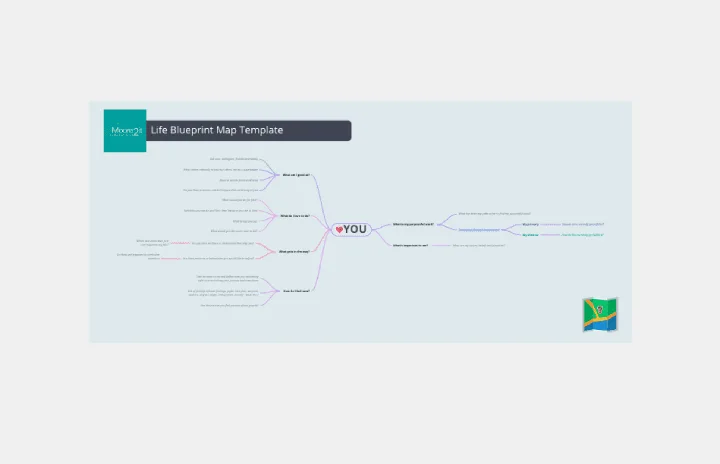
Personal Life Blueprint - Clarity Facilitator
Works best for:
Diagramming
The Personal Life Blueprint Clarity Facilitator template is a visual tool for individuals to clarify their personal goals, values, and priorities. It provides a structured framework for reflecting on different aspects of life and setting actionable objectives. This template enables individuals to gain clarity, focus, and direction in their personal and professional lives. By promoting self-awareness and goal-setting, the Personal Life Blueprint empowers individuals to lead more fulfilling and purpose-driven lives.
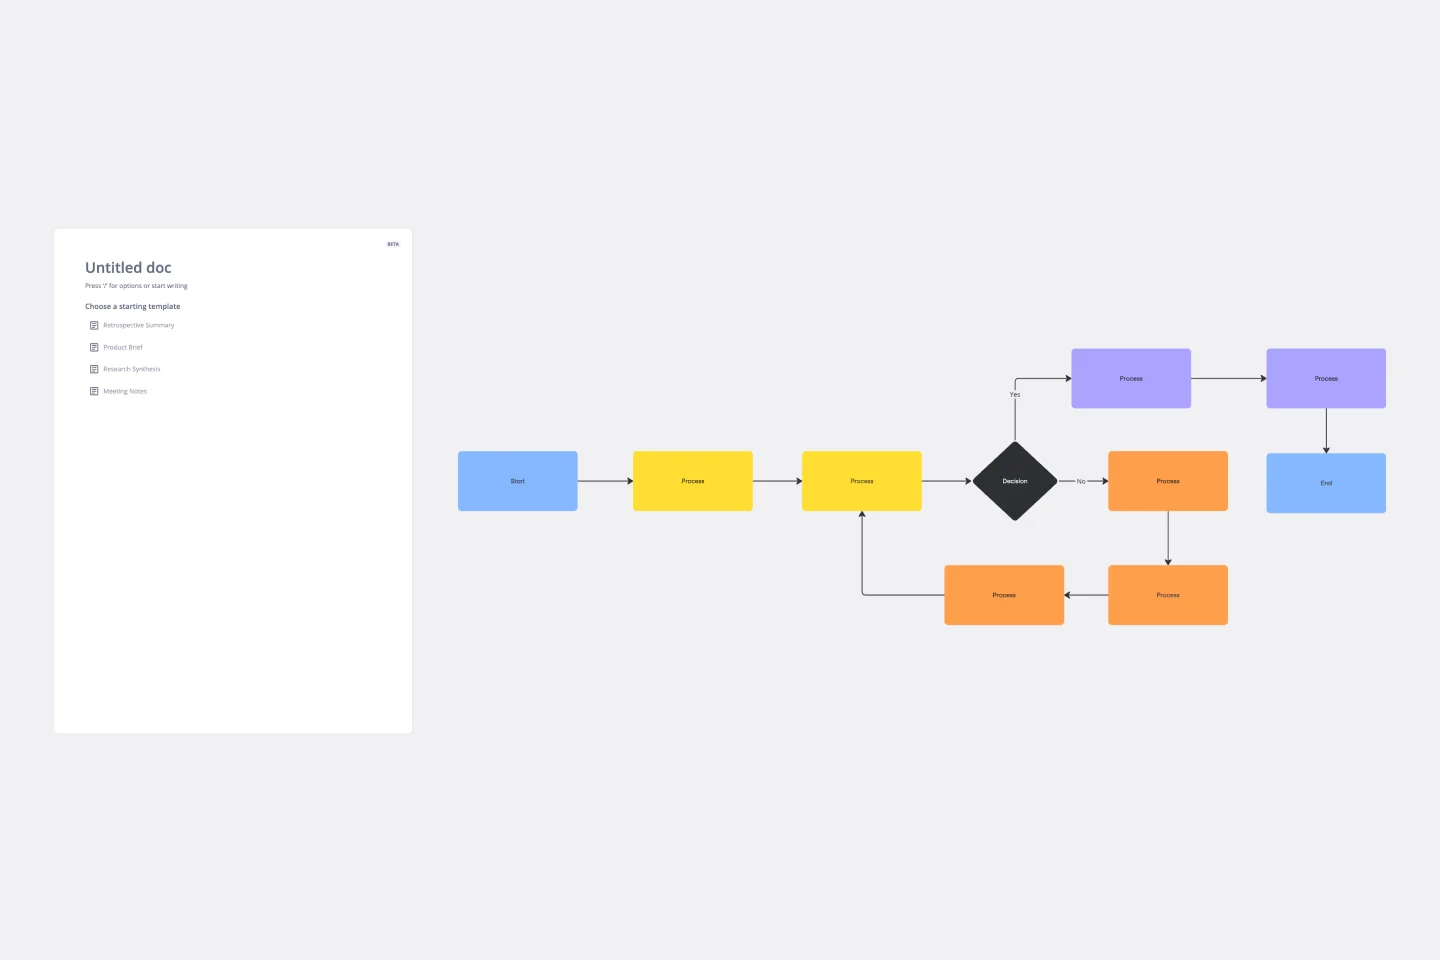
Flowchart Template
Works best for:
Flowcharts, Mapping, Diagrams
Trying to explain a process or workflow to your team — or just wrap your head around it yourself? Sometimes the best way is to see it, and that’s when you create a flowchart. Using common shapes (generally just ovals, rectangles, diamonds, and arrows), a flowchart shows you the direction a process or workflow goes and the order of steps. Beyond giving you a clear understanding, you’ll also be able to see potential flaws and bottlenecks, which helps you refine and improve your process and create a better product more efficiently.
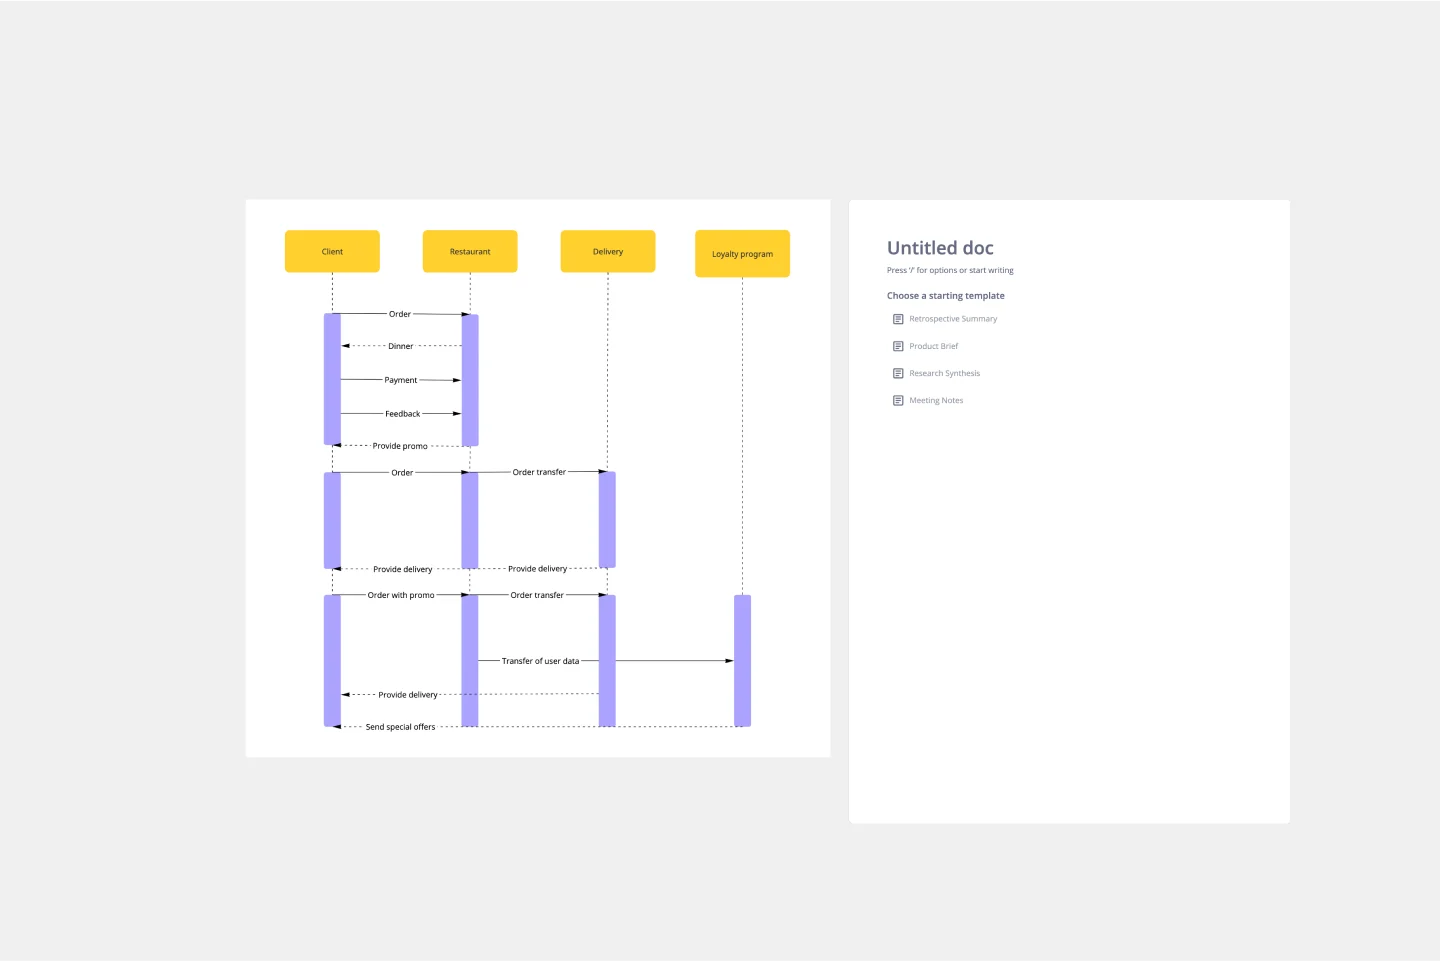
UML Sequence Diagram Template
Works best for:
Software Development, Mapping, Diagrams
Analyze and showcase how external entities interact with your system using a sequence diagram. Get a bird’s-eye view of your work processes, business functions, and customer interactions using this diagram. Also, identify any potential problems early and solve them before implementation.
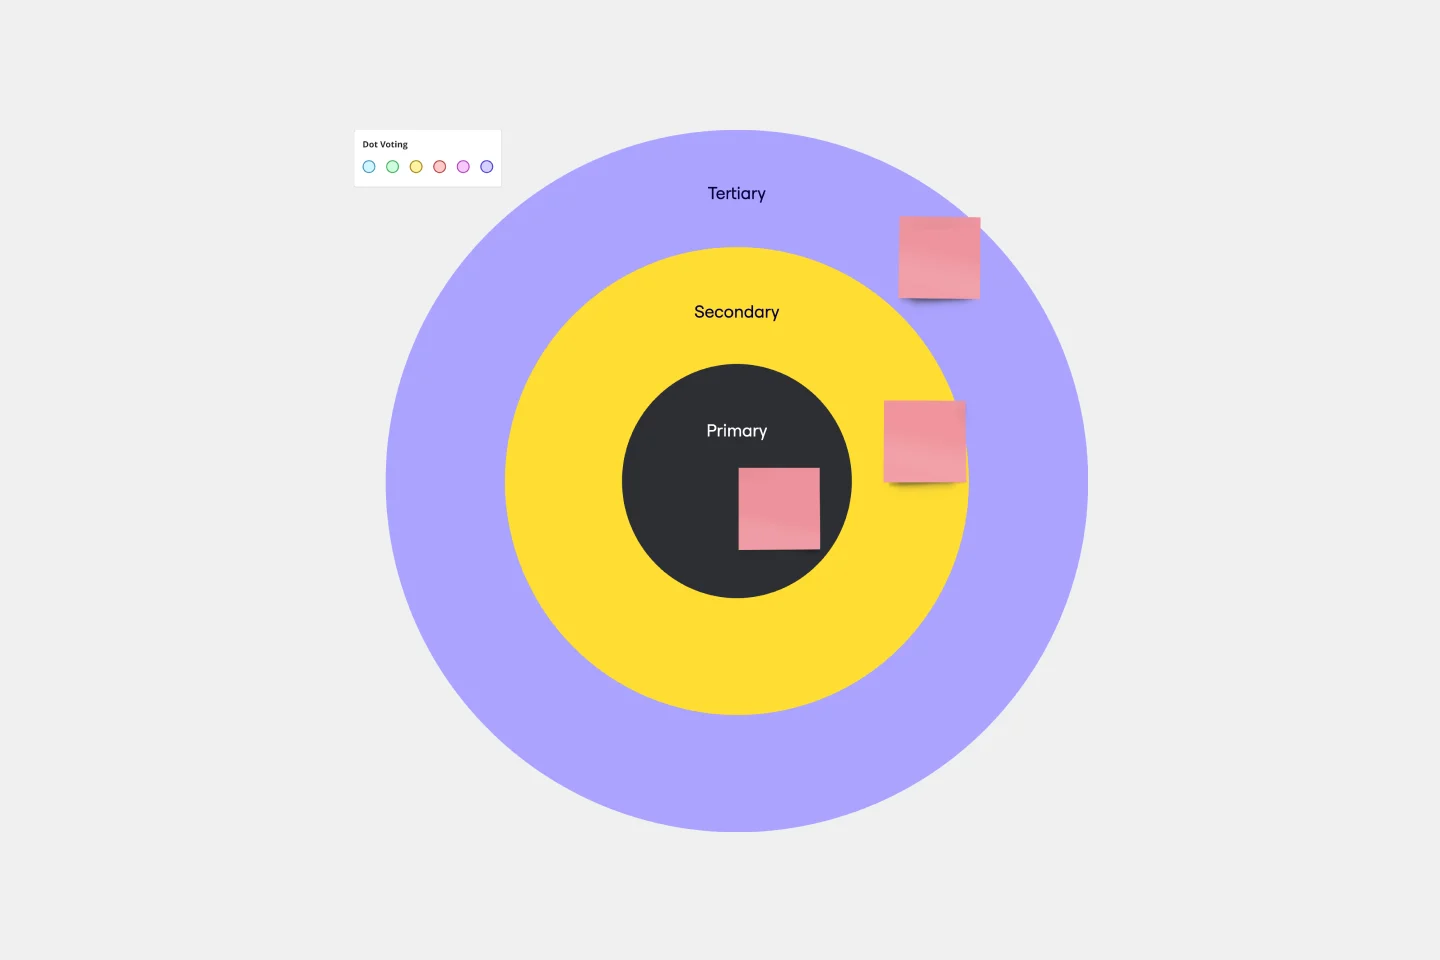
Bull's Eye Diagram Template
Works best for:
Diagrams, Project Management, Prioritization
When you’re a growing organization, every decision can feel like it has make-or-break consequences—which can lead to decision paralysis, an inability to prioritize, inefficient meetings, and even low morale. If that sounds like you, put a Bull’s Eye Diagram to work. True to its name, a Bull’s Eye Diagram uses a model of concentric circles to help companies establish priorities, make critical decisions, or discuss how to remove or overcome obstacles.
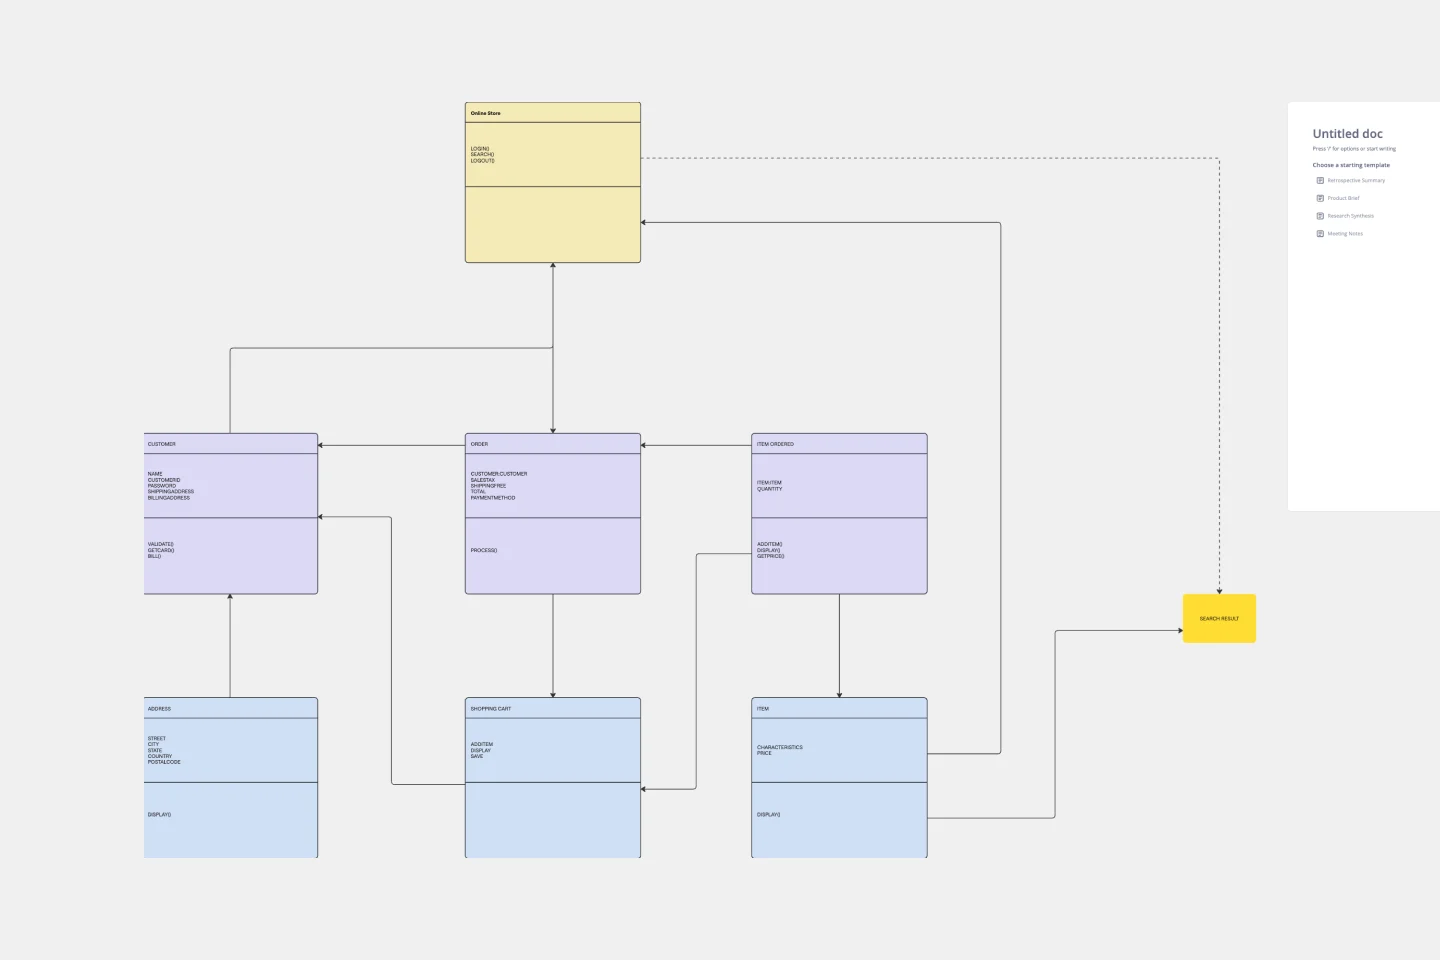
UML Diagram Template
Works best for:
Diagrams, Software Development
Originally used as a modeling language in software engineering, UML has become a popular approach to application structures and documenting software. UML stands for Unified Modeling Language, and you can use it to model business processes and workflows. Like flowcharts, UML diagrams can provide your organization with a standardized method of mapping out step-by-step processes. They allow your team to easily view the relationships between systems and tasks. UML diagrams are an effective tool that can help you bring new employees up to speed, create documentation, organize your workplace and team, and streamline your projects.
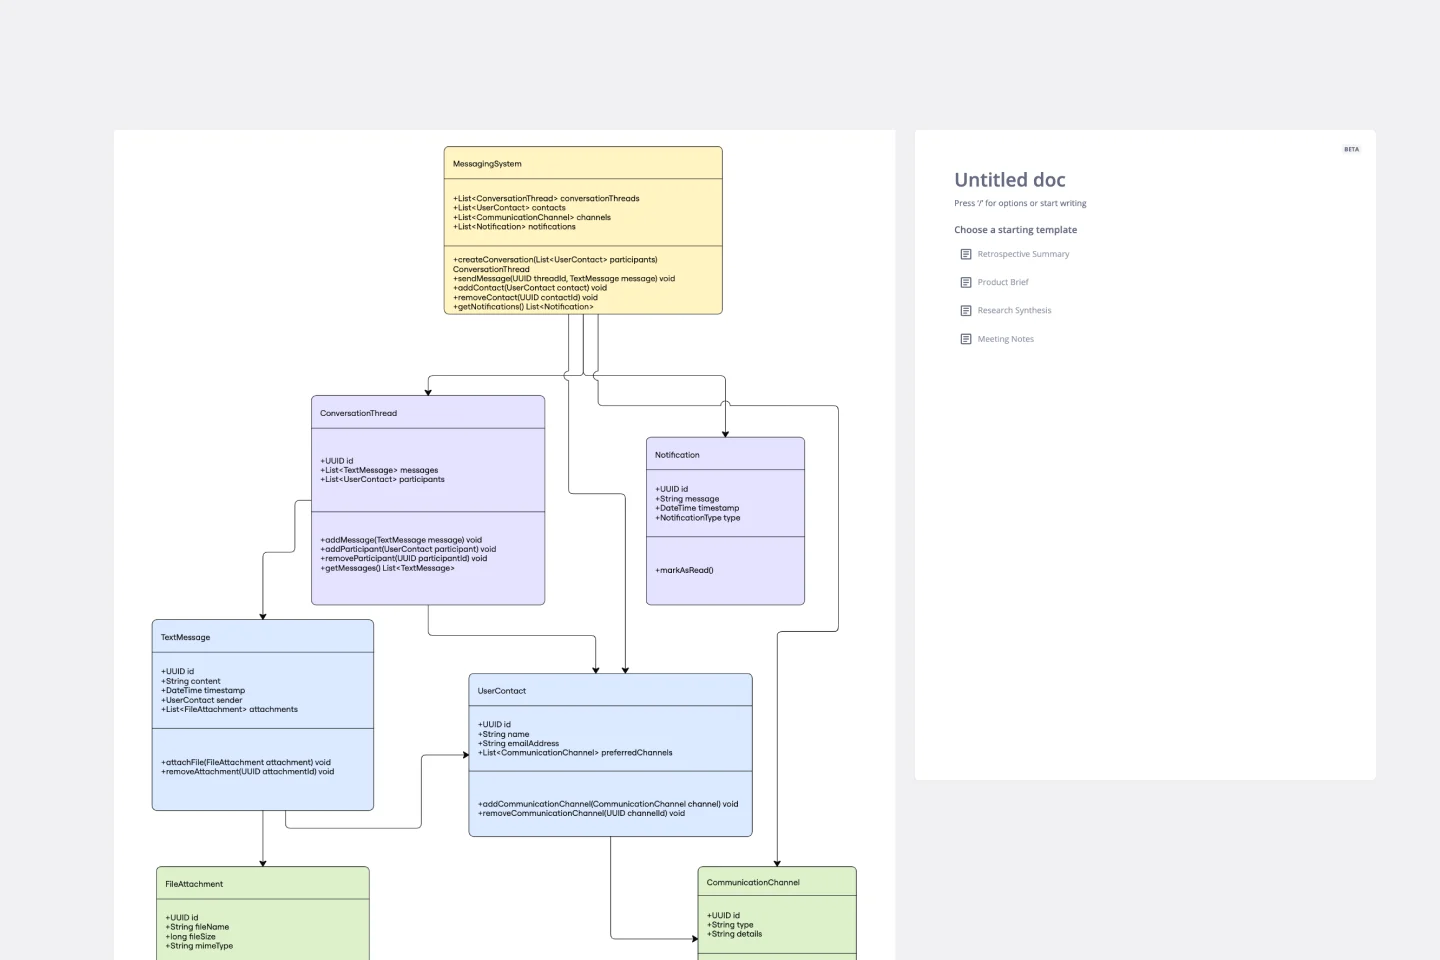
UML Class Messaging System Template
Works best for:
UML
The UML Class Messaging System Template streamlines the process of designing and analyzing messaging systems. It allows users to visually map out the structure of a system by detailing classes, their attributes, operations, and the relationships among objects. This template is particularly useful for illustrating the functionality of a messaging system, including the management of text messages, conversation threads, user contacts, notifications, and channels. It offers a clear visual representation of how all these elements interact within the system, making it an invaluable resource for developers, designers, and stakeholders aiming to enhance communication and reduce errors in the development phase.