Comprehensive Guide to BPMN
Tame the Workflow Beast: Your Visual Guide to BPMN with Miro!
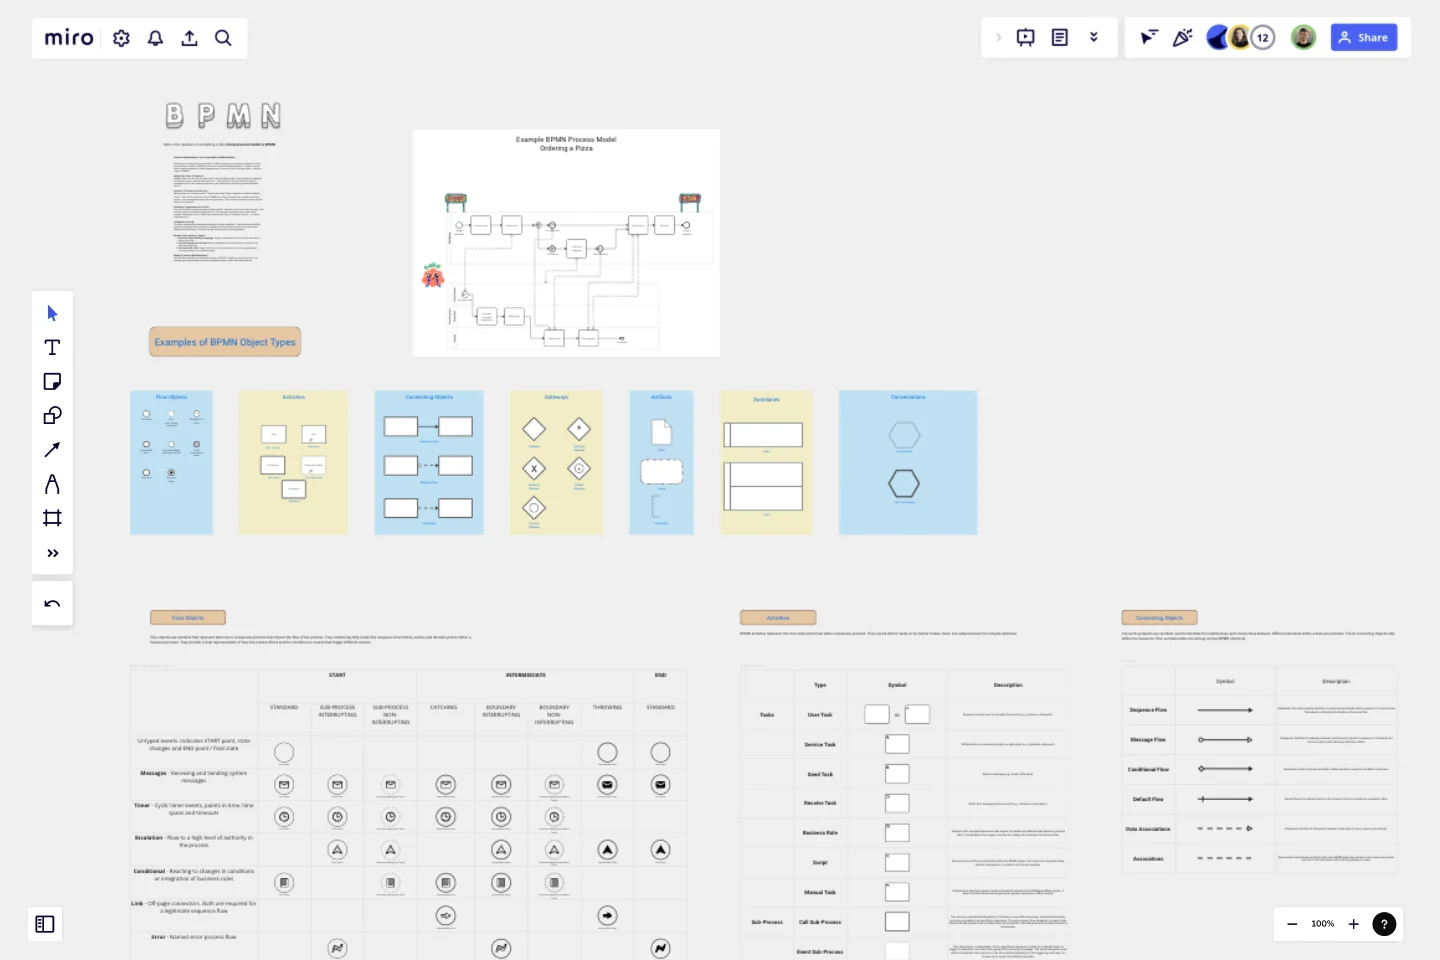
Feeling lost in a labyrinth of processes? This Miro template is your key to escaping the chaos and wielding the power of BPMN, or Business Process Modelling Notation. Imagine a world where everyone speaks the same language when it comes to how things get done – that's the magic of BPMN!
Unleash the Power of Symbols!
BPMN is like a secret code, but way cooler. Instead of boring text, it uses symbols to represent the different steps in your business process. Think circles for events that kick things off, rectangles for the core work that gets done, and diamonds for those all-important decision points.
Activities: The Heart of the Process
Need someone to review an order? That's a User Task! Want a system to calculate shipping costs? That's a Service Task in action! BPMN even lets you break down complex tasks into smaller, more manageable steps with sub-processes. Think of them as handy process puzzles you can put together!
Swimlanes: Organisation at its Finest
Ever feel like tasks are bouncing around like pinballs? Swimlanes are here to save the day! They visually organise activities by department or role, making it crystal clear who owns what. Imagine a swimlane for the "Sales Team" and another for the "Fulfilment Centre" – no more finger-pointing!
Collaboration is King!
This Miro template is your battleground against messy workflows. Drag and drop the BPMN symbols, customise the text, and work together with your team to map out your processes. Imagine the satisfaction of finally having a clear picture of how things work!
Benefits Fit for a King (or Queen):
Speak the Same Workflow Language: Everyone understands what needs to be done, by whom, and when.
Spot Bottlenecks Like a Hawk: Identify roadblocks and streamline your processes for maximum efficiency.
Document Like a Pro: Create a clear and concise reference point for your processes, ensuring everyone's on the same page
Ready to Tame the Workflow Beast?
Use this Miro template and unleash the power of BPMN! Together, you and your team can conquer process complexity and build workflows that purr like a well-oiled machine.
This template was created by Paul Snedden.
Get started with this template right now.
ERD Customer Relationship Management (CRM) Template
Works best for:
ERD, CRM
The ERD Customer Relationship Management (CRM) template streamlines and enhances the management of customer relationships within businesses. It focuses on organizing customer information and interactions in a visually intuitive manner. Key entities such as Customer, Interaction, Sales Opportunity, Product, and Support Ticket are central to the template, facilitating the tracking of customer relationships, sales funnel activities, product purchases, and customer service interactions. This structured approach is critical for boosting customer satisfaction and optimizing sales strategies, making the ERD CRM template an invaluable asset for businesses aiming to improve their CRM processes.
UML Class Diagram Template
Works best for:
UML Class Diagram Template, Mapping, Diagrams
Get a template for quickly building UML class diagrams in a collaborative environment. Use the UML class diagram template to design and refine conceptual systems, then let the same diagram guide your engineers as they write the code.
Security Automations for AWS WAF Template
The Security Automations for AWS WAF template is designed to streamline the process of enhancing the security of your AWS applications. It allows teams to collaboratively design, visualize, and refine AWS WAF configurations to protect against common web exploits effectively. This template includes various components such as automated deployment pipelines, instance schedulers, and serverless image handlers, providing a robust framework for managing AWS WAF security automations. By using this template, teams can improve collaboration, achieve a clear visual representation of their AWS WAF configurations, enhance efficiency in managing AWS WAF rules, and customize the template to meet specific application security needs.
Instance Scheduler on AWS Template
Works best for:
AWS
The Instance Scheduler on AWS template is a strategic tool designed to enhance the efficiency and cost-effectiveness of managing AWS resources. It serves as a guide for automating the scheduling of Amazon EC2 and Amazon RDS instances, ensuring that these resources are operational only when necessary. This approach not only simplifies the management of instance schedules but also significantly reduces cloud computing costs by avoiding unnecessary runtime.
Cluster Diagram Template
Works best for:
Diagramming
The Cluster Diagram Template is a valuable tool for organizing and connecting ideas, concepts, and information in a visually compelling and coherent manner. The template's design centers on grouping related ideas around a core concept, creating a transparent and hierarchical structure. This clustering not only aids in breaking down complex information into manageable segments but also significantly enhances the process of idea generation and brainstorming. A structured yet flexible visual framework encourages deeper engagement and more precise understanding, making it an essential asset for teams and people looking to bring order to their creative and analytical processes.
Azure Guidebook
Works best for:
Cloud Infrastructure
This Miro Board visualizes and connects all the necessary provisions for required resources in Azure DevOps, Microsoft Entra (formerly Azure Active Directory), and Azure.
