Co-design Storyboard
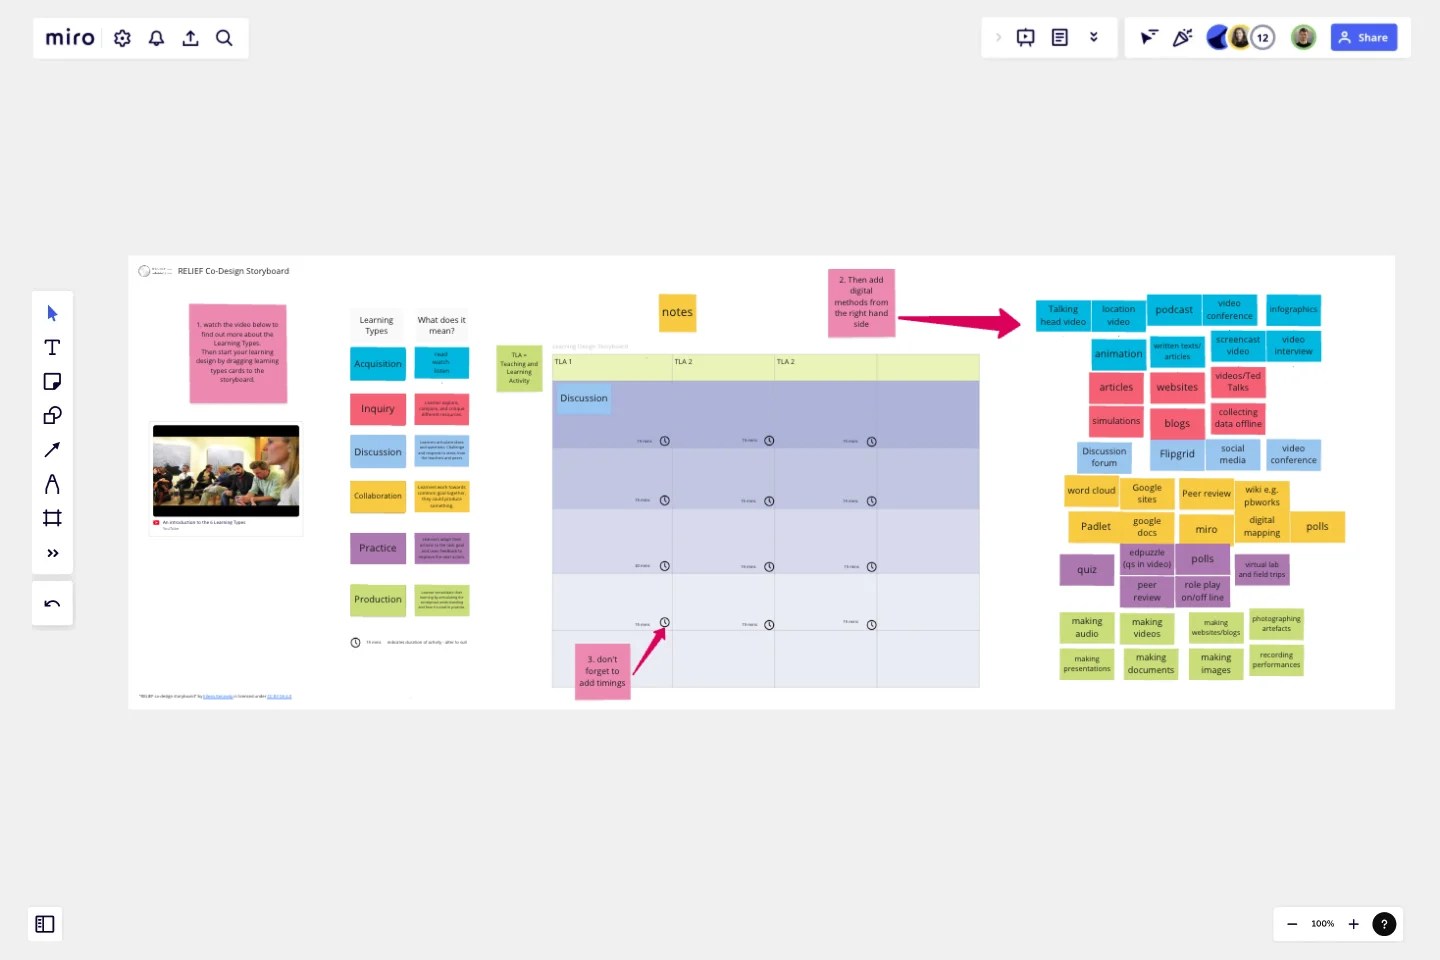
This board helps support the first stage of idea generation for co-designing online or blended courses.
The storyboard is composed of learning types cards, digital methods cards and an expandable grid featuring 3 sets of TLAs or Teaching and Learning Activities. The learning types derive from the Learning Designer tool which is based on Laurillard's Conversational Framework - a model of what it takes to teach and learn.
You can introduce a team to the six learning types using the embedded video and then work through 3 steps to create initial ideas for online or blended courses using the storyboard:
Step 1: start your learning design by dragging learning types cards to the storyboard to represent the learning experiences you want to combine to create your online/blended Teaching and Learning Activities.
Step 2: drag digital methods that correspond to the learning type (identifiable by colour) to the storyboard.
Step 3: adjust the timings (set by default at 15 minutes for each activity).
This is a light touch approach to learning design suitable for the initial ideas stage. After this stage it is recommended to transfer these initial ideas to the Learning Designer tool (learningdesigner.org) to develop the design.
This template was created by Eileen Kennedy.
Get started with this template right now.
Design Review Template
Works best for:
Design
Constructive feedback is a valuable skill. The Design Review Template provides a structured approach for effective conversations. Critiques promote collaboration and drive improvement, inspiring all participants. It's an accessible way to involve people beyond your core team.
The Ultimate Storyboarding Template
Works best for:
Storyboard, Design, Planning
Elevate your storyboarding with The Ultimate Storyboarding Template. Designed for ultimate flexibility and detail, this template supports a wide range of projects, from films to product launches. It includes sections for scene breakdowns, character arcs, and visual elements, making it ideal for comprehensive storytelling. Use it to create detailed, engaging storyboards that communicate your vision clearly and effectively to your team and stakeholders.
Storyboard for User Experience Template
Works best for:
Storyboard
The Storyboard for User Experience template helps design seamless, user-friendly journeys. It maps out scenarios, actions, thoughts, and emotions to create a cohesive user experience. This template is perfect for UX designers, product teams, and developers aiming to enhance usability, reduce friction, and improve user satisfaction. Visualize interactions, identify pain points, and iterate designs for a more intuitive and engaging experience.
Rose Thorn Bud Template
The Rose Thorn Bud Template offers a color-coded approach to examining data and structuring problems. The team is instructed to approach each situation thoroughly, methodically, and analytically. They are motivated to identify a positive experience (pink), a negative experience (purple), and a promising goal or insight (green). Identifying Roses, Thorns, and Buds helps in gaining a better understanding of one's challenges.
Storyboard for Video Production Template
Works best for:
Storyboard
The Storyboard for Video Production template is your go-to tool for planning every shot of your video project. Outline scenes, dialogues, camera angles, and visual elements to create a coherent narrative. Perfect for filmmakers, educators, or content creators, this template ensures that every aspect of your video aligns with your creative vision, streamlining production and enhancing the overall quality and impact of your project.
Empathy Map by Invoke
Works best for:
Market Research, Research & Design
The Empathy Map template is perfect for understanding user behavior and motivations. It helps teams capture insights into what users think, feel, and do, ensuring your designs meet their needs. Ideal for UX and product teams.
