Cloudflare RAG Architecture Knowledge Queries Template
Use the Cloudflare RAG Architecture Knowledge Queries Template to simplify the complex process of diagramming architectures. Promote better collaboration among team members, significantly improve documentation quality, and optimize decision-making processes.
Available on Enterprise, Business, Education plans.
About the Cloudflare RAG Architecture Knowledge Queries Template
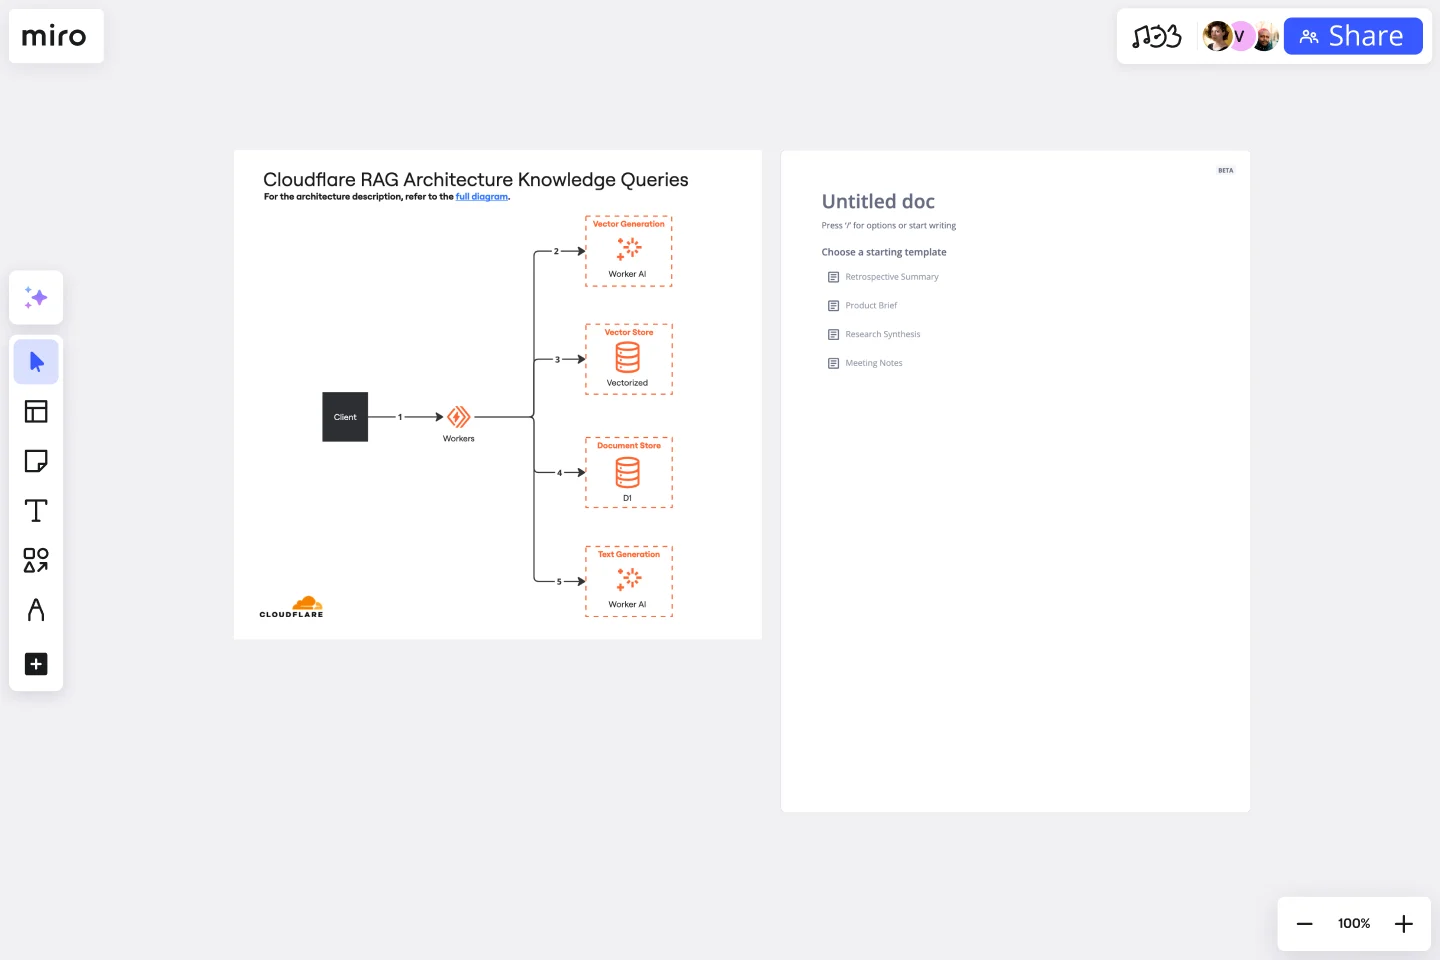
The Cloudflare RAG Architecture Knowledge Queries template is a tool designed for diagramming and understanding the complex architecture of Cloudflare's Retrieval Augmented Generation (RAG) system. This template helps in visualizing and querying architectural knowledge, making it easier for teams to collaborate on and optimize Cloudflare's infrastructure.
How to use the Cloudflare RAG Architecture Knowledge Queries Template in Miro
Customize your template: The template comes blank, allowing you to start diagramming your Cloudflare RAG architecture. Use the shape tool on the toolbar and click "All shapes." The Diagramming panel will open on the left-hand side, where you can manage and add necessary shapes to your board.
Collaborate and share: Invite team members to collaborate on the board. You can share insights, leave comments, and make real-time edits together.
Save and export: Once your architecture is fully diagrammed, save your board for future reference. You can also export it for presentations or documentation purposes.
Why use the Cloudflare RAG Architecture Knowledge Queries Template
The Cloudflare RAG Architecture Knowledge Queries template is invaluable for teams working with Cloudflare's RAG system. It simplifies the process of diagramming complex architectures, making it easier to visualize, analyze, and communicate about the system's structure and components. By using this template, teams can:
Enhance collaboration: Facilitate better communication and understanding among team members, regardless of their location.
Improve documentation: Create clear and detailed diagrams that serve as valuable documentation for the architecture.
Optimize decision-making: Visualize the architecture to identify potential improvements or optimizations in the system.
This template is designed to be flexible and user-friendly, accommodating the needs of both technical and non-technical team members.
Get started with this template right now. Available on Enterprise, Business, Education plans.
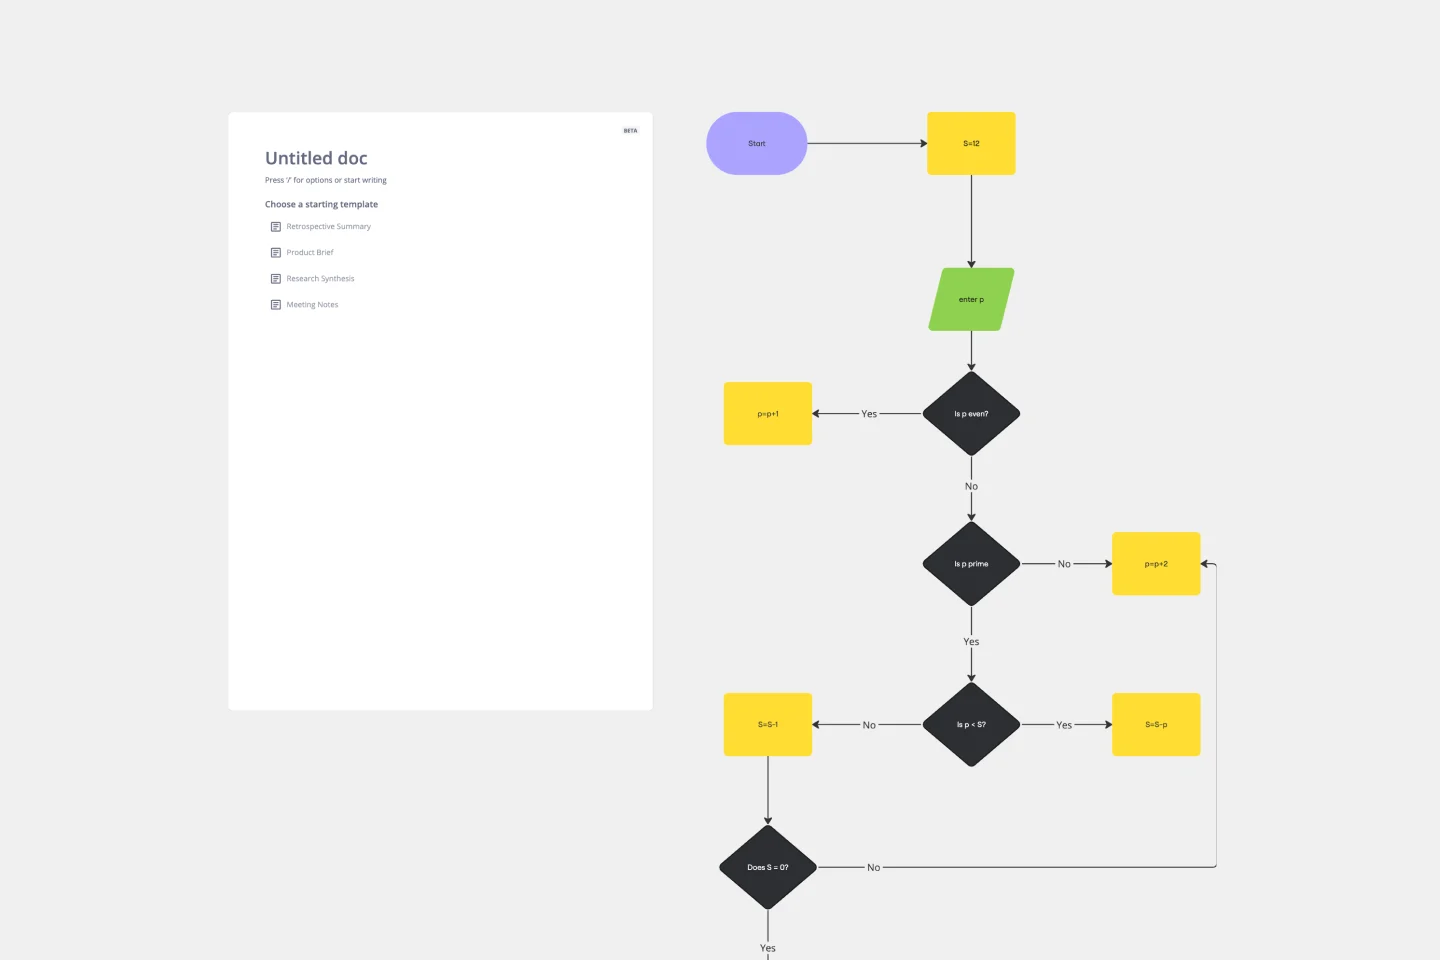
Algorithm Flowchart Template
Works best for:
Flowcharts
The Algorithm Flowchart Template is a useful tool for simplifying the process of creating and understanding complex algorithms. Its pre-structured format makes it easy to lay out each operation and decision point in a clear and easily understandable visual format. This is particularly helpful for explaining intricate processes to team members who may not be as technically proficient in the subject matter. With each step clearly defined within its designated shape, the flowchart promotes clarity and makes it easy to identify the logical flow at a glance. This clarity is the template's most significant advantage, reducing cognitive load and enabling a more inclusive and straightforward approach to discussing and refining algorithmic solutions.
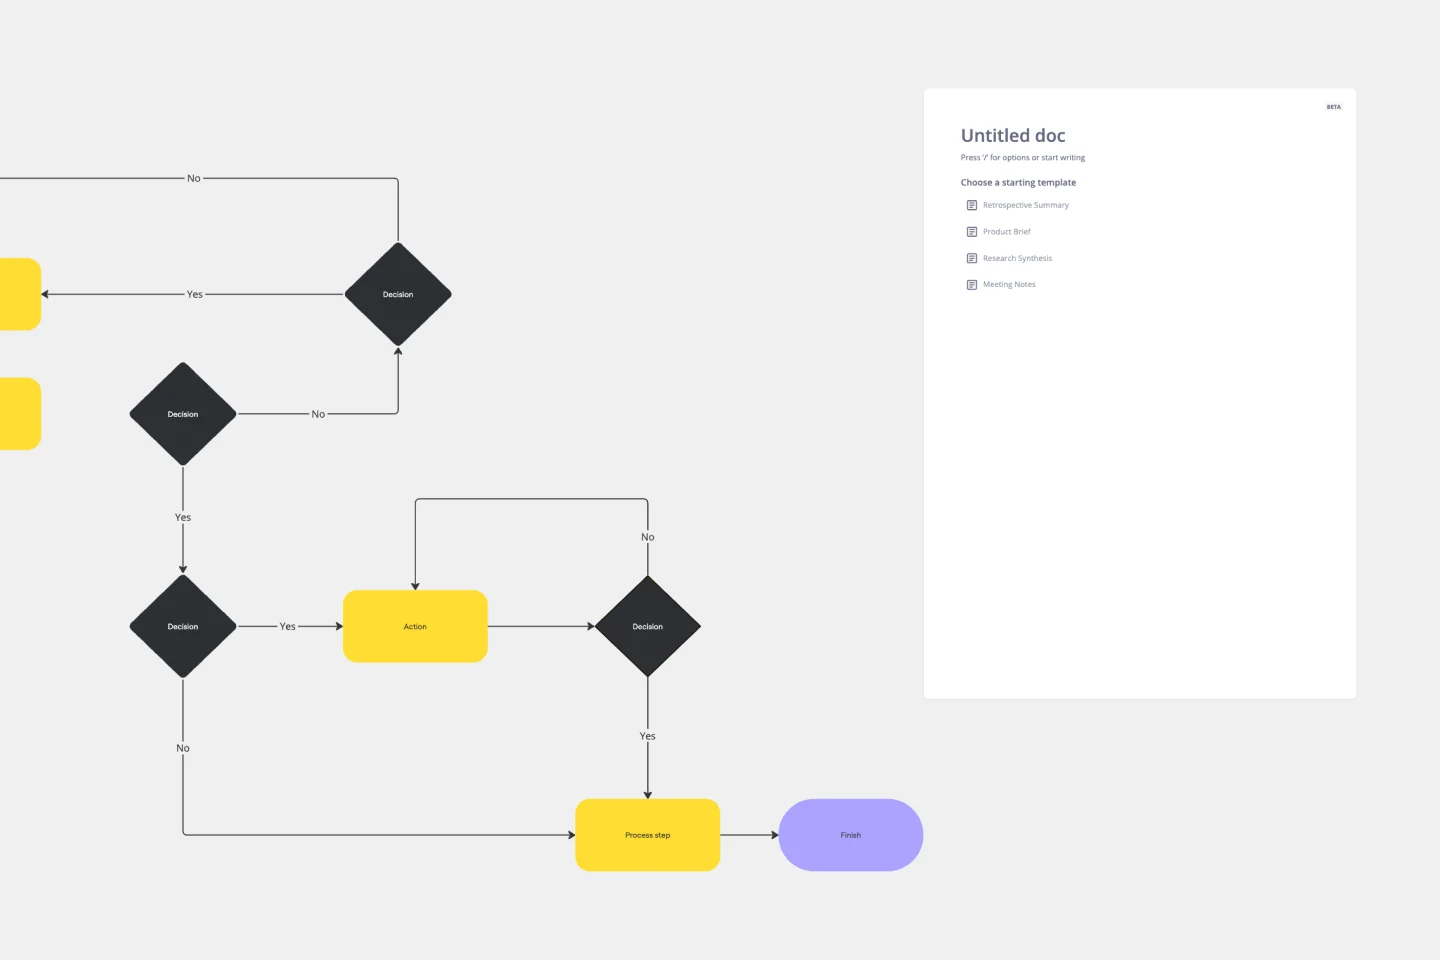
Production Flowchart Template
Works best for:
Flowcharts
The Production Flowchart Template is a well-crafted tool that clearly represents a production process from start to finish. It breaks down complex procedures into easy-to-understand segments, making it easier for stakeholders to grasp the entire process. One of the key benefits of using this template is that it helps to clarify complex production pathways. By mapping out operations visually, teams can identify potential bottlenecks or inefficiencies, facilitating timely and well-informed decision-making.
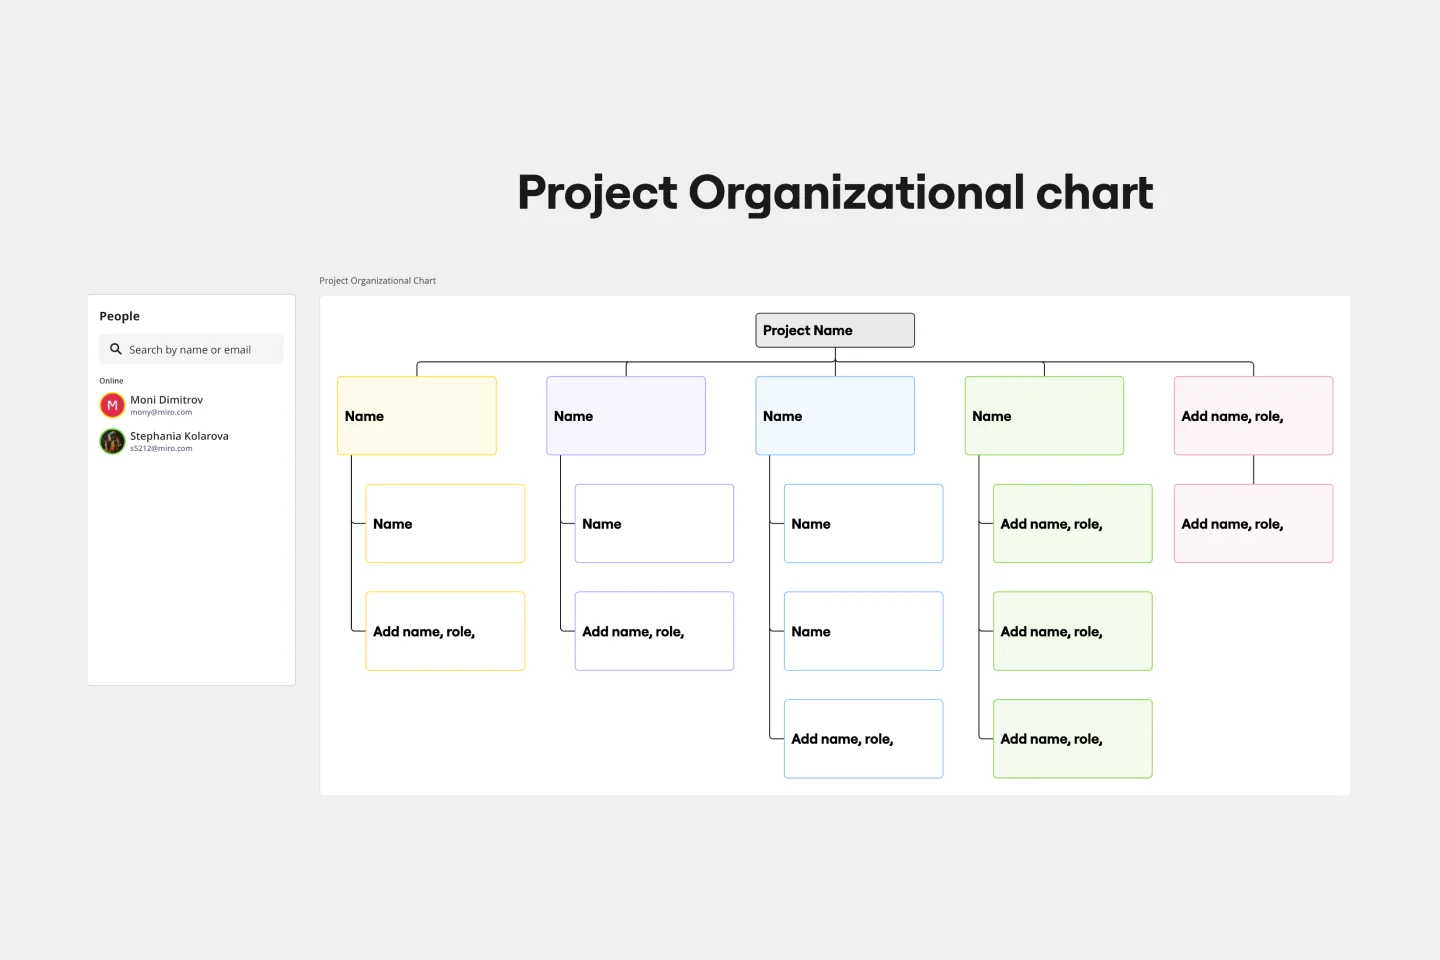
Project Organizational Chart Template
Works best for:
Project Management, Documentation, Org Charts
When you’re embarking on a long, complex project, you will inevitably hit roadblocks and obstacles. It’s important to have your project organizational chart on hand to overcome those challenges. A project organizational chart is a visual diagram that illustrates who is on your team and the role they play in a given project. It documents the structure of the project organization, the hierarchy between team members, and the relationships between employees. Project organizational charts are useful tools for clarifying who does what, securing buy-in, and setting expectations for the group.
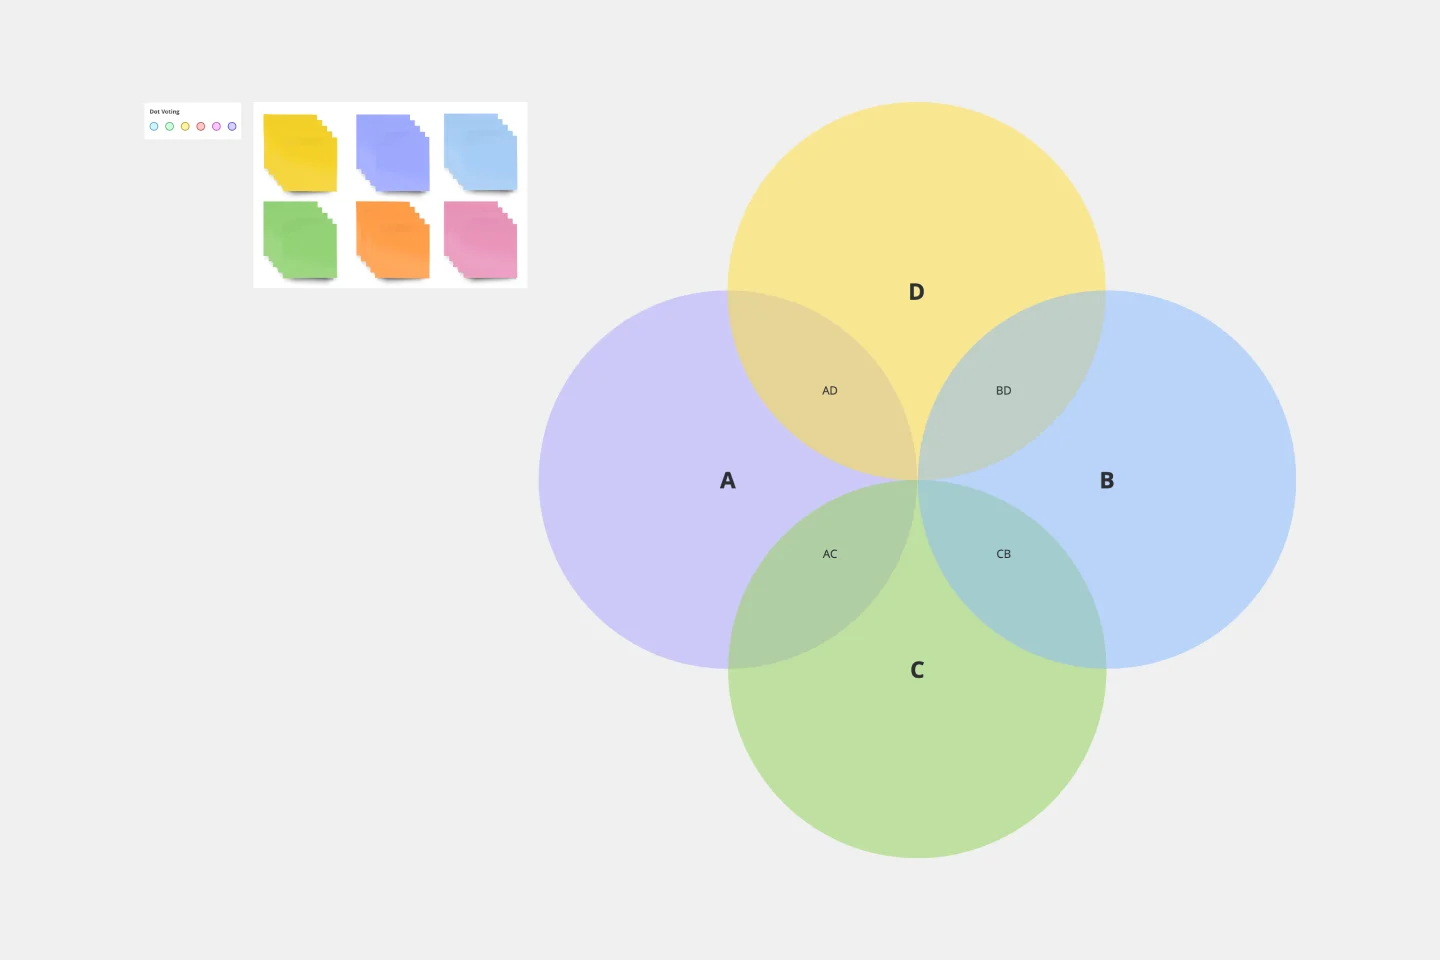
4-Circle Venn Diagram Template
Works best for:
Diagramming, Mapping, Brainstorming
The 4-Circle Venn Diagram Template has an easy, interactive, and dynamic way to visualize complex relationships between data sets. Empower your team's collaboration and communication with this powerful tool.
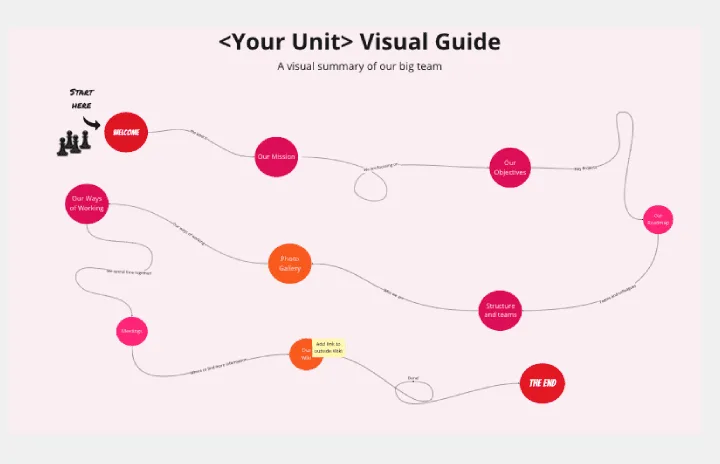
Org Unit Visual Guide
Works best for:
Org Charts, Operations, Mapping
Org Unit Visual Guide template offers a visual reference for understanding organizational units and their relationships. By mapping out departments, teams, and reporting lines, this template enhances clarity and transparency. With customizable features for adding annotations and descriptions, this template facilitates communication and alignment across organizational units.
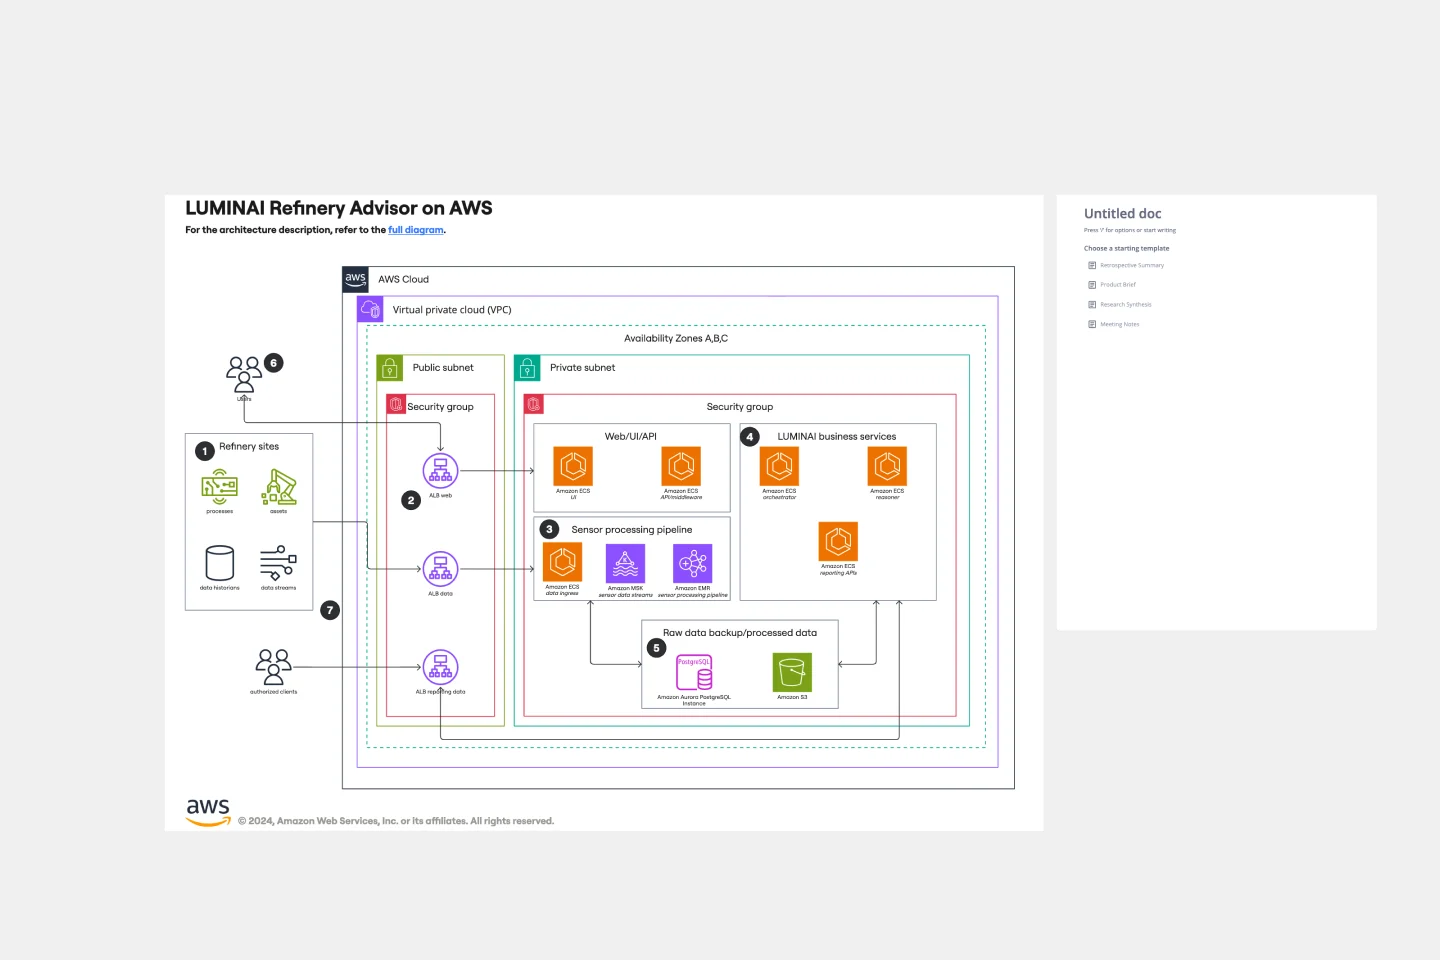
LUMINAI Refinery Advisor on AWS Template
Works best for:
AWS
The LUMINAI Refinery Advisor on AWS template streamlines and optimizes refinery operations through AWS. It provides a structured approach to setting up and managing AWS services, tailored specifically for engineers, developers, and data scientists in the refinery sector. This template not only saves time and effort by offering a predefined structure and best practices but also allows for customization to meet specific operational needs. With its focus on enhancing data processing capabilities, the LUMINAI Refinery Advisor on AWS template is an invaluable resource for improving the efficiency, effectiveness, and optimization of refinery processes on the AWS platform.