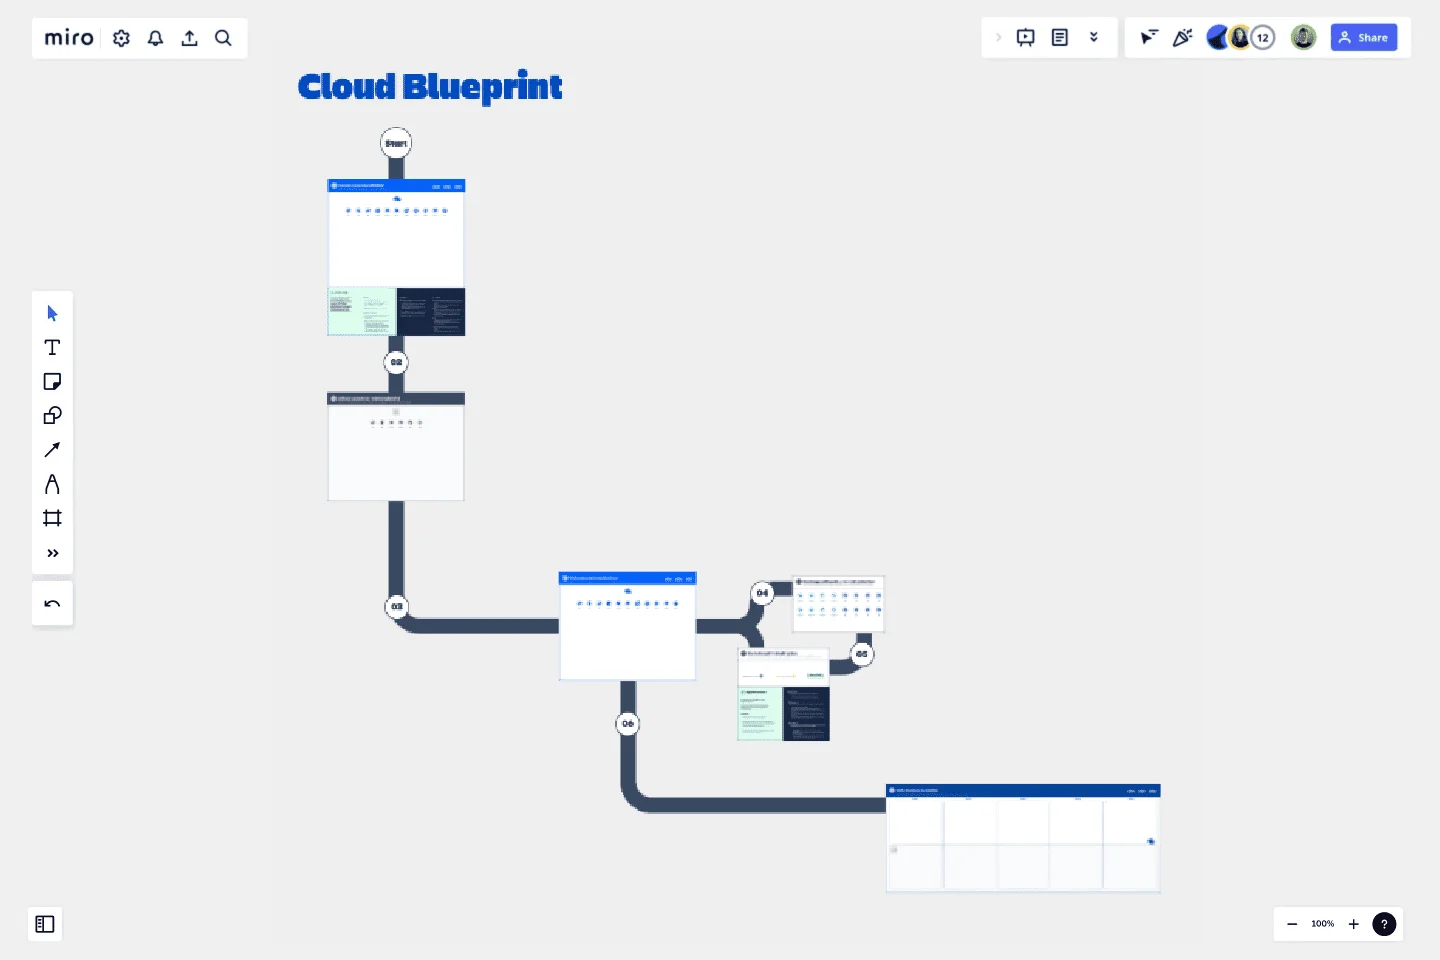
Cloud Blueprint
Make the journey to cloud more than just a copy and paste, and instead take the opportunity for a transformation.
Why create a blueprint?
A blueprint helps you explain where you've come from and where you are going into the future with Atlassian Cloud. Most importantly, it helps you find your narrative on why and how to make the move. Done early in your Cloud migration planning, this can help you confidently decide exactly what will migrate, from where to where, who and when.
It is especially useful if you feel that your current setup is not optimised and need to investigate the value unlocked by transformation.
Who to invite to run the workshop?
It's import to run this with a well rounded crew of stakeholders, such as system administrators, project leads, end users and business strategy and operations experts who can contribute to designing your future state in cloud. You want to assemble a team that will embrace the pros and cons of different cloud architectures, so that you arrive at the right design.
At the end of this workshop you’ll produce what is known in the industry as a tenant map, which visualises your migration paths.
How to use the blueprint?
Key steps:
Determine your dream state in Cloud - How will you organise your teams in Cloud that best supports your future way of working?
Audit what you have on Server - How are your teams organised today on Server?
Bring your present and future state ideas onto the one map
Don’t forget apps and integrations attached to your core data and how they will move
Map where you data will more from and to, and at what rate of change (all at once, by cohort or by start fresh).
Convert your tenant map into a Project timeline
Detailed instructions are provided on the Mire board itself when you use this template. Also, check out the demo video below!
Presto - you’ve got a strategic plan for your move to Cloud!
Designing the right tenant map may take multiple rounds and is best done iteratively, in consultation with the wider business. Plan for a series of 1-2hr workshops.
This template was created by Jason Wong.
Get started with this template right now.
Causal Loop Diagrams (1.0)
Works best for:
Diagramming
The Causal Loop Diagrams (1.0) template offers a visual tool for modeling complex systems and understanding the feedback loops that drive behavior. It provides a structured framework for identifying causal relationships, reinforcing loops, and balancing feedback within a system. This template enables teams to analyze system dynamics, anticipate unintended consequences, and formulate effective strategies for intervention. By promoting systems thinking and understanding of interdependencies, Causal Loop Diagrams empower organizations to navigate complexity and drive sustainable change.
Causal Loop Diagram Template
Works best for:
Diagramming
The Causal Loop Diagram Template offers a structured framework to visualize the intricate interconnections within any system. Its standout benefit is the ability to provide a holistic perspective, ensuring that users don't just see isolated issues but understand the entire web of relationships, ultimately leading to more informed and strategic decision-making.
Automated Security Response on AWS Template
Works best for:
AWS
The Automated Security Response on AWS template is a tool for enhancing AWS security through automation, enabling quick identification and mitigation of threats with minimal manual effort. It integrates with AWS security services for a dynamic response mechanism, ensuring infrastructure security against evolving threats. This template streamlines operational efficiency, offers scalable and customizable security strategies, and accelerates threat response times, making it essential for improving AWS security posture.
Cladogram Template
Works best for:
Diagramming
The Cladogram Template offers seamless adaptability, empowering users to change, expand, and refine evolutionary representations with ease. Its intuitive interface and automated features ensure dynamic and responsive diagrams that keep up with evolving knowledge. Say goodbye to static diagrams and welcome fluidity and adaptability with Miro's Cladogram Template.
Influence Diagram Template
Works best for:
Business Management, Decision Making, Diagrams
See the big picture of any business decision with this Influence Diagram Template. You’ll define the decision you have to make and brainstorm everything that could impact it. When you build connections between these factors, you’ll be able to put the right amount of weight into each one as you make your decision.
Driver Diagram Template
Works best for:
Diagramming
The driver diagram template is a strategic visual tool that helps teams map out their primary objectives and break them down into actionable components. It presents goals, drivers, and specific change ideas in a coherent and interconnected format, ensuring clarity of objective. By doing so, every team member is aligned towards a common endpoint, fostering unified efforts. The visual nature of the template simplifies complex objectives, making it easier for teams to stay on track and measure their progress effectively.
