Cisco Data Network Diagram Template
Cisco offers data center and access networking solutions built for scale with industry-leading automation, programmability, and real-time visibility. The Cisco Data Network Diagram uses Cisco elements to show the network design of Cisco Data Networks visually.
Available on Enterprise, Business, Education plans.
About the Cisco Data Network Diagram Template
Cisco offers data center and access networking solutions built for scale with industry-leading automation, programmability, and real-time visibility. The Cisco Data Network Diagram template can help you design and showcase the organization’s network infrastructure.
Keep reading to learn more about the Cisco Data Network Diagram Template.
What is the Cisco Data Network Diagram Template
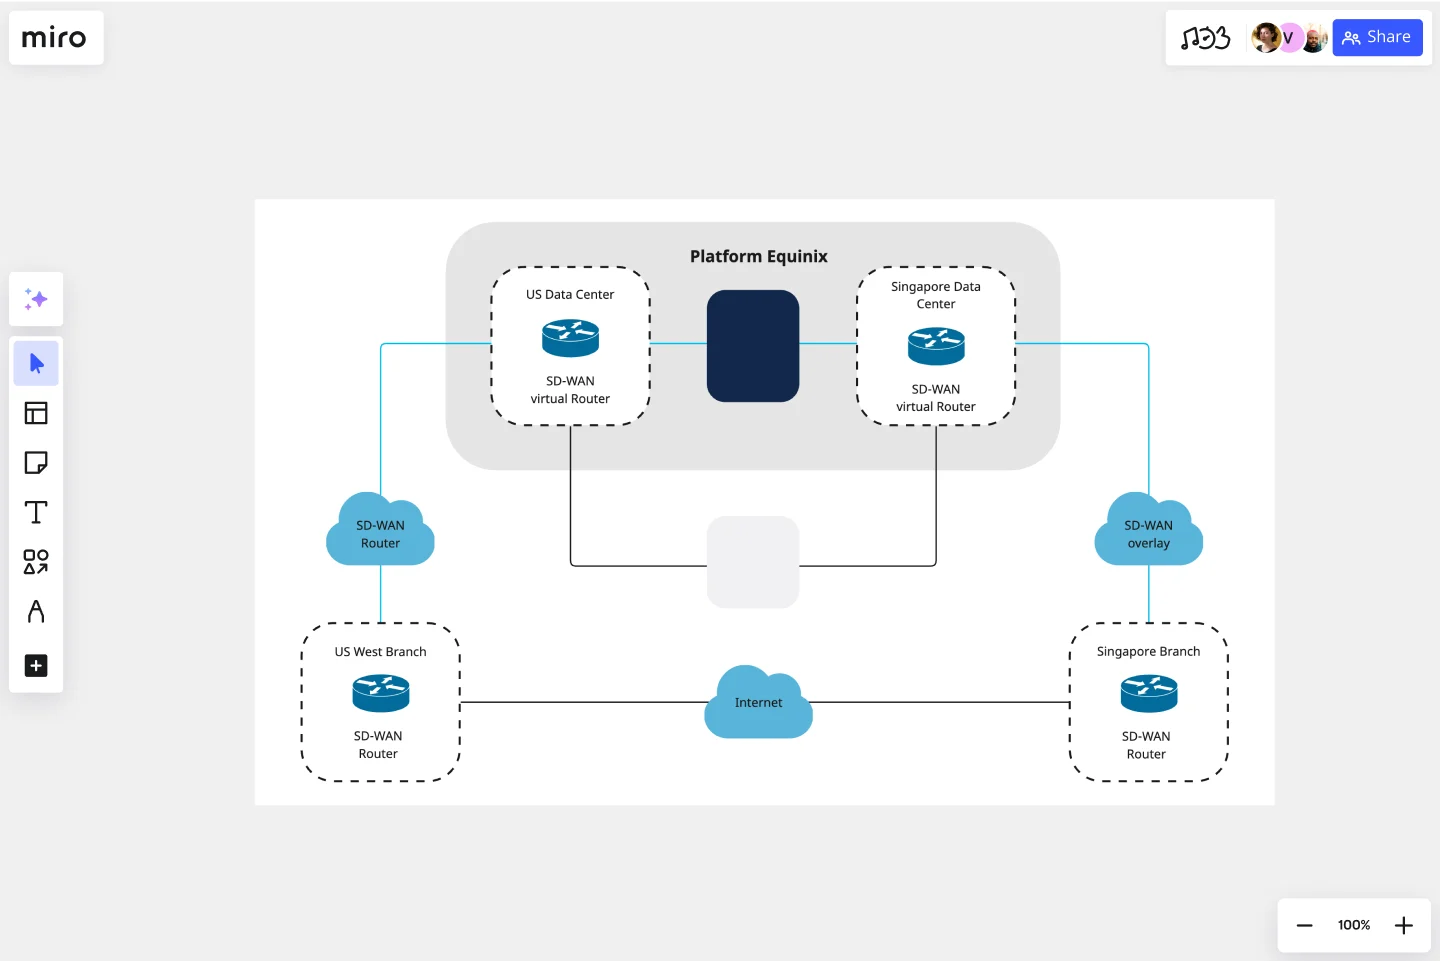
The Cisco Data Network Diagram Template, like any other diagram, visually shows the design of the network infrastructure. The Cisco Data Network Diagram has unique icons and symbols.
When to use Cisco Data Network Diagram Template
You can use the Cisco Data Network Diagram Template to visualize the telecommunication and computer network topology and layout.
Here you can find the semantics of Cisco Data Network Diagrams:
Shapes: Icons represent a Cisco service or product.
Connectors: Use arrows to indicate flows (e.g. data, information, communication). Use a single-headed arrow to indicate a single initiator. Use a double-headed arrow to indicate that the icon shown at either end of the arrow can initiate a flow.
Layout and Grouping: Groups show the connection between multiple services/products and can represent layers of the architecture.
If you'd prefer to create your online network diagram from scratch, you can also get started with Miro's diagramming tool which has several shape packs and over 2000 icons.
How do I make a Cisco Data Network Diagram Template?
To make a Cisco Data Network Diagram in Miro is easy. You can use our Cisco Data Network Diagram Template and customize it as you see fit. Once you have the diagram structure, you can start adding the icons. You can find the icons under our Cisco Icon Set integration.
Get started with this template right now. Available on Enterprise, Business, Education plans.
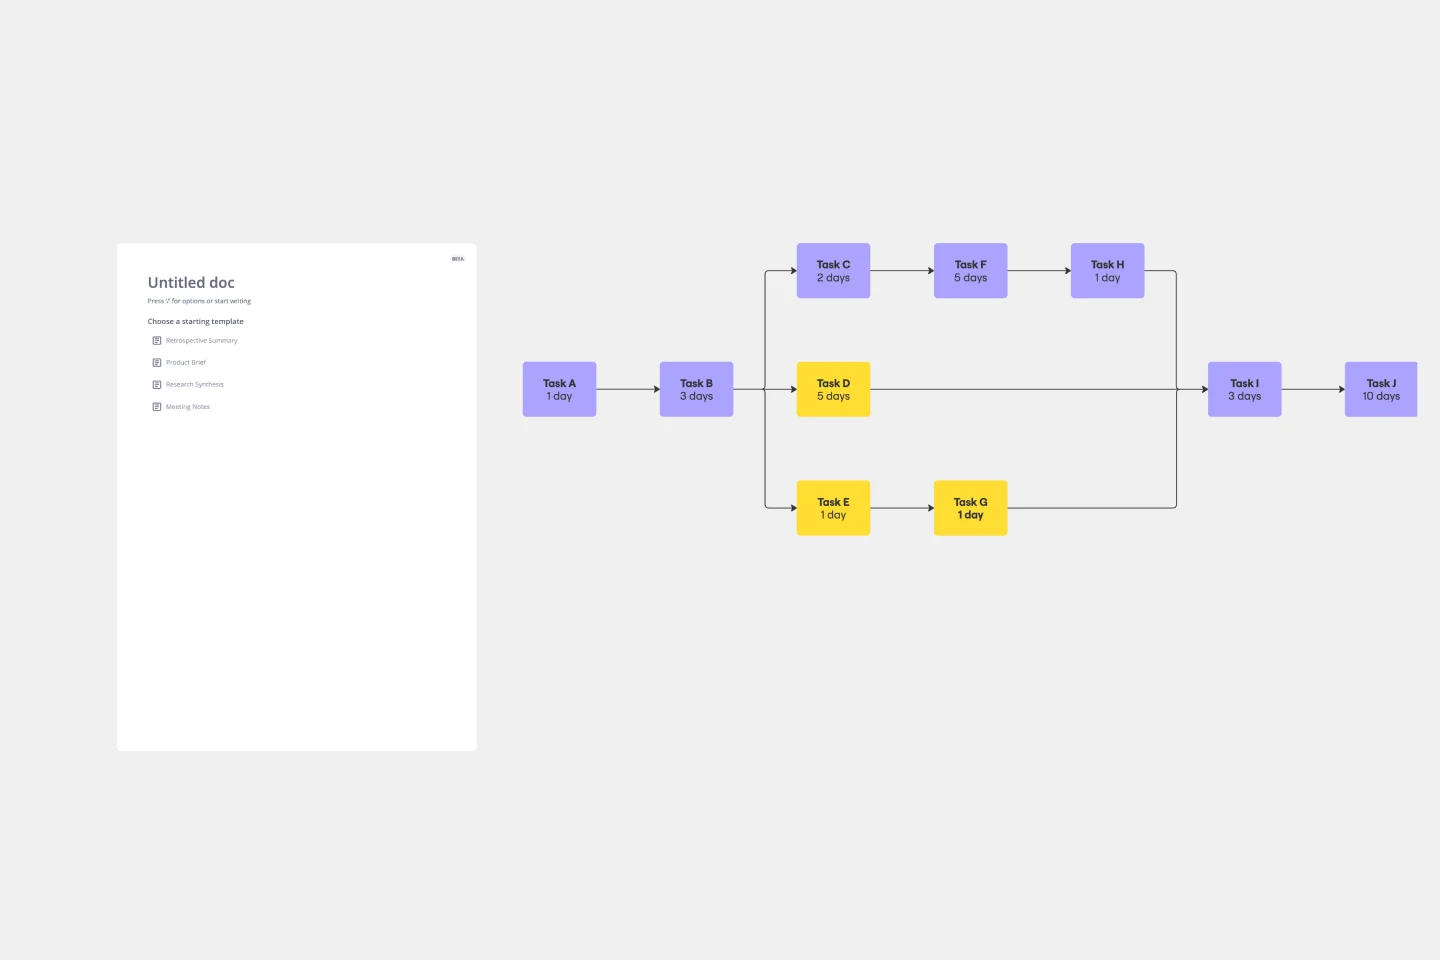
Critical Path Method Template
Works best for:
Diagramming, Project Management
Elevate your project management game with the Critical Path Method Template—an indispensable tool that brings clarity and precision to your project timelines. The template instantaneously adjusts as you edit tasks and dependencies, ensuring that your critical path is consistently up-to-date. This capability not only simplifies the complex process of project scheduling but also empowers your team to proactively respond to evolving project dynamics, fostering adaptability and efficiency throughout the project lifecycle.
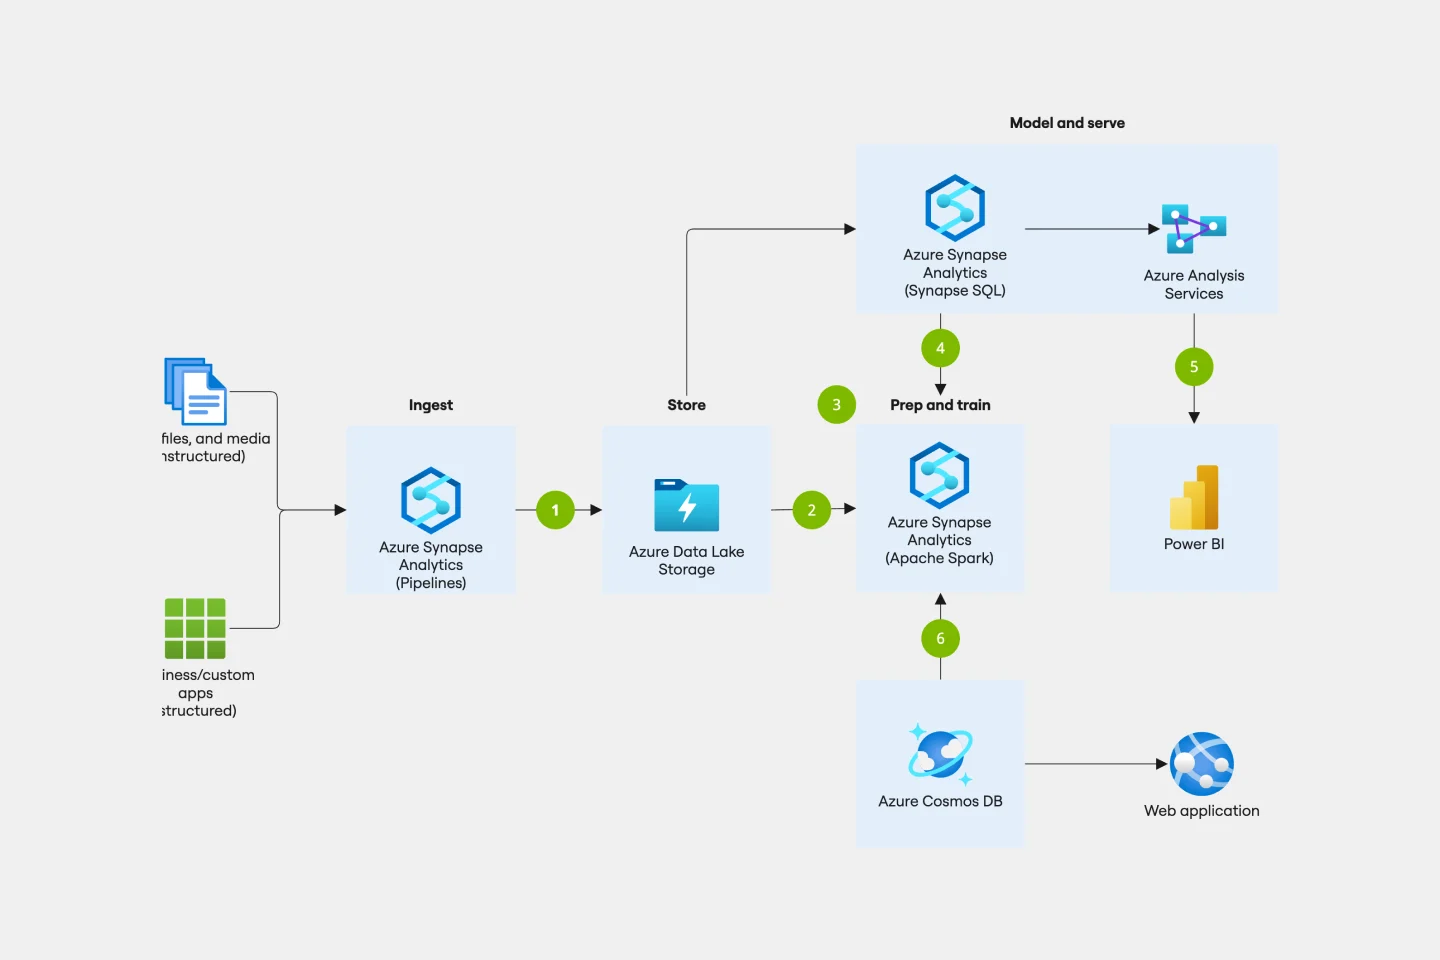
Azure Data Flow Template
Works best for:
Software Development, Diagrams
The Azure Data Flow is a diagram that will allow you to combine data and build and deploy custom machine learning models at scale. Azure is Microsoft’s cloud computing platform, designed to provide many cloud-based services like remote storage, database hosting, and centralized account management. Azure also offers new capabilities like AI and the Internet of Things (IoT).
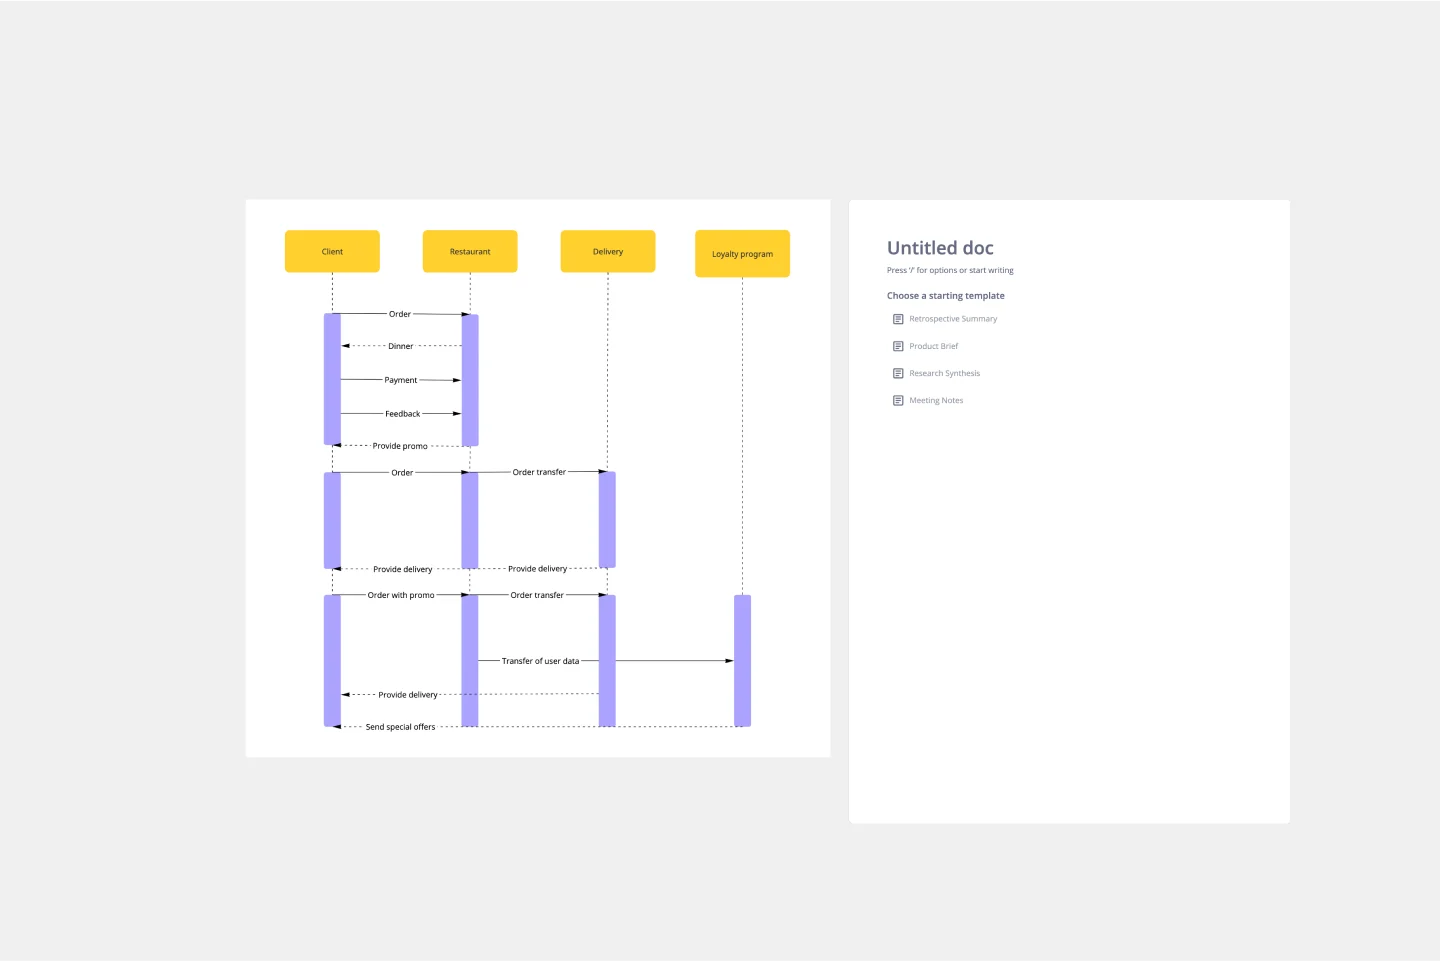
UML Sequence Diagram Template
Works best for:
Software Development, Mapping, Diagrams
Analyze and showcase how external entities interact with your system using a sequence diagram. Get a bird’s-eye view of your work processes, business functions, and customer interactions using this diagram. Also, identify any potential problems early and solve them before implementation.
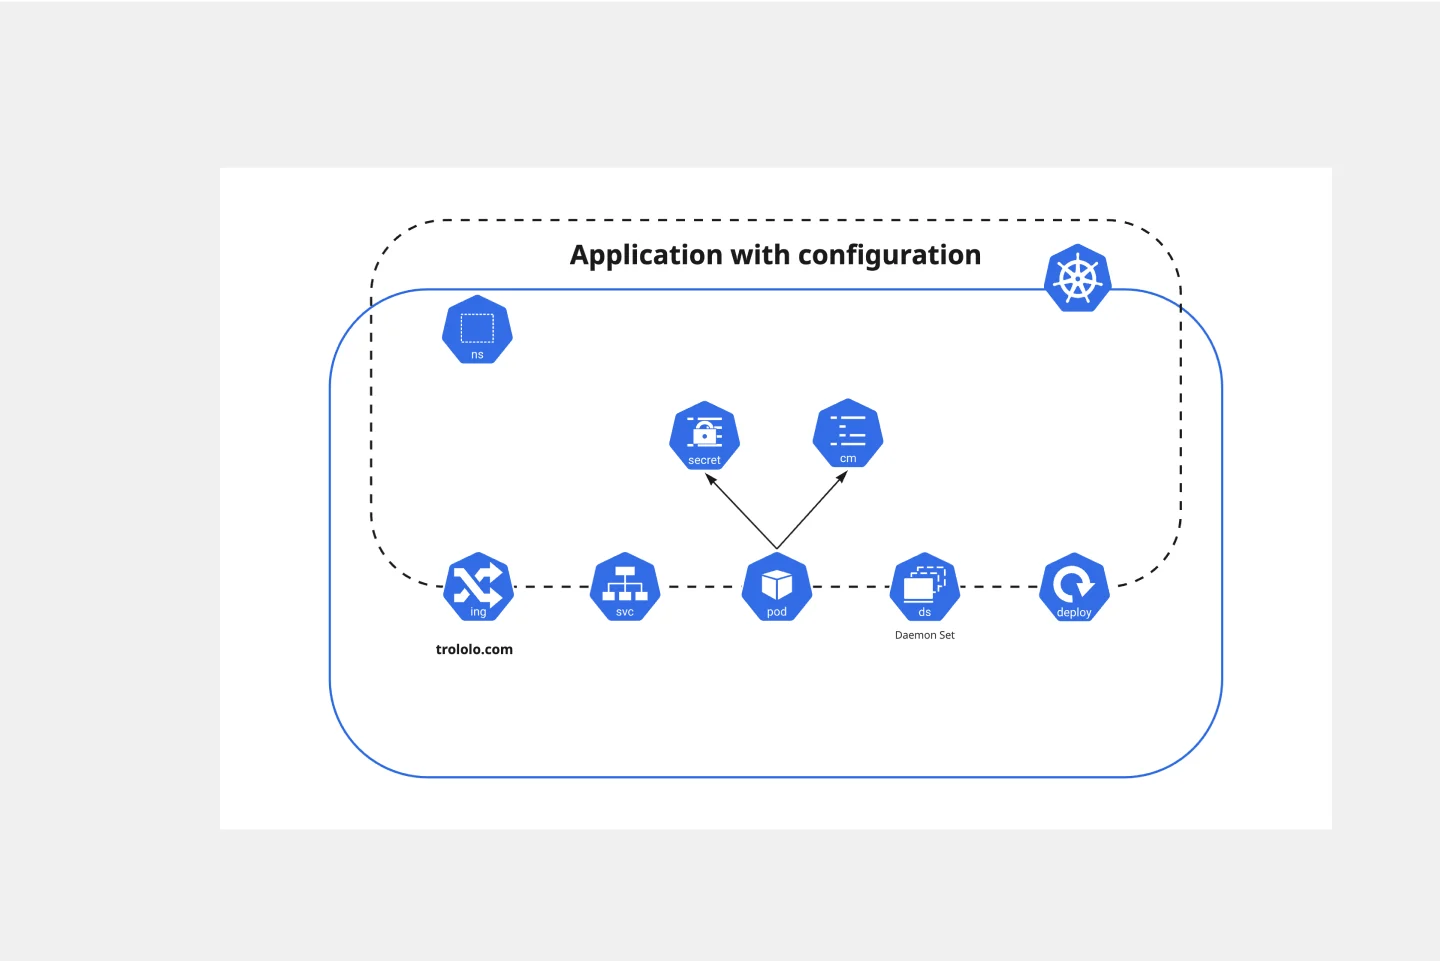
Kubernetes Application Template
Works best for:
Software Development, Diagrams
Use the Kubernetes Application template to manage enterprise-ready containerized applications better. You can now get your team more agile when dealing with portability, licensing, and consolidated billing. The Kubernetes Application template allows you to run deployments anywhere, facilitating the management of your applications. Try it out and see if it’s the best fit for you and your team.
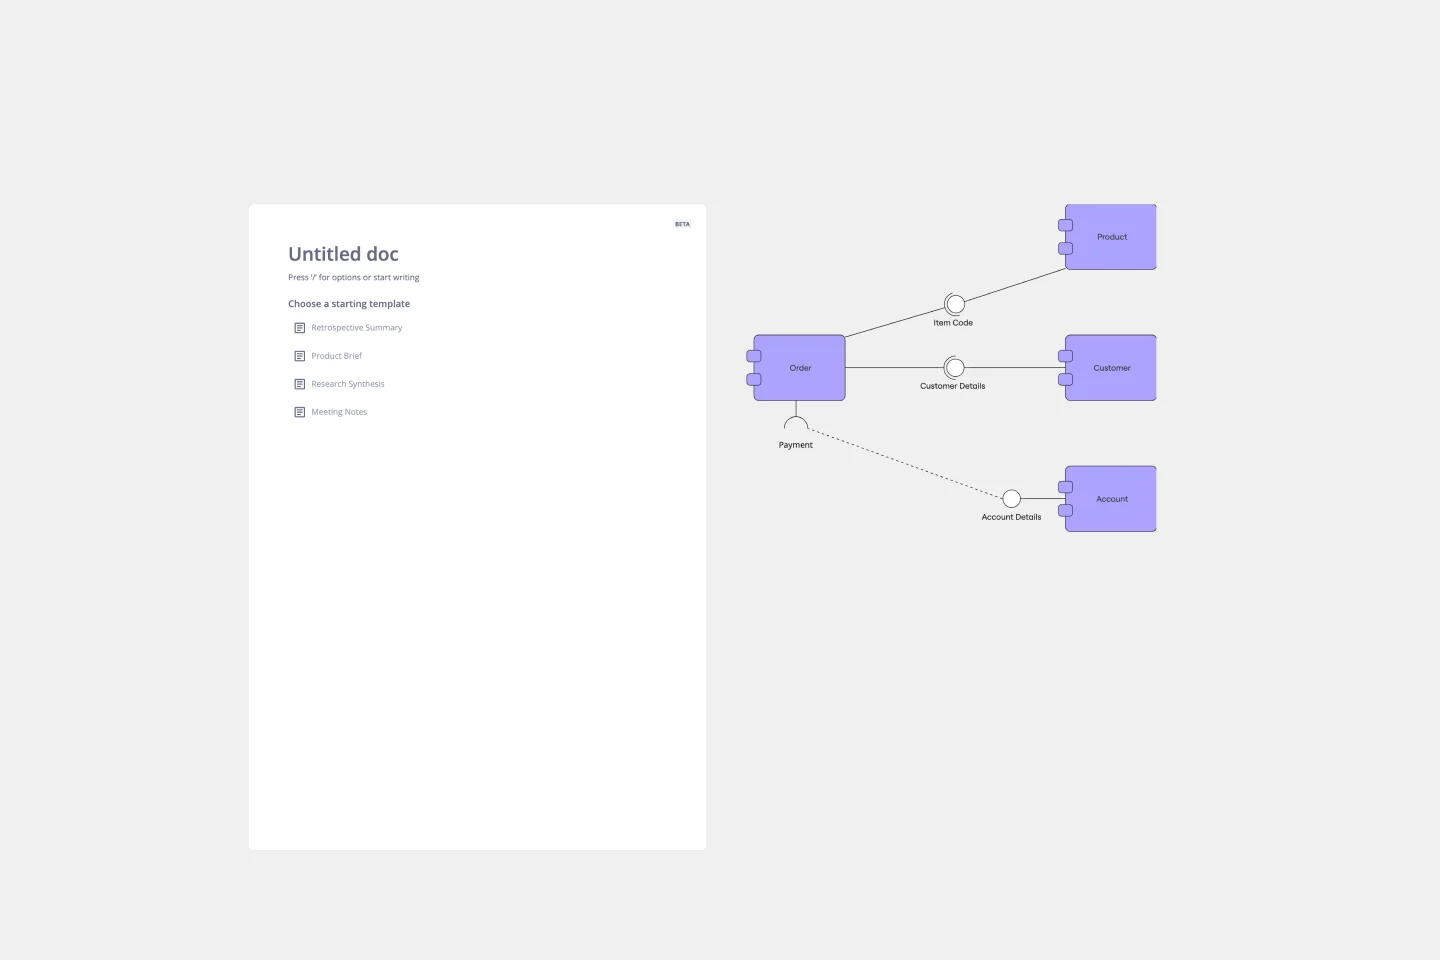
UML Component Diagram Template
Works best for:
Mapping, Diagrams, Software Development
Use our Component Diagram template to show how a system’s physical components are organized and wired together. Visualize implementation details, make sure planned development matches system needs, and more — all in a collaborative environment.
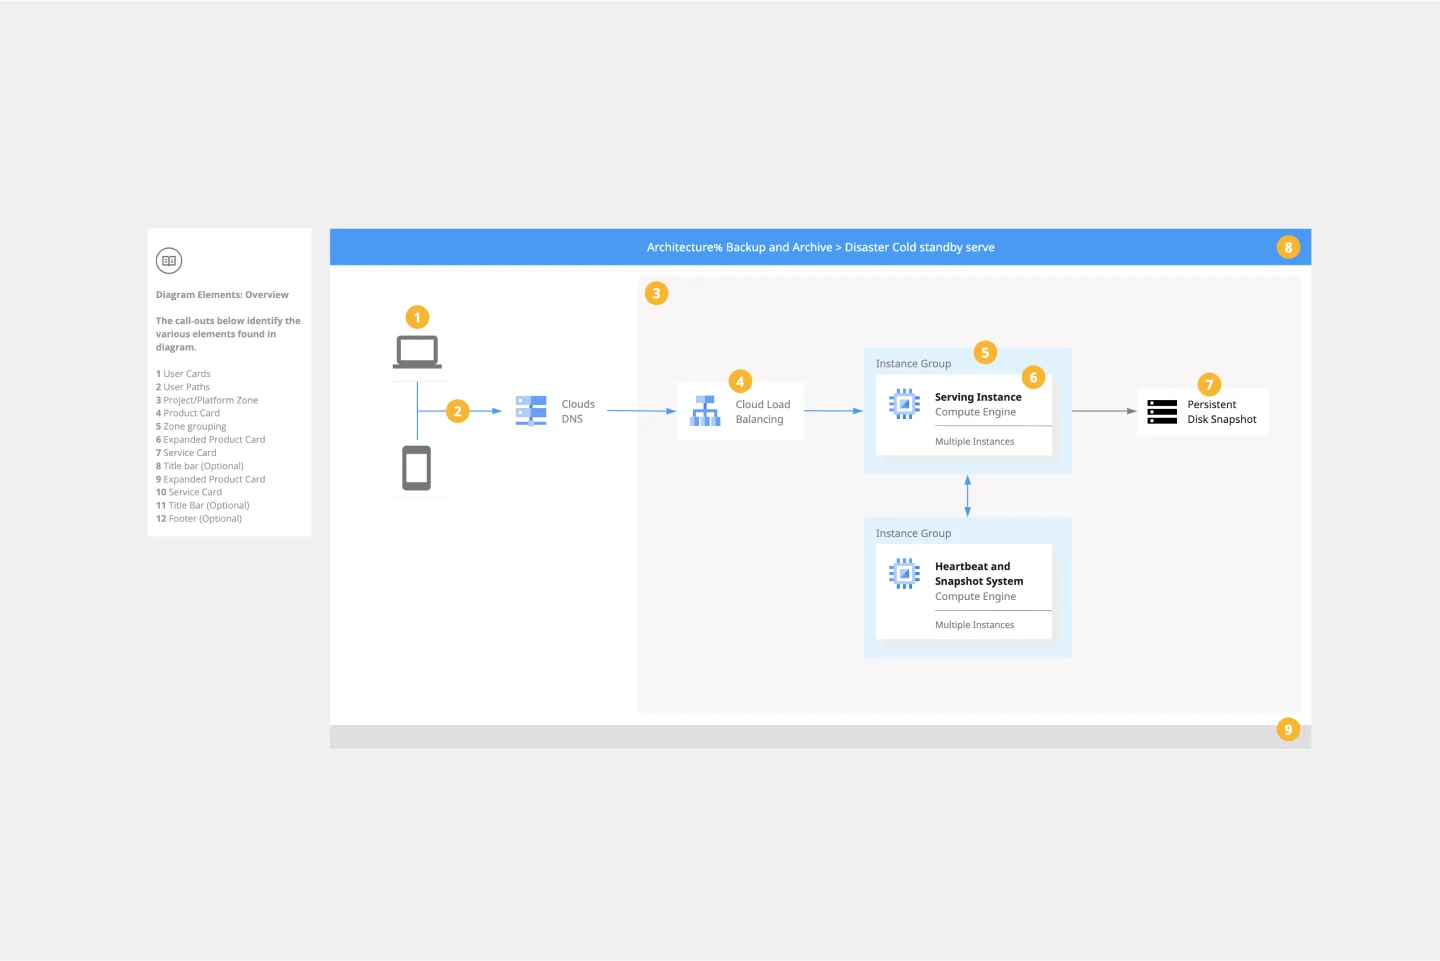
Google Cloud Architecture Diagram Template
Works best for:
Software Development, Diagrams
Use the Google Cloud Architecture Diagram template to clearly visualize the deployment of your application and allow you and your team to optimize processes. The GCP template gives you a great overview of your application architecture, and it helps you to iterate quickly and better manage your application development, deployment, and documentation. Try it out and see if it works for you.