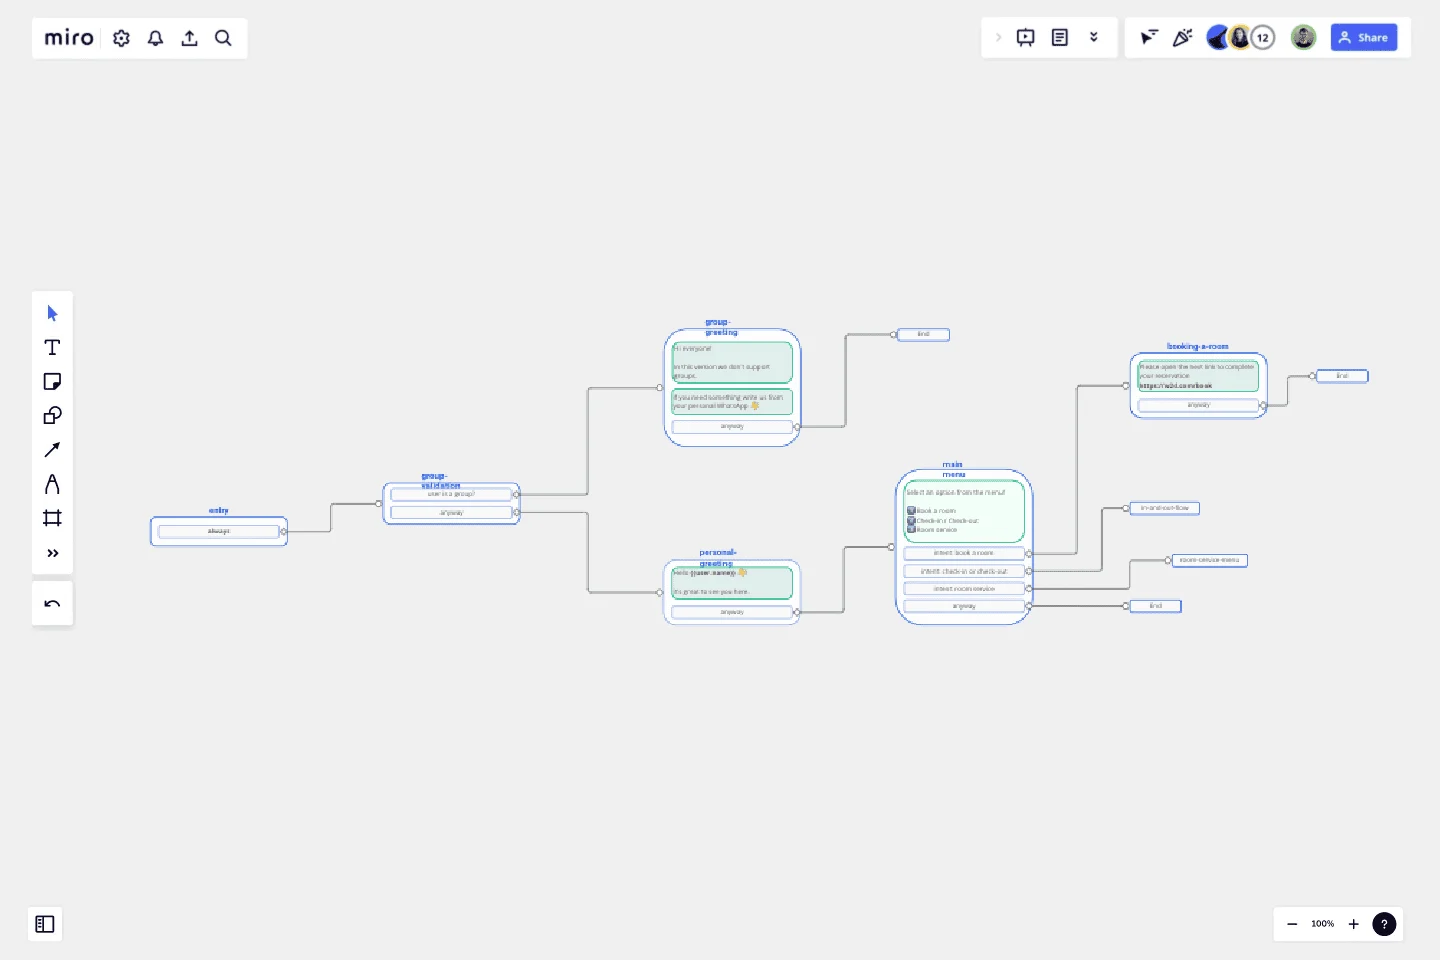
Chat-Bot
Create your own chatbot!
Here are some instructions to get you started:
Determine the purpose and scope of your chatbot: First, decide what you want your chatbot to do and what type of conversations it will have. Will it be a customer service chatbot, a personal assistant, or something else entirely? Once you have a clear idea of your chatbot's purpose, you can move on to the next step.
Design your chatbot's personality and tone: Your chatbot's personality and tone will affect how users interact with it. Decide whether you want your chatbot to be formal or casual, friendly or professional, and so on.
Create your chatbot's conversation flow: Design a conversation flow for your chatbot, outlining the various paths users can take when interacting with it. Consider what questions your chatbot will ask users and how it will respond to their answers.
Train your chatbot: Use your chosen platform to train your chatbot using natural language processing (NLP) and machine learning. This will help your chatbot understand user input and respond appropriately.
Test your chatbot: Test your chatbot with a small group of users to identify any issues or areas for improvement. Refine your chatbot's conversation flow and training as needed.
Deploy your chatbot: Once you're happy with your chatbot's performance, deploy it on your website or messaging platform. Monitor its performance and make adjustments as necessary.
That's it! By following these instructions, you should be able to create a functional chatbot that meets your needs.
Good luck!
This template was created by Kike Rios.
Get started with this template right now.
Bull's Eye Diagram Template
Works best for:
Diagrams, Project Management, Prioritization
When you’re a growing organization, every decision can feel like it has make-or-break consequences—which can lead to decision paralysis, an inability to prioritize, inefficient meetings, and even low morale. If that sounds like you, put a Bull’s Eye Diagram to work. True to its name, a Bull’s Eye Diagram uses a model of concentric circles to help companies establish priorities, make critical decisions, or discuss how to remove or overcome obstacles.
Web Diagram Template
Miro's Web Diagram Template simplifies complex project organization and promotes effective communication. It allows users to easily connect elements and gain a comprehensive understanding of complex relationships, making it a versatile and invaluable asset for diverse projects.
UML Class Diagram Template
Works best for:
UML Class Diagram Template, Mapping, Diagrams
Get a template for quickly building UML class diagrams in a collaborative environment. Use the UML class diagram template to design and refine conceptual systems, then let the same diagram guide your engineers as they write the code.
Turtle Diagram for BA
Works best for:
Diagramming
The Turtle Diagram for BA template offers a visual framework for defining and auditing business processes according to ISO 9001 standards. It provides elements for documenting process inputs, outputs, activities, and controls. This template enables organizations to ensure compliance, identify process improvements, and enhance quality management practices. By promoting systematic process documentation and auditability, the Turtle Diagram for BA empowers organizations to achieve and maintain ISO 9001 certification, demonstrating commitment to quality and continuous improvement.
Opportunity Solution Tree
Works best for:
Diagramming
The Opportunity Solution Tree template is a visual tool for identifying and prioritizing opportunities and solutions. It provides a structured framework for mapping customer needs, pain points, and potential solutions. This template enables teams to explore divergent ideas, evaluate alternatives, and focus on high-impact solutions. By promoting customer-centricity and innovation, the Opportunity Solution Tree empowers teams to address market needs effectively and deliver value-driven solutions.
2-Circle Venn Diagram Template
The 2 Circle Venn Diagram Template is a dynamic, intuitive tool designed to represent the logical relationships between two data sets visually. For teams, this template proves valuable in enabling efficient collaboration, clear communication, and shared understanding.
