Causal Loop Diagram Template
Visualize systems relationships and improve problem-solving with the causal loop diagram template.
About the Causal Loop Diagram Template
The causal loop diagram template is a robust resource designed to visualize complex interrelationships within systems. By providing an organized framework, this template enables the in-depth exploration of interactions, promoting a comprehensive understanding of systems and helping in effective problem-solving.
What's a causal loop diagram template?
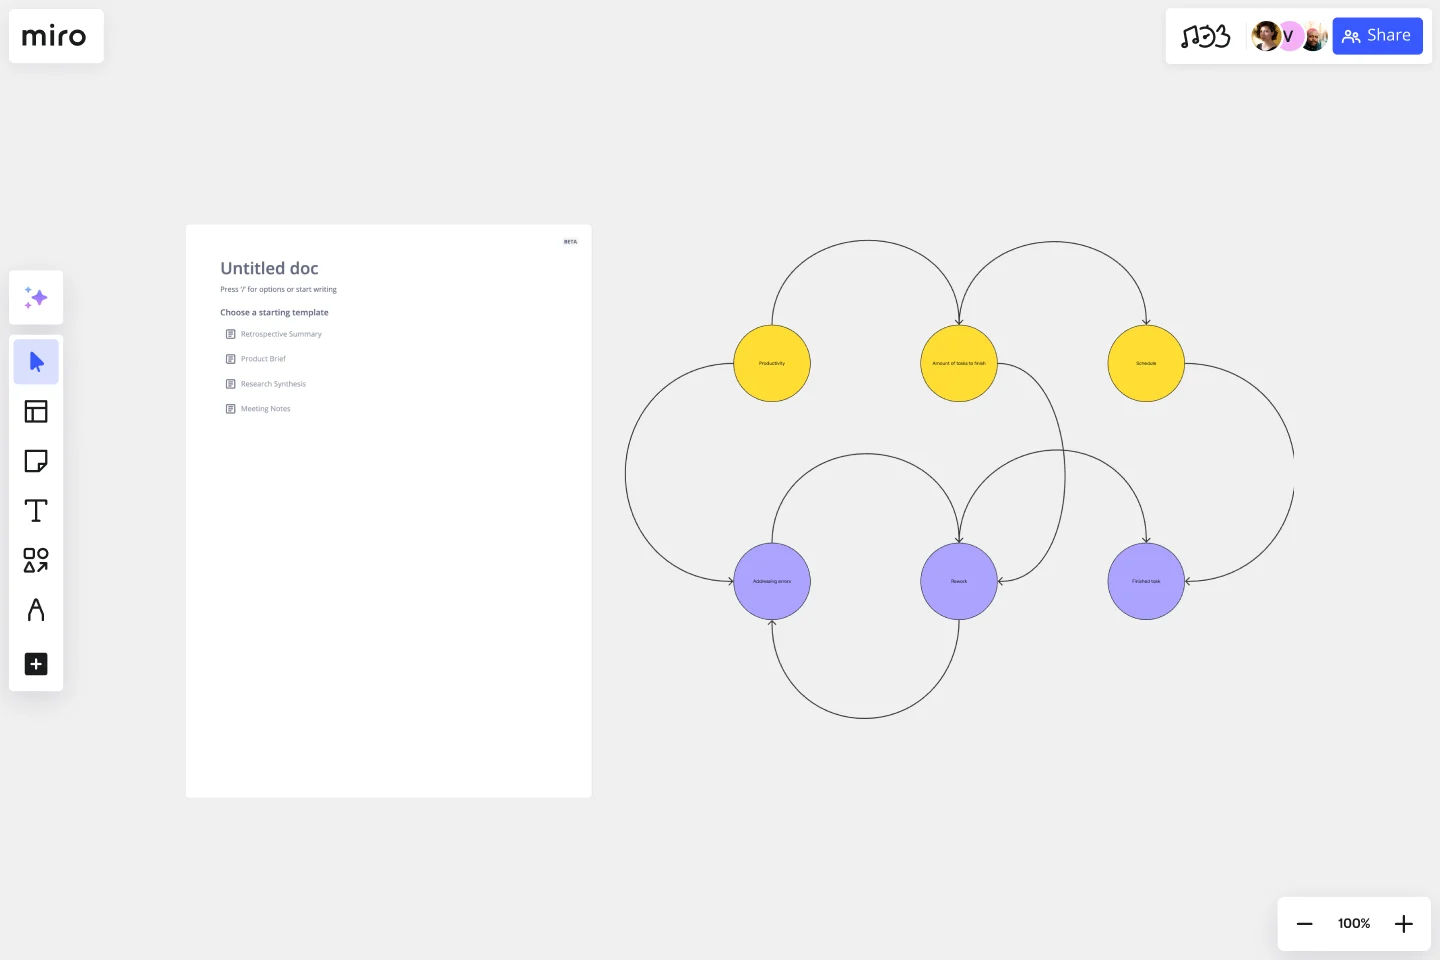
A causal loop diagram (CLD) template is a tool that showcases the system's feedback loops and cause-and-effect relationships. Instead of viewing issues in isolation, this diagram gives a holistic view of the interactions between various system components. The template provides a structured framework, enabling teams to chart out these interconnections in an organized and easy-to-understand manner.
How to use the causal loop diagram template in Miro
Miro has intuitive features, making the creation of a CLD seamless:
Shapes library: Select the feature in the toolbar. Here, you can choose different shapes representing many elements within your system.
Arrows and connections: Use arrows to depict the direction of influence between elements. Positive and negative feedback loops can be indicated using '+' and '-' signs.
Customization: Change colors, sizes, and labels to differentiate and categorize the elements as needed.
Drag and drop: Simply drag your chosen elements onto the Miro board and position them to create your causal loop diagram.
Why should you use a causal loop diagram template?
Holistic viewpoint: The template helps understand the bigger picture by visualizing a system's complex web of relationships.
Effective problem-solving: By recognizing the underlying patterns and structures, teams can address root causes instead of superficial symptoms.
Enhanced communication: A well-structured CLD fosters clarity in discussions, promoting shared understanding amongst team members.
Strategic planning: The template helps identify use points, helping in effective decision-making and strategic interventions.
Do you need more advanced diagramming capabilities? Check Miro's diagram maker features.
What is the difference between a positive and a negative feedback loop?
A positive feedback loop amplifies changes, driving the system further from its original state. A negative feedback loop stabilizes the system, pushing it back towards a desired equilibrium.
Can I collaborate in real time with my team on the CLD?
Yes, Miro's workspace supports real-time collaboration, allowing team members to edit, comment, and discuss the diagram.
How can I share my causal loop diagram with stakeholders?
Miro offers easy sharing options. You can invite stakeholders to view or edit the board directly or export the diagram as an image or PDF to share externally.
Is there a limit to the complexity of the system I can map?
While Miro offers a vast canvas, ensuring your CLD remains readable and understandable is essential. If a system is exceedingly complex, consider breaking it down into smaller sub-systems for clarity.
Get started with this template right now.
Precedence Diagram
Works best for:
Diagramming, Mapping
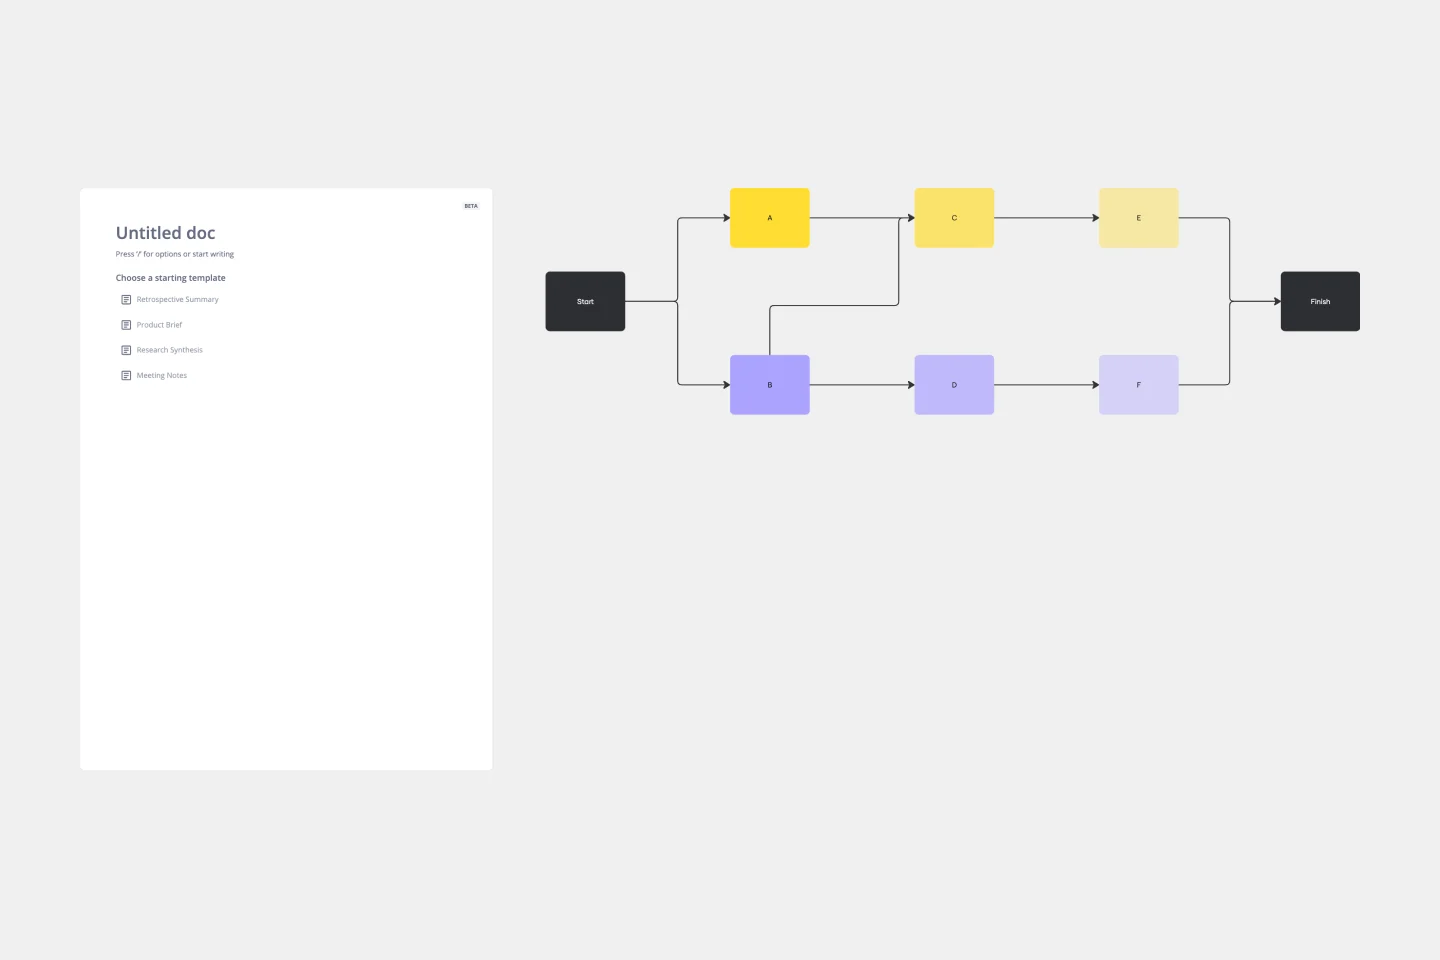
The Precedence Diagram Template offers a visual tool that maps out project activities and their interrelated sequences. This diagram empowers teams to recognize and anticipate workflow structures by illustrating the connections and dependencies among tasks.
Person Api Uml
Works best for:
Diagramming
The Person Api Uml template offers a visual framework for designing and modeling Person API structures and interactions. It provides elements for defining entities, attributes, and relationships within a Person API system. This template enables teams to visualize and communicate the structure and behavior of Person APIs, facilitating collaboration and alignment among stakeholders. By promoting clarity and consistency in API design, the Person Api Uml template empowers teams to build robust and interoperable Person API solutions.
Value Network Mapping (1.0)
The Value Network Mapping (1.0) template is a visual tool for analyzing and optimizing the relationships and interactions between stakeholders within a network. It provides a structured framework for mapping out value exchanges, dependencies, and opportunities for collaboration. This template enables teams to gain insights into the dynamics of their ecosystem, identify key actors, and align strategies for mutual benefit. By promoting transparency and collaboration, Value Network Mapping empowers organizations to enhance value creation and foster strategic partnerships.
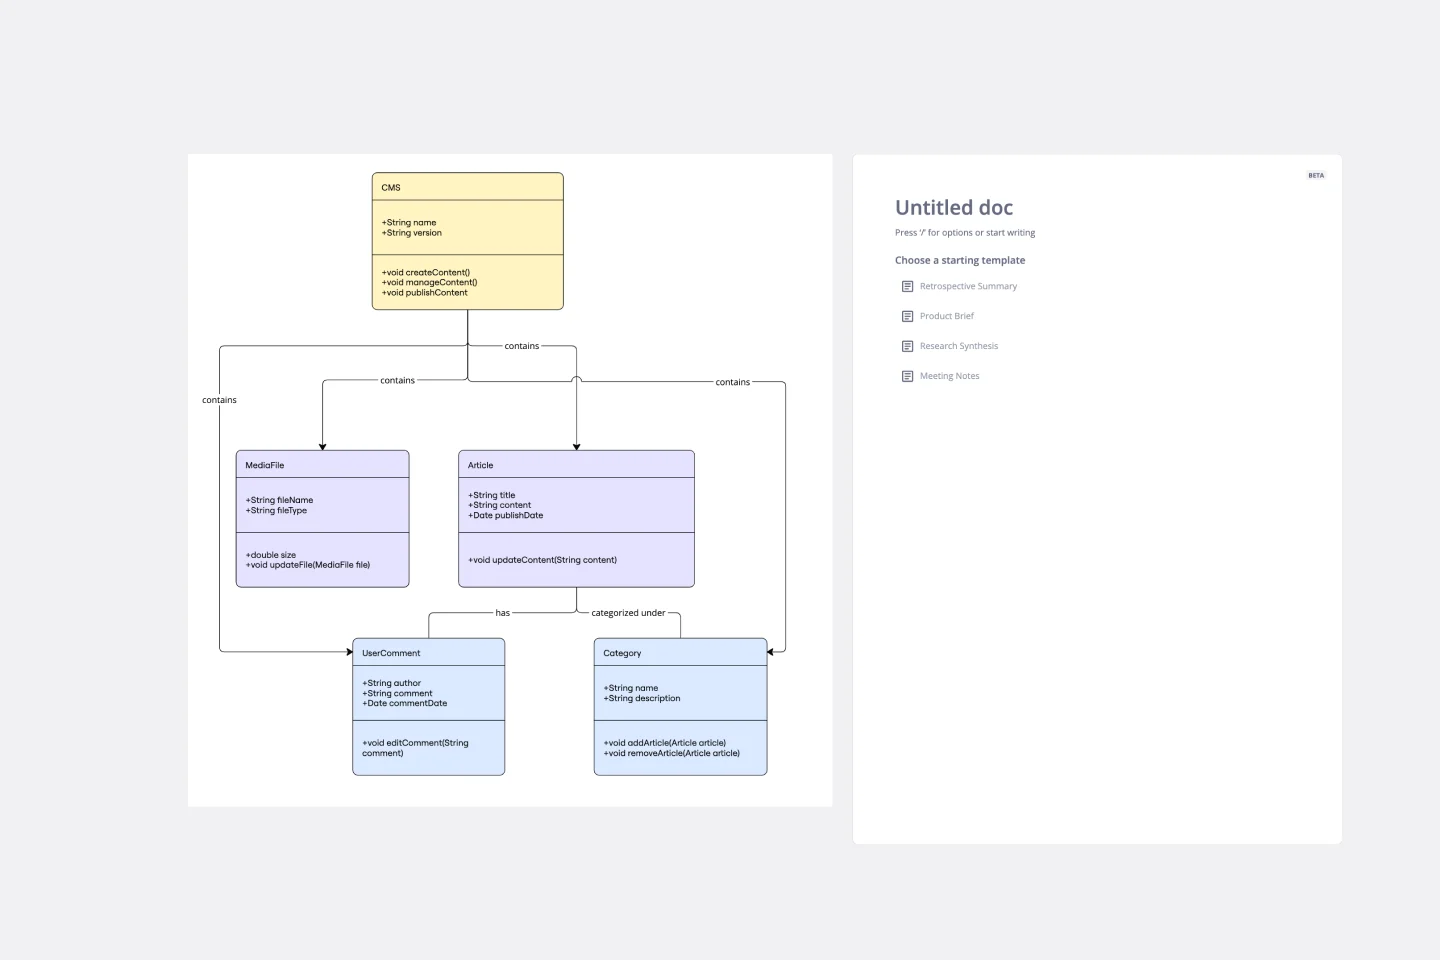
UML Class Content Management System (CMS) Template
Works best for:
UML
The UML Class Content Management System CMS Template simplifies documenting and designing the architecture of a Content Management System. It allows for the creation of UML class diagrams to visualize the structure of a CMS. Teams can efficiently map out key classes and their interactions, such as how users create, manage, and publish digital content. The template's integration into Miro's collaborative platform allows for real-time teamwork, customization, and easy sharing of feedback. This streamlines the documentation process and is valuable for software development projects aiming to develop or refine a CMS.
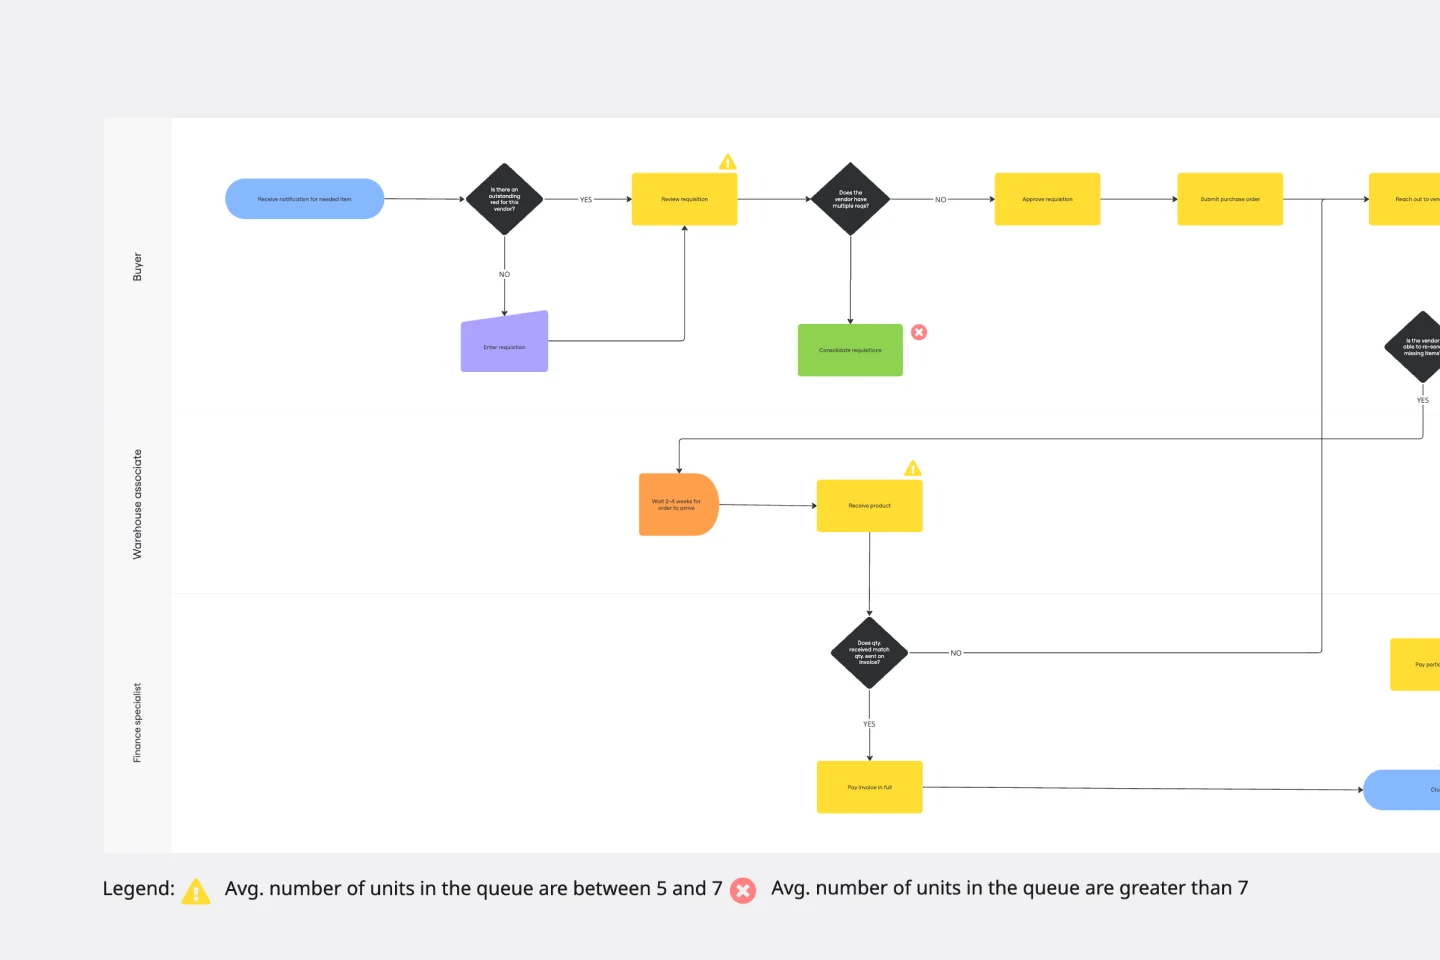
Current State vs. Future State Flowchart Template
Works best for:
Diagramming
The Current State vs Future State Flowchart Template is an essential tool for strategic planning, providing teams with a dynamic and visual roadmap for organizational transformation. One of its key benefits is streamlining collaboration by using swimlanes to allocate tasks to specific departments. This feature promotes accountability and transparent communication, ensuring everyone is aligned on their responsibilities. As a result, teams can navigate complex processes with ease, fostering a shared understanding of the current and future states, ultimately leading to efficient and collaborative decision-making.
UML State Machine Diagram Template
Works best for:
Software Development, Mapping, Diagrams
Visualize the workflow of a process and how objects perform actions based on different stimuli. State machine diagrams are valuable for understanding how an object responds to events at the different stages of its life cycle. They are also helpful for visualizing event sequences in a system.