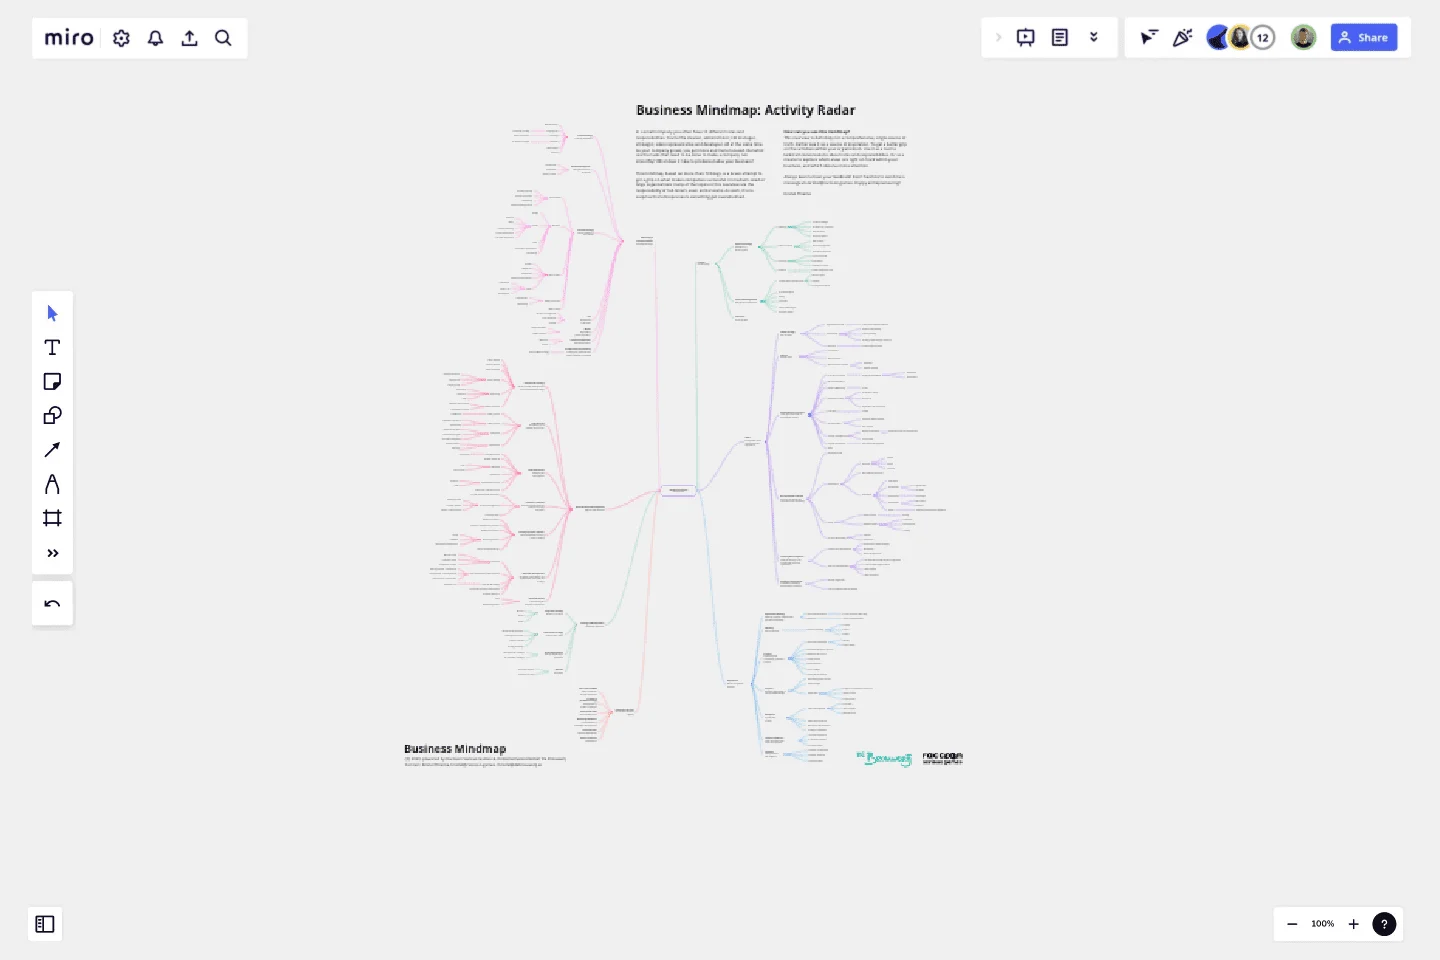
Business Mindmap
In a small company you often have 10 different roles and responsibilities. You're the cleaner, administrator, HR manager, strategist, sales representative and developer. All at the same time.
As your company grows, you get more and more focused. But what are the tasks that need to be done to make a company run smoothly? What does it take to professionalise your business?
This mindmap, based on more than 70 blogs, is a brave attempt to get a grip on what makes companies successful. In medium-sized or large organisations many of the topics in this overview are the responsibility of full-timers, even entire teams. As such, it's no surprise that entrepreneurs something get overwhelmed.
How can you use this mindmap?
This overview is definitely not a comprehensive, single-source of truth. Rather see it as a source of inspiration. To get a better grip on the activities within your organisation. Use it as a tool to kickstart conversations about roles and responsibilities. Or as a means to explore which areas are right on track within your business, and which deserve more attention.
Happy entrepreneuring!
This template was created by De Brouwerij.
Get started with this template right now.
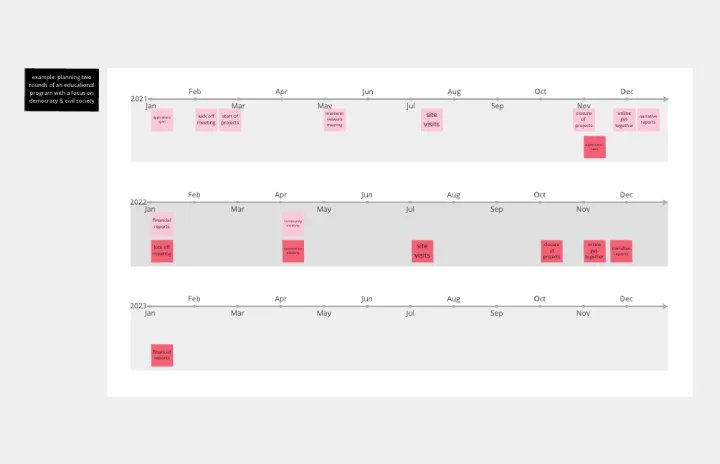
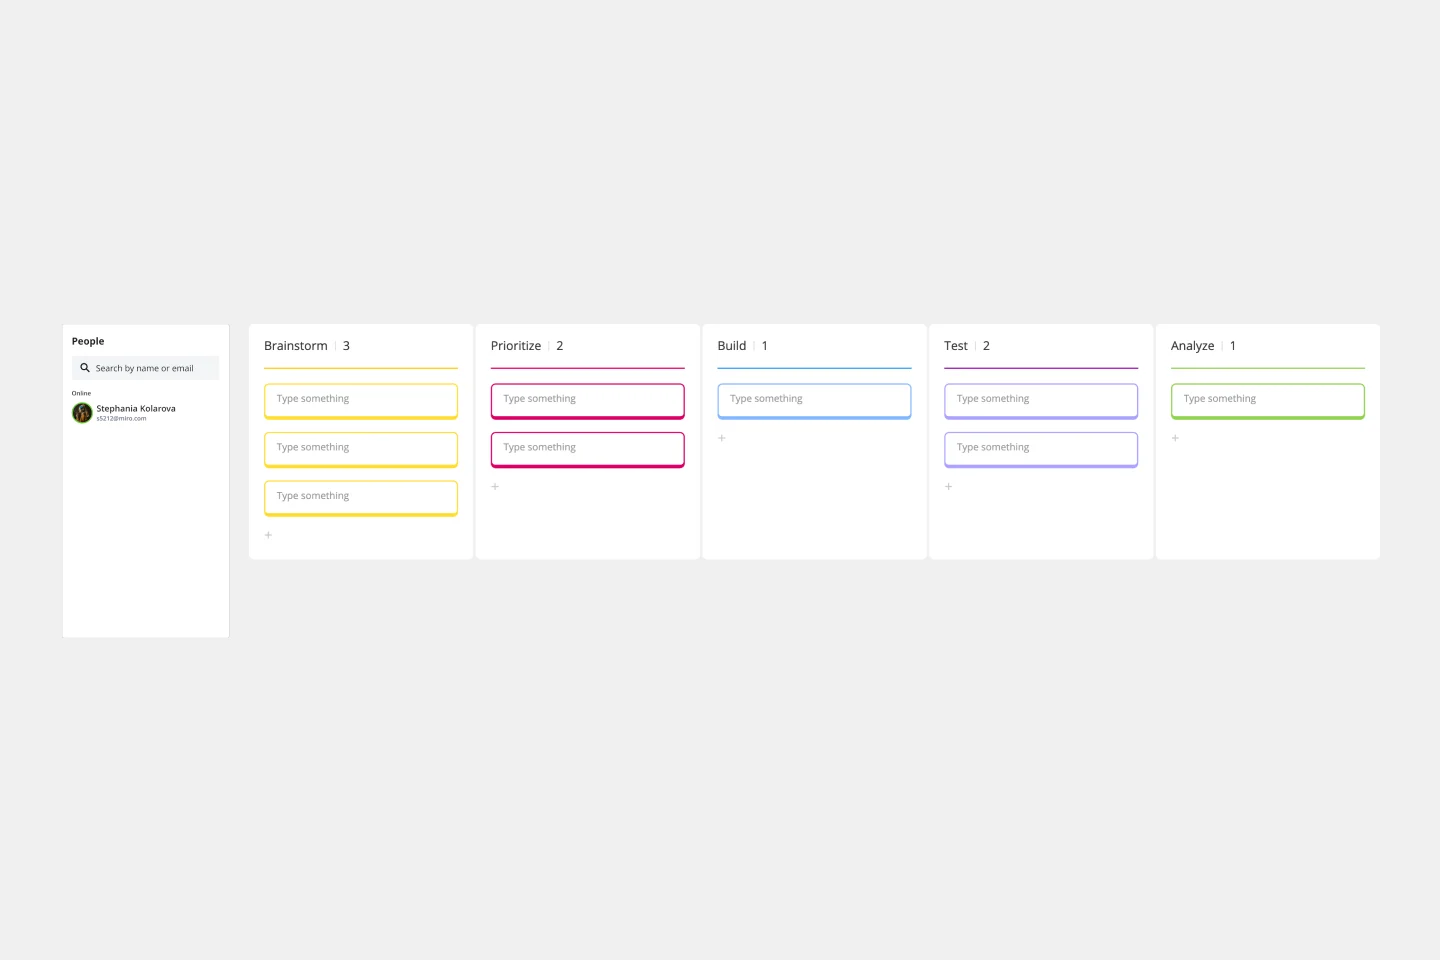
Year Timeline Template
Works best for:
Timeline, Planning
The Year Timeline template provides a comprehensive view of annual events and milestones. Perfect for planning yearly goals, tracking progress, and scheduling important dates, this template helps you stay organized and focused throughout the year.
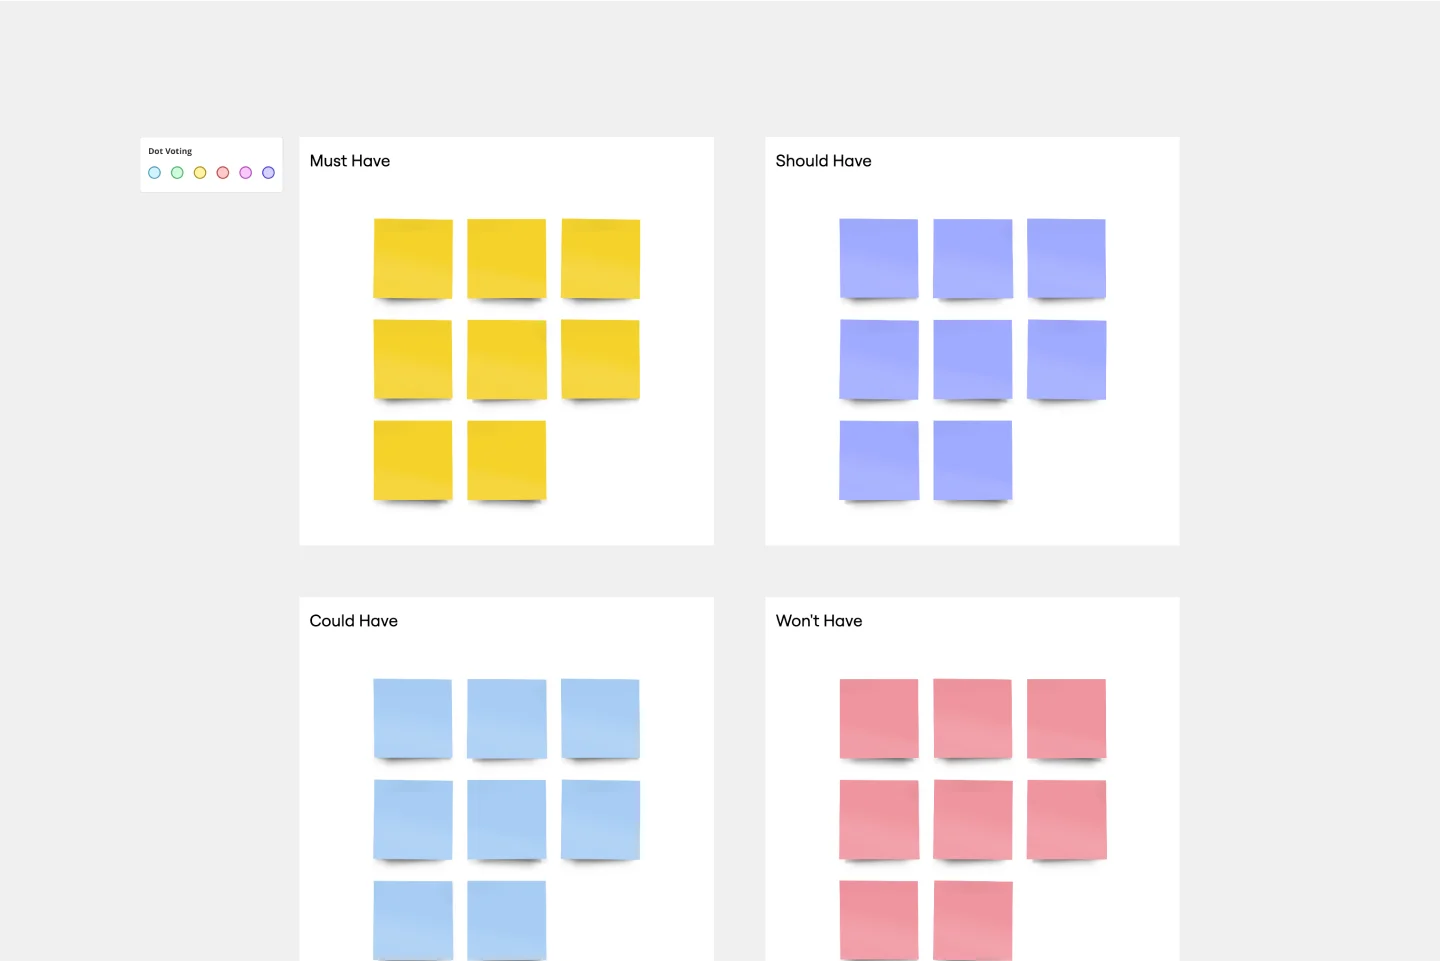
MoSCoW Matrix Template
Works best for:
Ideation, Operations, Prioritization
Keeping track of your priorities is a big challenge on big projects, especially when there are lots of deliverables. The MoSCoW method is designed to help you do it. This powerful technique is built on a matrix model divided into four segments: Must Have, Should Have, Could Have, and Won’t Have (which together give MoSCoW its name). Beyond helping you assess and track your priorities, this approach is also helpful for presenting business needs to an audience and collaborating on deliverables with a group of stakeholders.
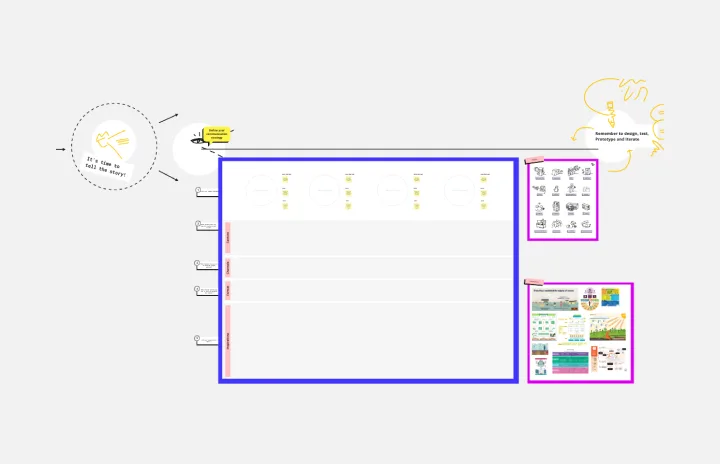
Theory of Change Template
Works best for:
Leadership
Outline a roadmap to bring change to your organization with the Theory of Change Template. Become the transformational agent inside your organization.
Growth Experiments Template
Works best for:
Leadership, Desk Research, Strategic Planning
Many ambitious companies are eying the future and aiming to grow. But growth decisions can be leaps of faith that are risky and costly. That’s why growth experiments make so much sense. They offer a systematic six-step method that reveals which strategies are most effective, how they’ll affect your revenue, and how they compare to your past approaches. By helping you test out your strategies for scaling your business before you fully commit, growth experiments can save you serious time, resources, and money.
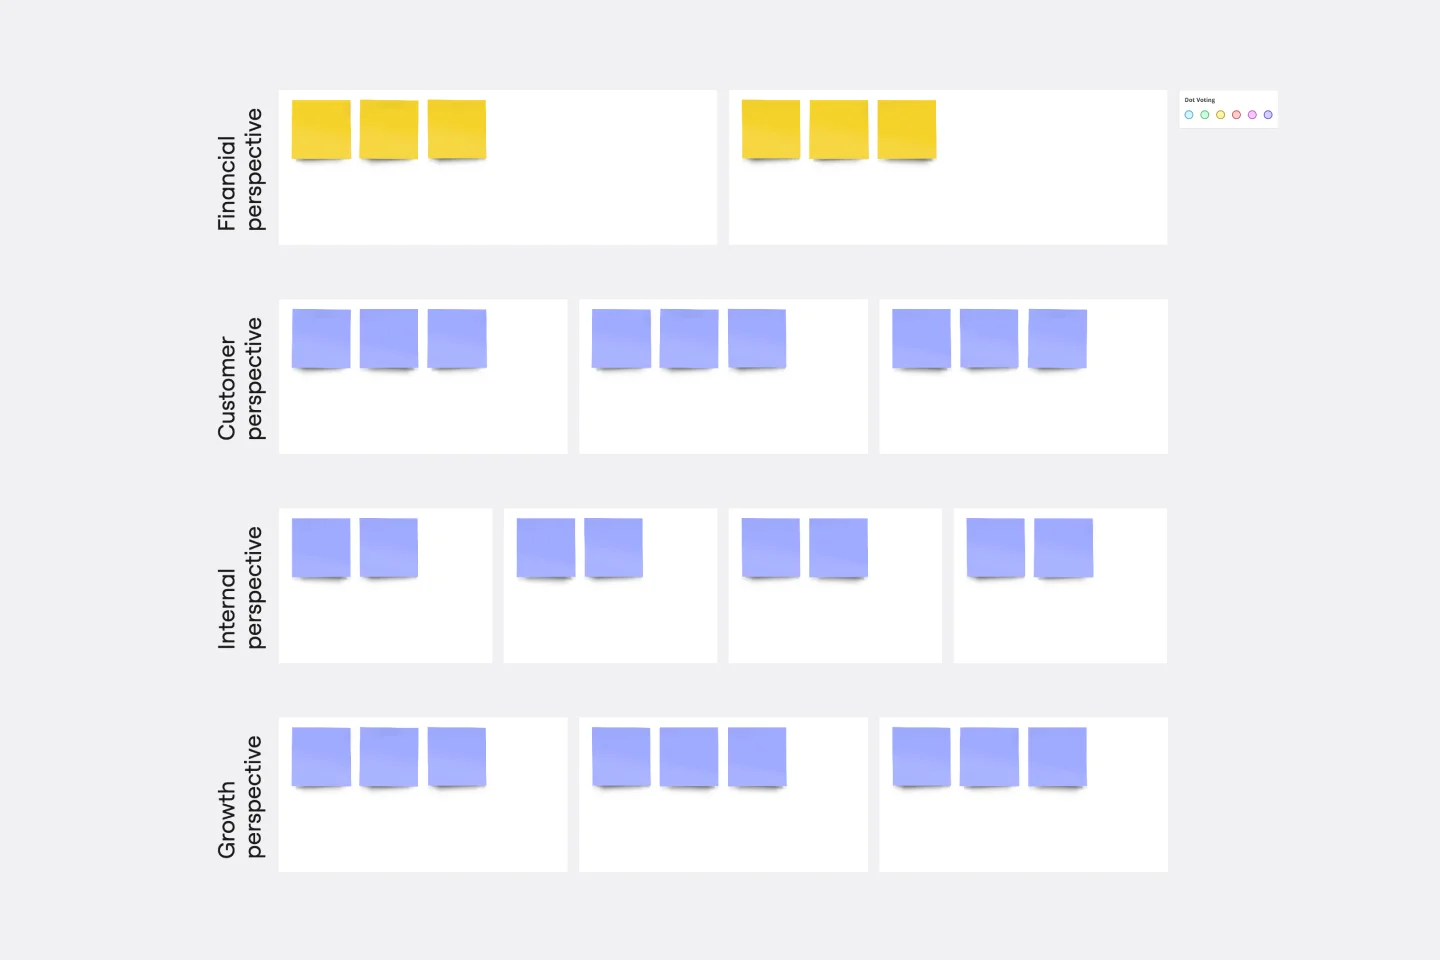
Strategy Map Template
Works best for:
Leadership, Strategic Planning, Mapping
How do your individual or team goals relate to an organization’s overall strategy? A Strategy Map is a stylized picture of your organization’s strategy and objectives. It’s powerful because it provides a clear visual guide to how these various elements work together. Strategy Maps can help align various different team goals with the overall strategy and mission. With the Strategy Map in place, teams can create set actionable, relevant KPIs. Strategy mapping is often considered part of the balanced scorecard (BSC) methodology, which is a strategic planning tool for setting overall team goals.
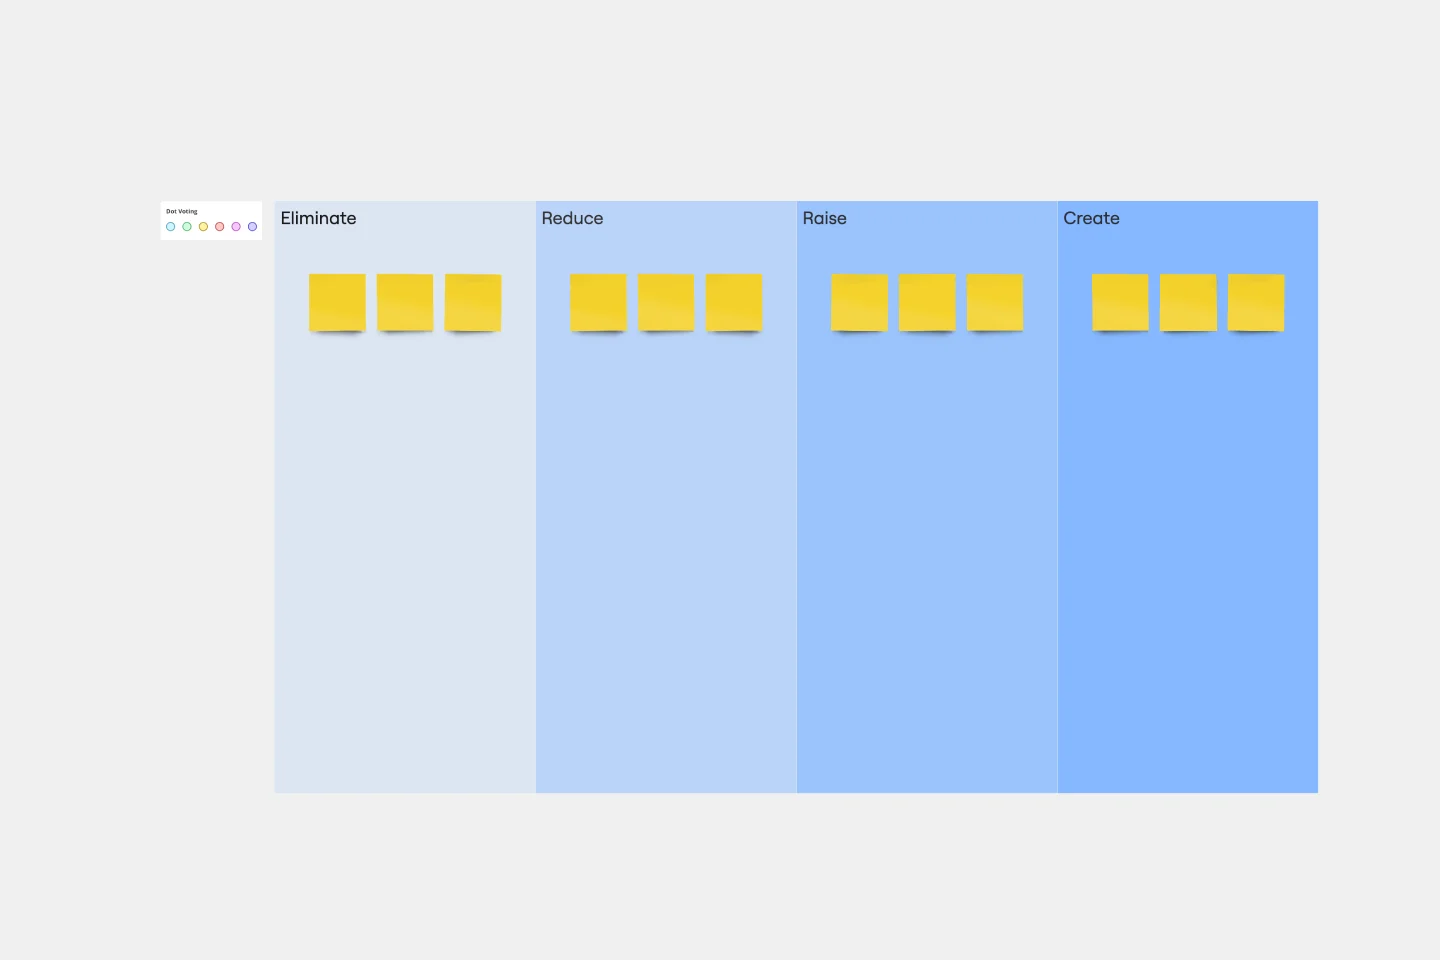
Blue Ocean 4 Actions Framework Template
Works best for:
Leadership, Decision Making, Strategic Planning
For entrepreneurs, so much comes down to new users—how to attract them, impress them, and convert them to loyal customers. This template, designed by the authors of Blue Ocean Strategy: How to Create Uncontested Market Space and Make the Competition Irrelevant, will help you maximize value for you and your customers alike. Using the template’s four steps (divided into easy columns), you’ll easily evaluate your products in more innovative ways and make sure money is being spent in areas that really matter.