Business Intelligence Architecture Template
Simplify complex data structures with the business intelligence architecture template. Visualize data sources, warehouses, ETL processes, tools, and interfaces with ease.
About the Business Intelligence Architecture Template
The Business Intelligence Architecture Diagram Template is a useful tool for creating visual representations of complex data structures and processes in a business intelligence system. This template is designed to meet the needs of IT professionals, data analysts, and business strategists, allowing them to communicate complex ideas effectively and promote better collaboration among team members.
Understanding the template
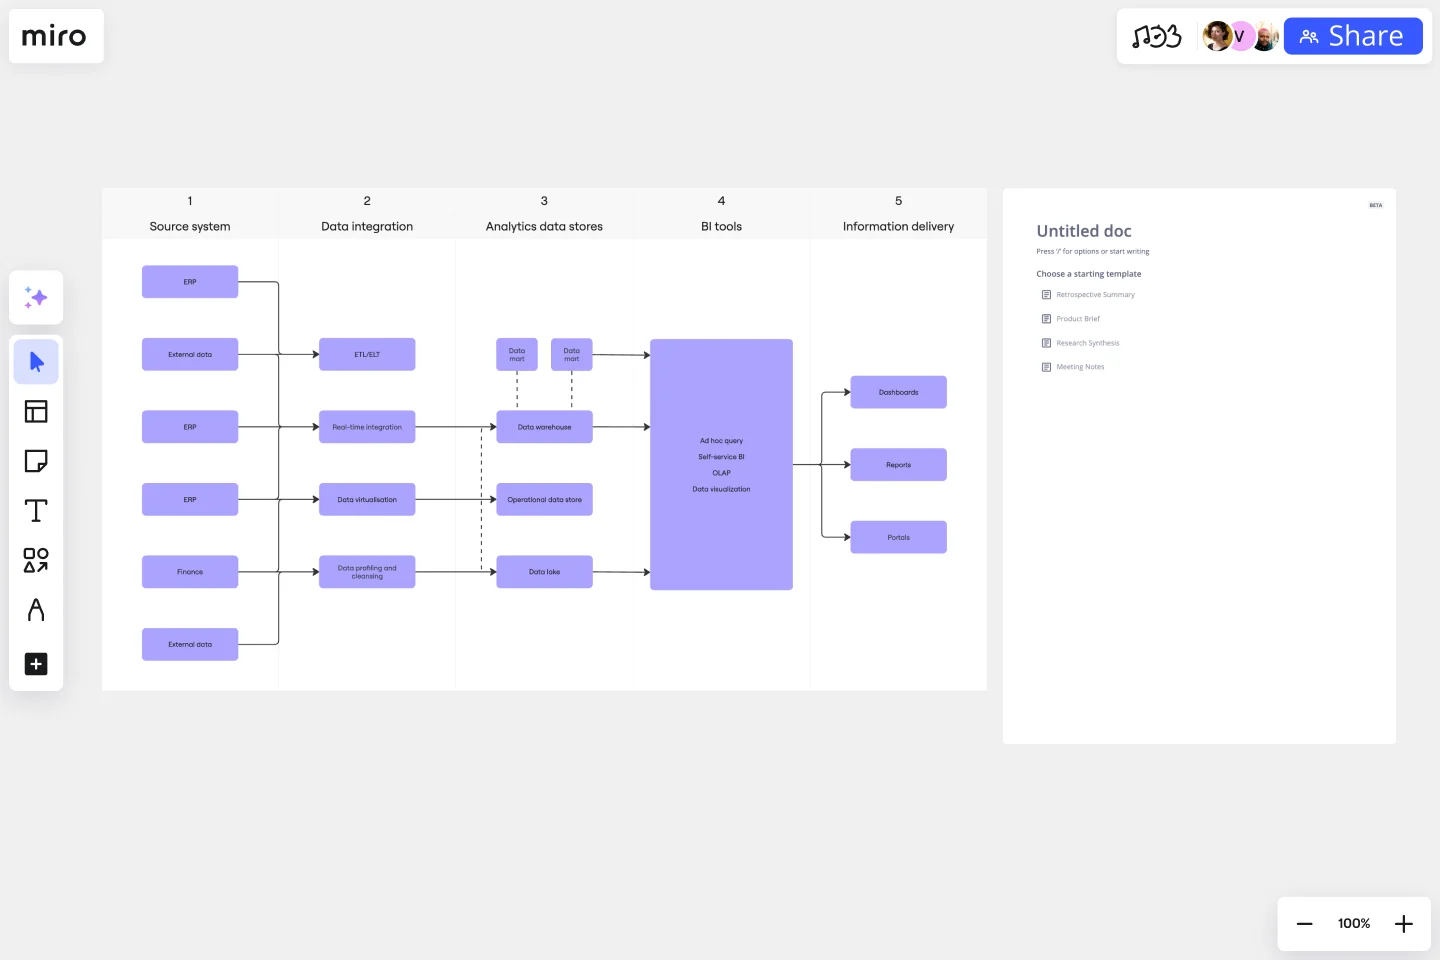
The business intelligence architecture template is usually divided into key areas, with the role of each component explained.
Data sources: This refers to the various databases and external APIs that contribute to the business intelligence system, providing different data inputs for analysis.
Data warehouse: It is the centralized repository where data is stored and organized in a structured format for easier retrieval and analysis.
ETL process: This process involves three main phases - extraction, transformation, and loading - to convert raw data into a usable format that can be analyzed and stored in the data warehouse.
Business intelligence tools: These are software and tools that help with data analysis, reporting, and visualization, providing a comprehensive view of the technological landscape.
Reporting and dashboards: This refers to the end-user interface, which includes reports and dashboards that offer a clear and user-friendly overview of the analyzed data.
How to use the business intelligence architecture template in Miro
Customize the template easily by using the drag-and-drop feature. This will help you represent your specific architecture seamlessly and with precision.
Miro's automated diagramming feature allows you to expand the template dynamically. This ensures that your diagram stays current with minimal manual intervention.
You can enhance the depth of your diagram by integrating relevant artifacts such as notes, comments, or links onto the Miro board. This provides additional context for your team.
Why should you use a business intelligence architecture Template?
Simplify complex concepts to enhance understanding and communication within the team. Encourage efficient collaboration among team members.
Collaboration is made easier with a visual roadmap, which helps prevent misunderstandings and facilitates decision-making, saving time.
Save time on project planning with professional diagrams.
Miro's automated diagramming features help businesses adapt effortlessly to evolving intelligence landscapes.
Can I customize the colors and shapes in the template?
The template is entirely customizable. Users can change colors, shapes, and labels to align with their preferences and organizational standards.
How frequently should I update my business intelligence architecture diagram?
Regular updates are advisable, particularly when changes occur in data sources, tools, or processes, ensuring the diagram accurately reflects the current state of the business intelligence system.
Get started with this template right now.
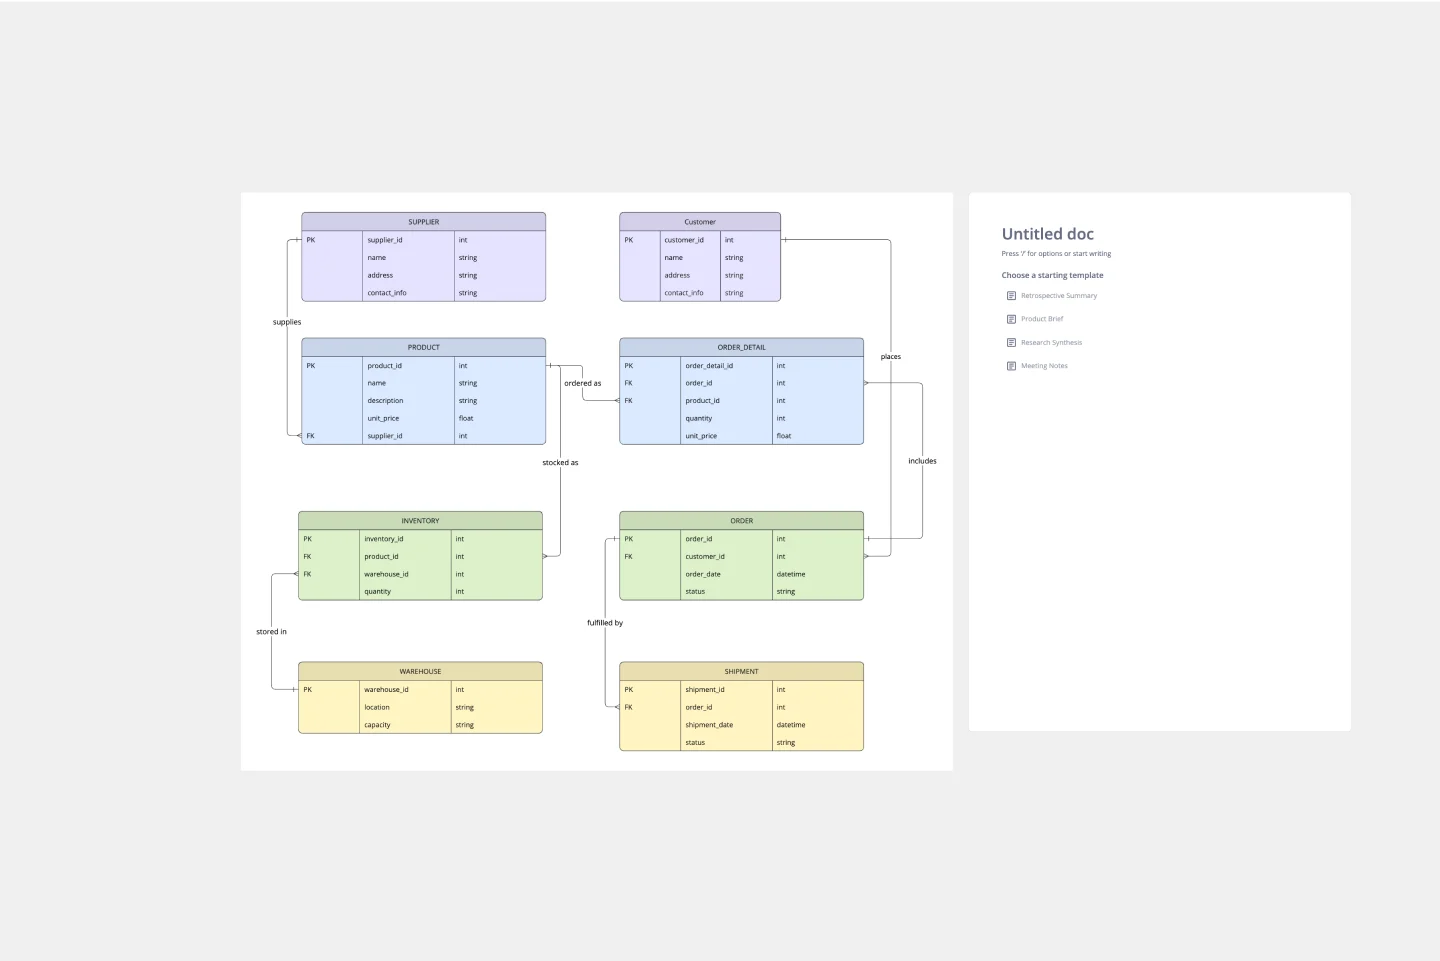
ERD Supply Chain Management System Template
Works best for:
ERD
The ERD Supply Chain Management System Template streamlines and optimizes supply chain operations. It serves as a visual support that helps businesses understand and manage the complex relationships between different entities within their supply chain, such as suppliers, products, inventory, orders, and shipments. By providing a clear visualization of these relationships, the template enables users to identify inefficiencies and areas for improvement, facilitating strategic decision-making.
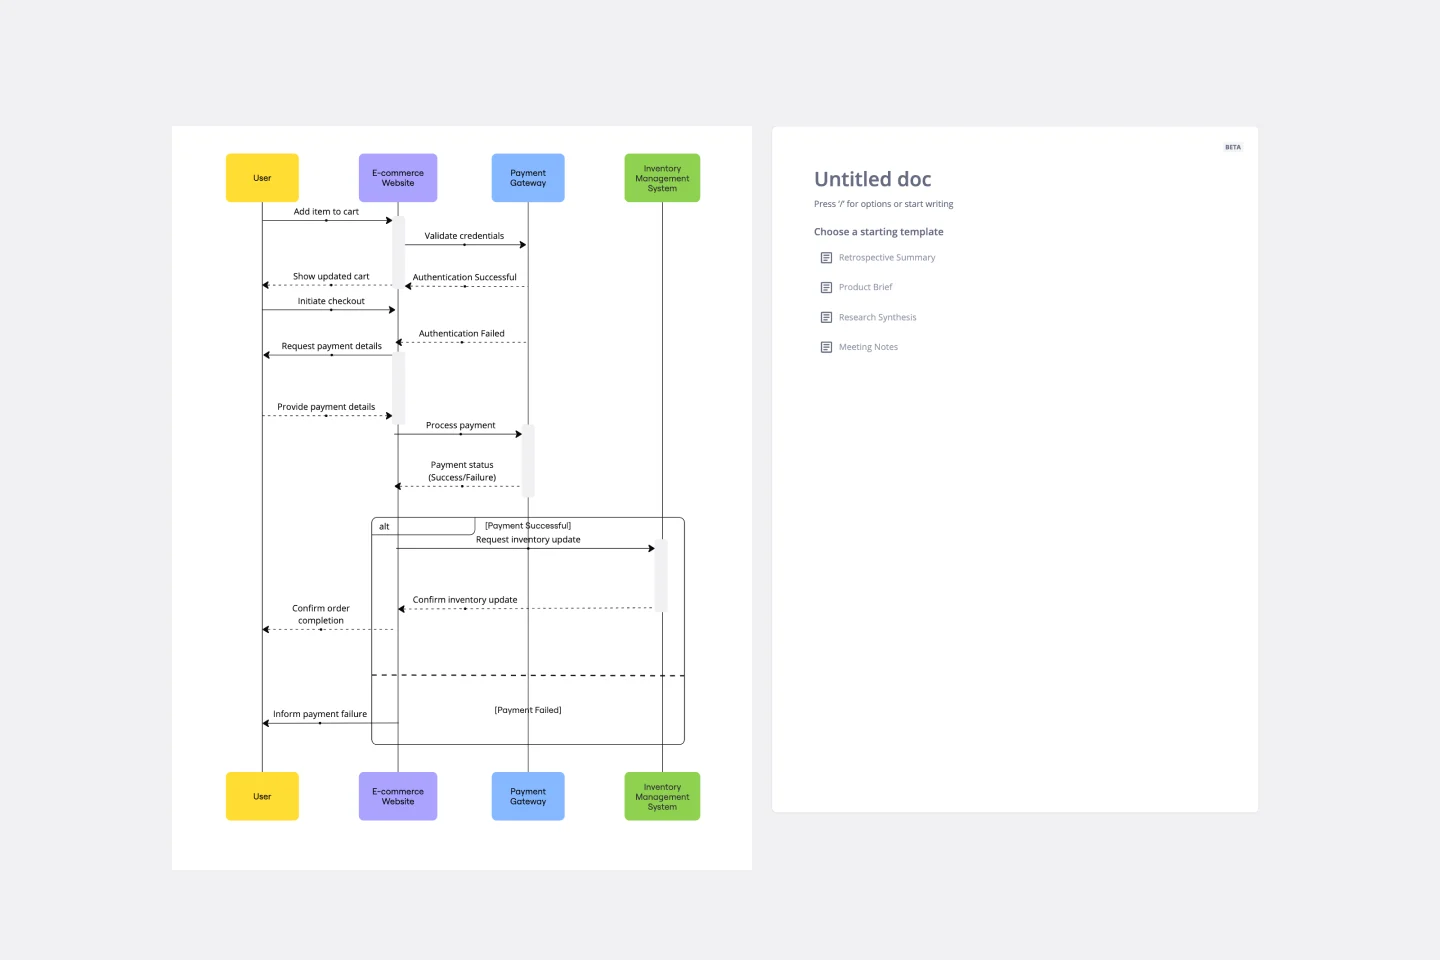
UML Sequence E-commerce Checkout Template
Works best for:
UML
The UML Sequence E-commerce Checkout Template in Miro is a versatile tool for visualizing and analyzing e-commerce checkout processes. It provides a step-by-step visual representation of system interactions, is highly customizable, supports real-time collaboration, and is suitable for various e-commerce platforms. It serves as an efficient documentation tool, fosters team collaboration, and contributes to a more streamlined checkout experience for customers.
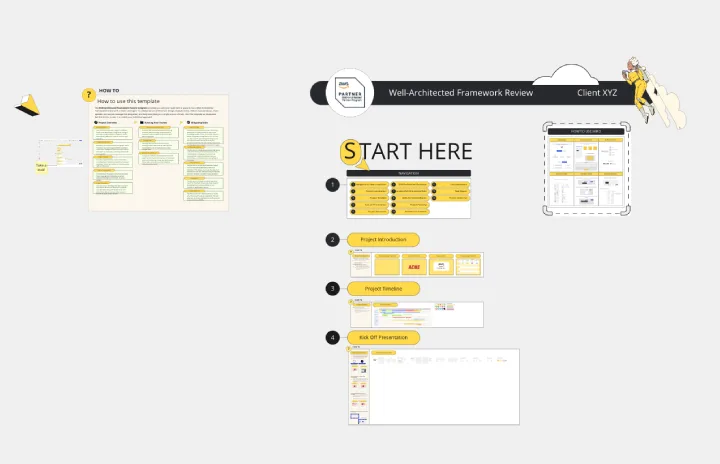
Miro for AWS Well-Architected Framework Reviews
Works best for:
Diagramming, AWS
This AWS Well-Architected Framework Review (WAFR) template provides you and your team with a dedicated space to conduct a Well-Architected Framework Review with a client.
Production Flowchart Template
Works best for:
Flowcharts
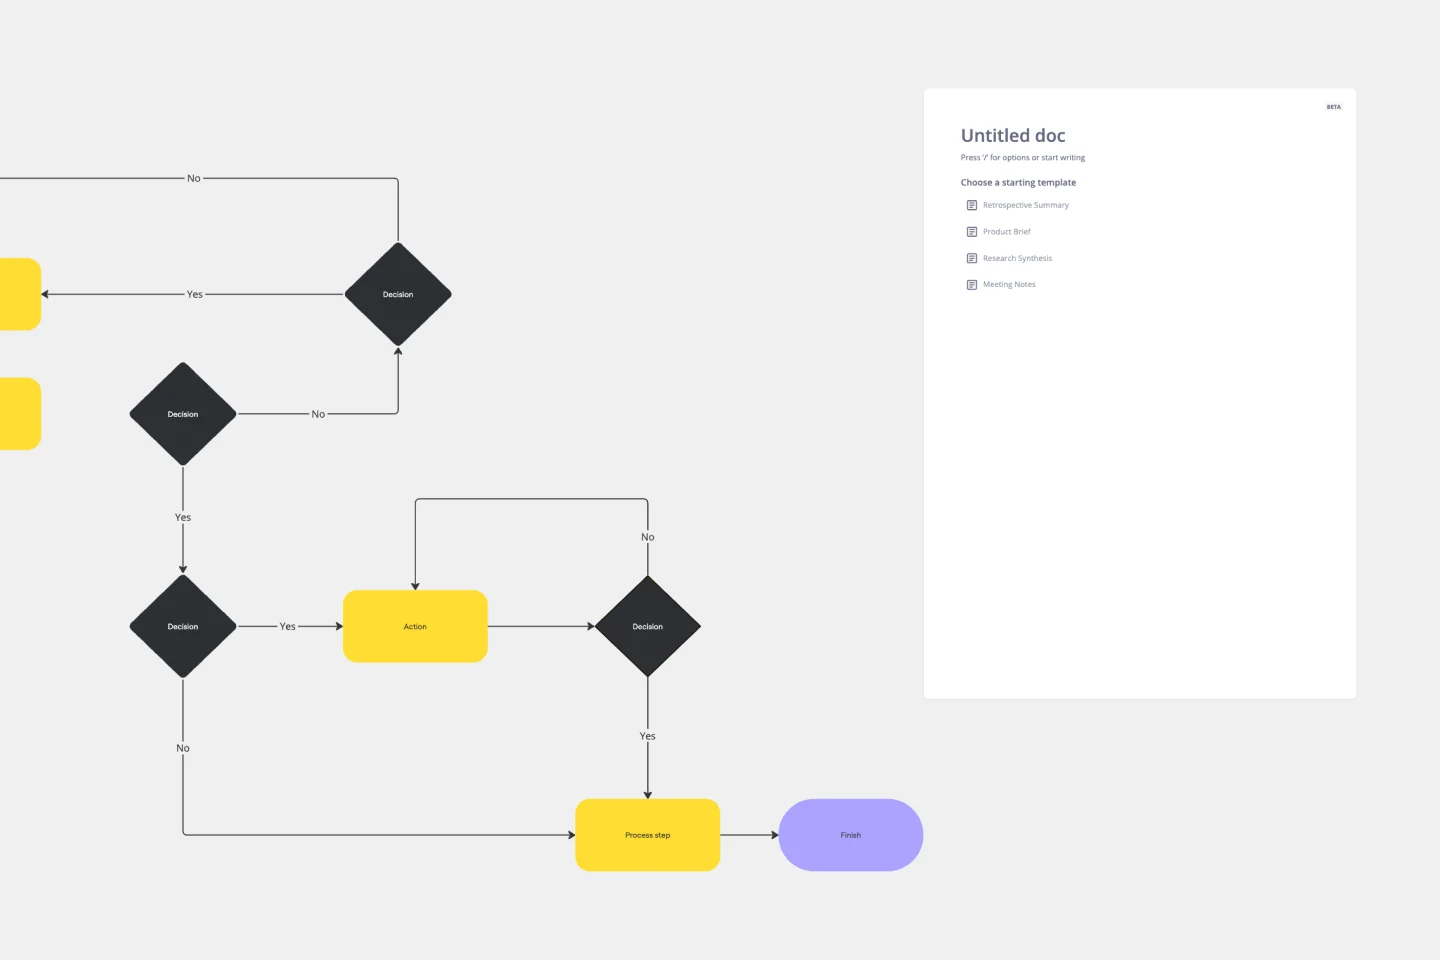
The Production Flowchart Template is a well-crafted tool that clearly represents a production process from start to finish. It breaks down complex procedures into easy-to-understand segments, making it easier for stakeholders to grasp the entire process. One of the key benefits of using this template is that it helps to clarify complex production pathways. By mapping out operations visually, teams can identify potential bottlenecks or inefficiencies, facilitating timely and well-informed decision-making.
On-Premise to Cloud Migration Process Flowchart Template
Works best for:
Flowcharts
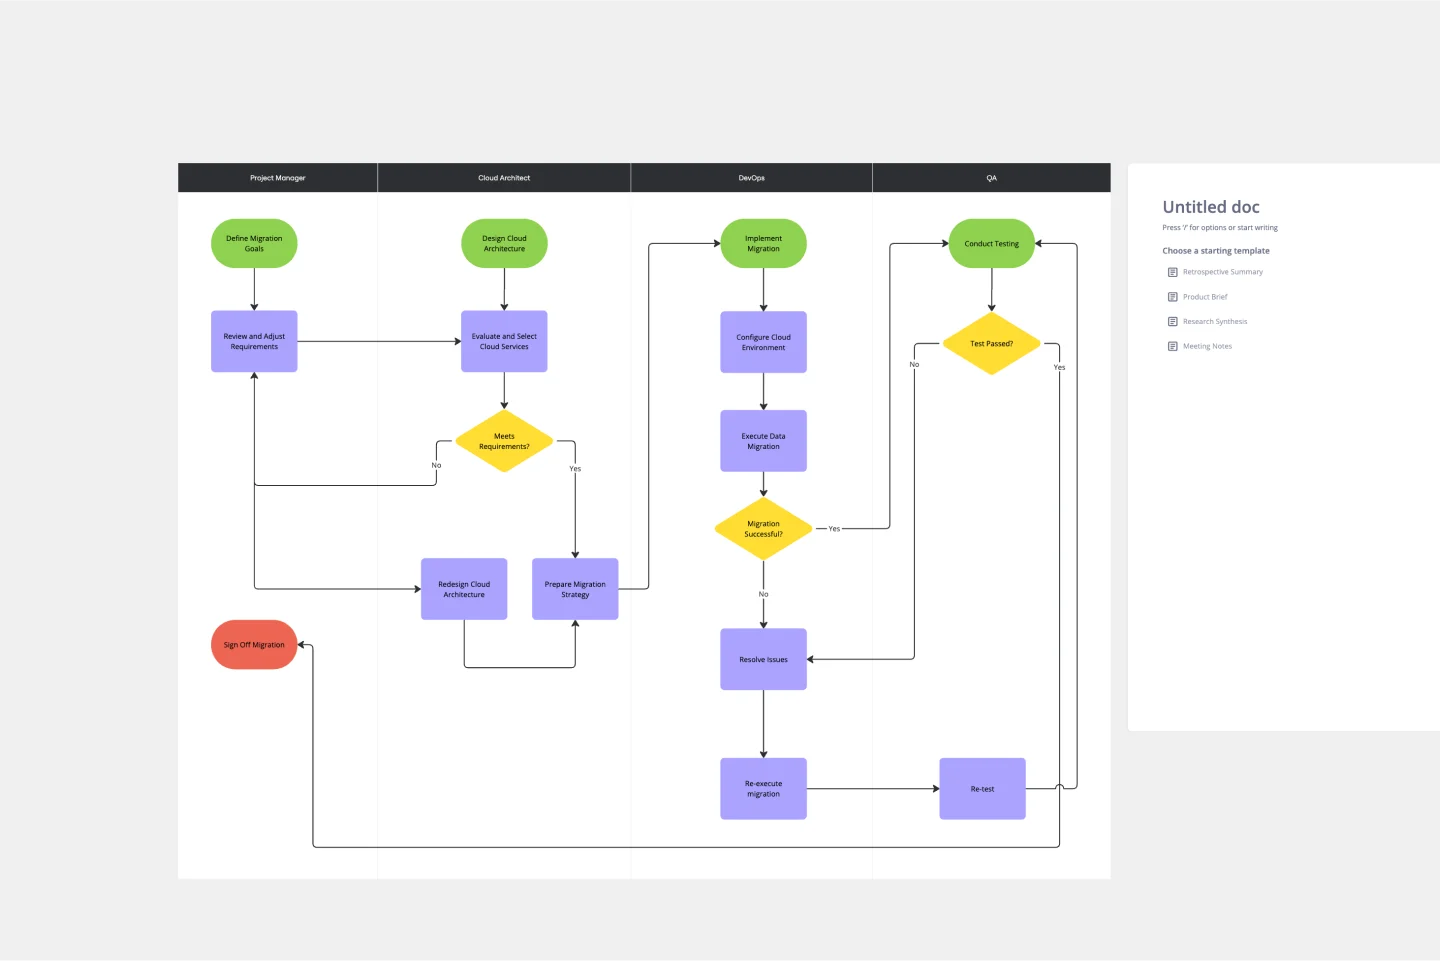
The On-Premise to Cloud Migration Process Flowchart Template is a strategic tool designed to streamline the transition from traditional on-premise systems to more flexible, scalable cloud-based solutions. This template acts as a visual roadmap, guiding teams through each phase of the migration process with clarity and precision. By breaking down the migration into manageable steps, it ensures a comprehensive approach, minimizing risks and aligning with best practices for cloud adoption.
Cycle Diagram Template
Works best for:
Diagramming
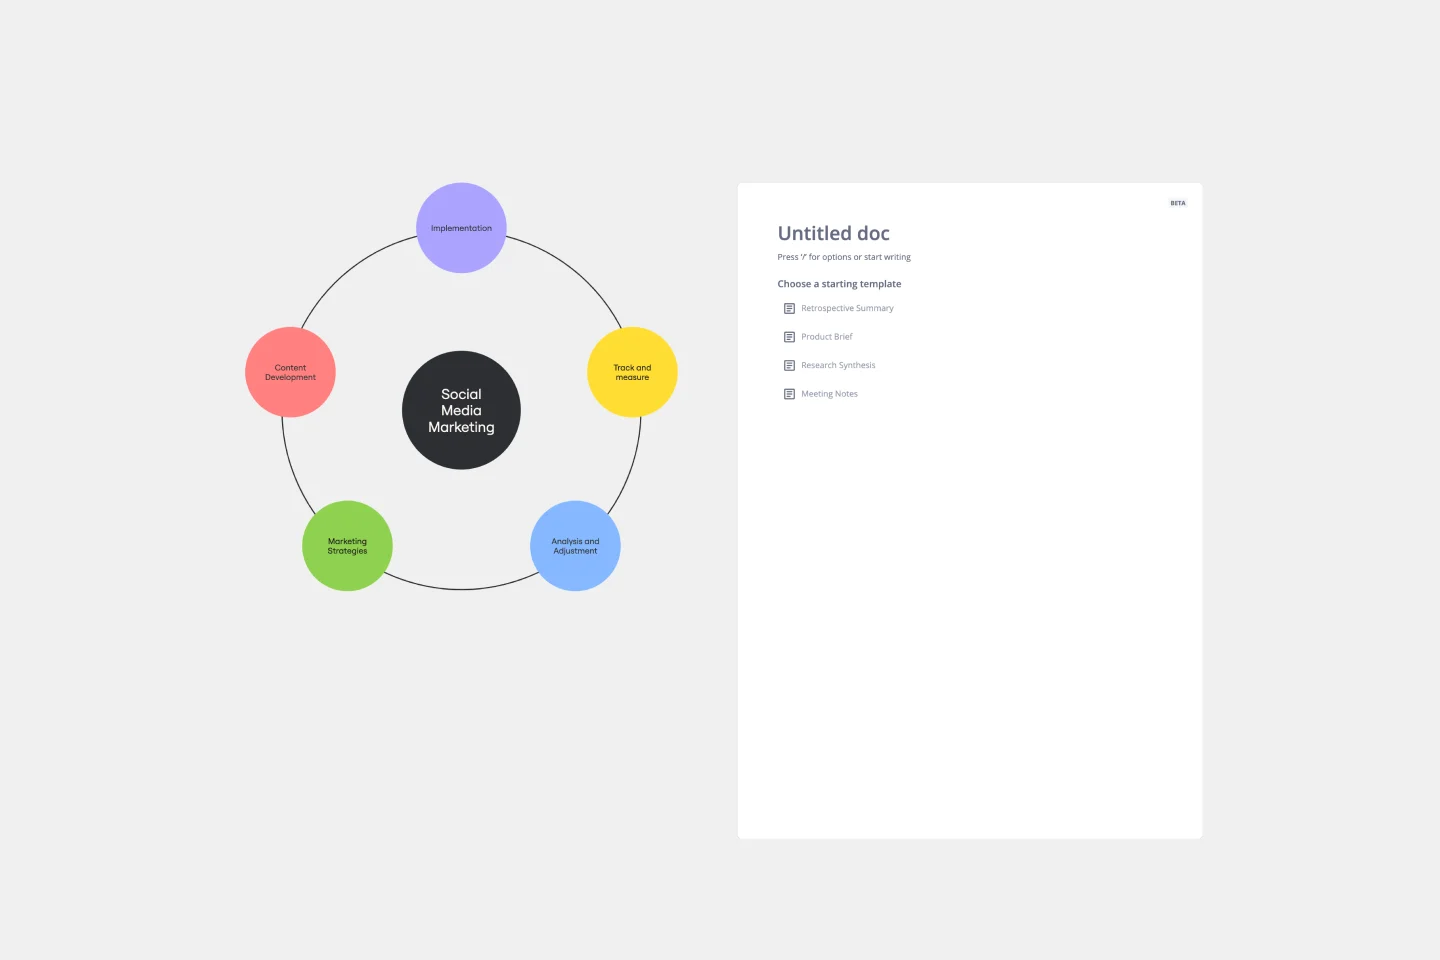
The cycle diagram template empowers professionals to visually represent complex cycles with precision and clarity. This template maps out cyclical processes, relationships, or events, ensuring that complex concepts are communicated seamlessly. One key benefit that sets this template apart is its ability to streamline communication and enhance understanding. By crafting visually appealing cycle diagrams, professionals can distill complex information into a clear visual language, making it easier for teams and stakeholders to grasp complex relationships. This ultimately fosters more effective collaboration and decision-making.