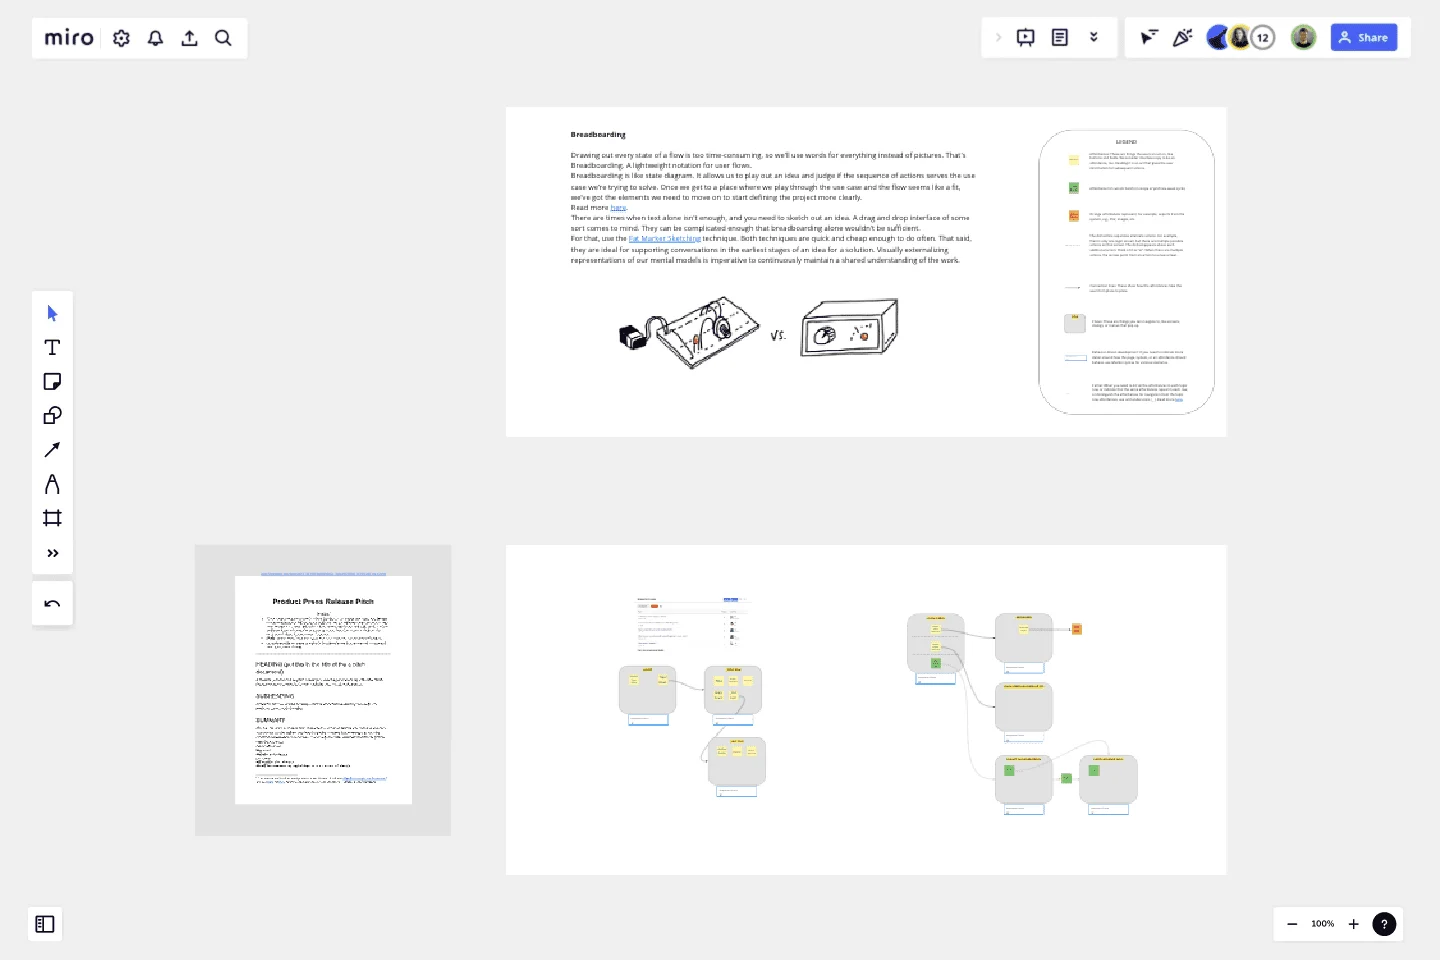
Breadboard (UI Flow Diagram)
Drawing out every state of a flow is too time-consuming, so we’ll use words for everything instead of pictures. That's Breadboarding. A lightweight notation for user flows.
Breadboarding is like state diagram. It allows us to play out an idea and judge if the sequence of actions serves the use case we’re trying to solve. Once we get to a place where we play through the use case and the flow seems like a fit, we’ve got the elements we need to move on to start defining the project more clearly.
There are times when text alone isn't enough, and you need to sketch out an idea. A drag and drop interface of some sort comes to mind. They can be complicated enough that breadboarding alone wouldn't be sufficient.
For that, use the Fat Marker Sketching technique. Both techniques are quick and cheap enough to do often. That said, they are ideal for supporting conversations in the earliest stages of an idea for a solution. Visually externalizing representations of our mental models is imperative to continuously maintain a shared understanding of the work.
This template was created by Matt Lane.
Get started with this template right now.
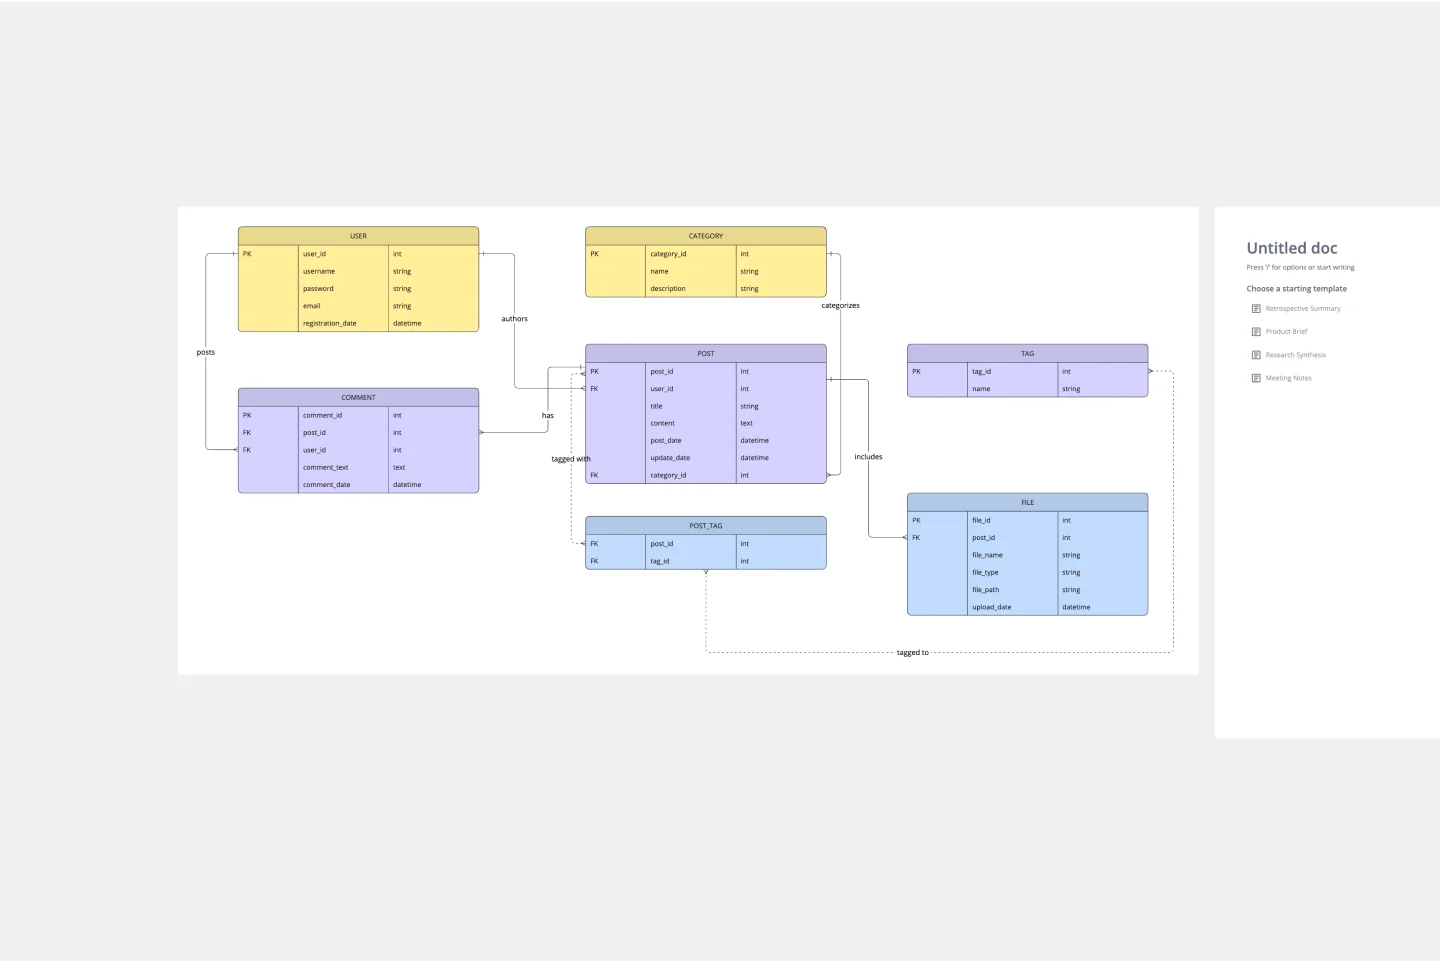
ERD Blogging System Template
Works best for:
ERD
The ERD Blogging System template in Miro efficiently manages and organizes digital content. It features key entities such as User, Post, Comment, Category, Tag, and File, which are essential for managing the creation and publication of blog posts, engaging users through comments, and organizing content via categories and tags. Additionally, it supports media attachments through the File entity, linking them to the relevant content. This template helps streamline the blogging process, making it an invaluable tool for content management and publication.
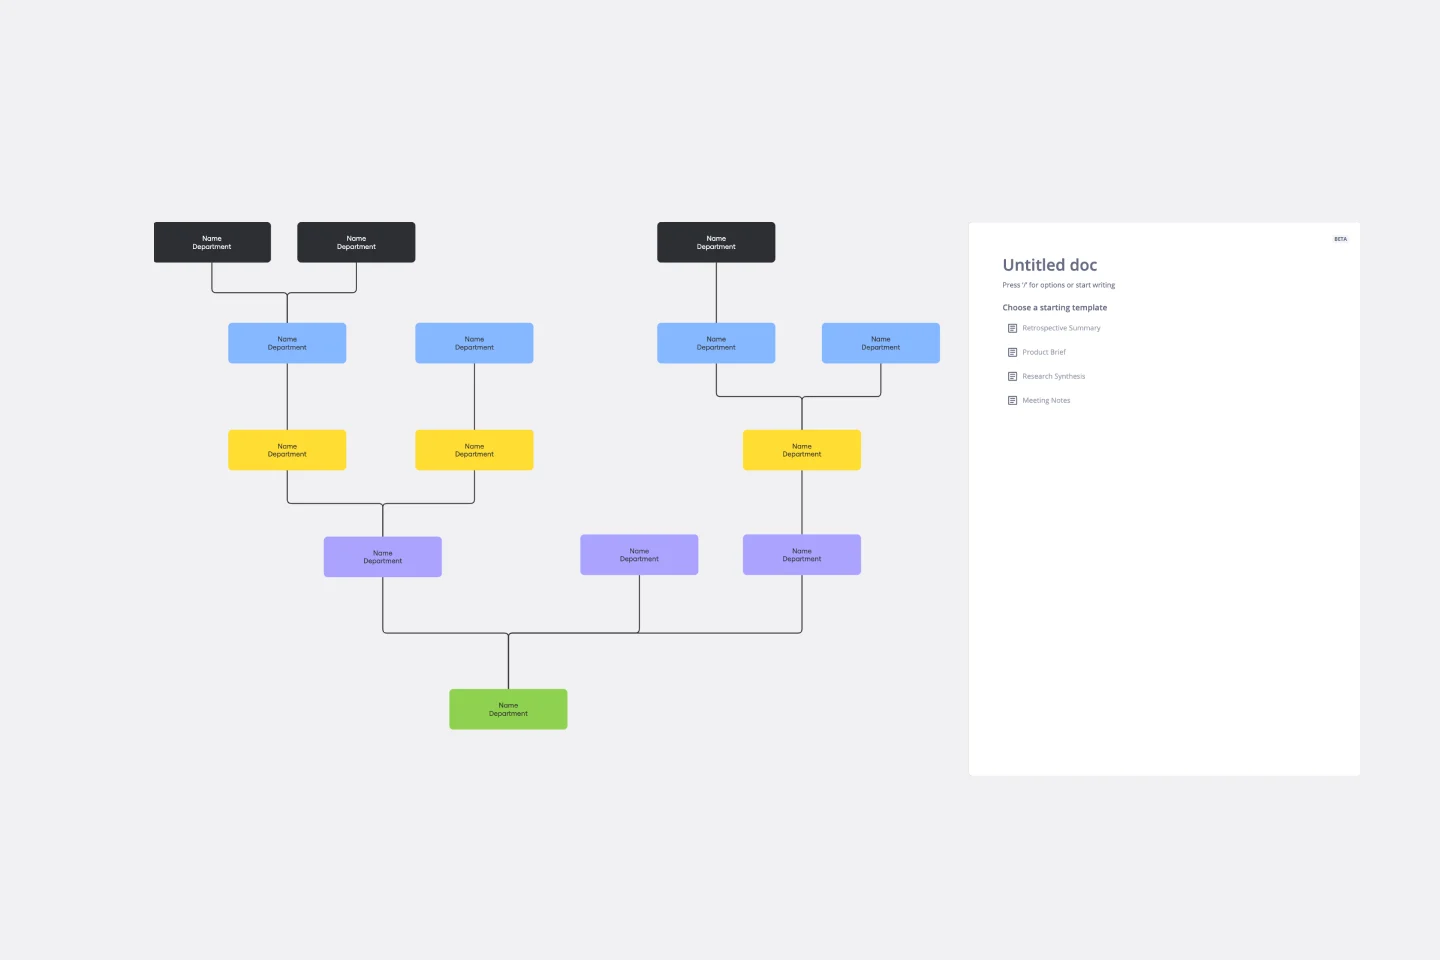
Inverted Org Chart Template
Works best for:
Org Charts, Organizational Design
The Inverted Org Chart Template is a tool that reimagines the traditional hierarchical model by placing frontline employees at the top of the organizational structure. This innovative approach highlights the crucial role played by those who interact with customers directly, ensuring that their insights and contributions are not only recognized but also celebrated. One of the key advantages of this template is that it fosters a feedback-driven environment. Prioritizing frontline workers promotes a culture where valuable insights from the ground can quickly reach the top of the hierarchy, streamlining decision-making processes and ensuring that strategies are based on real-world experiences.
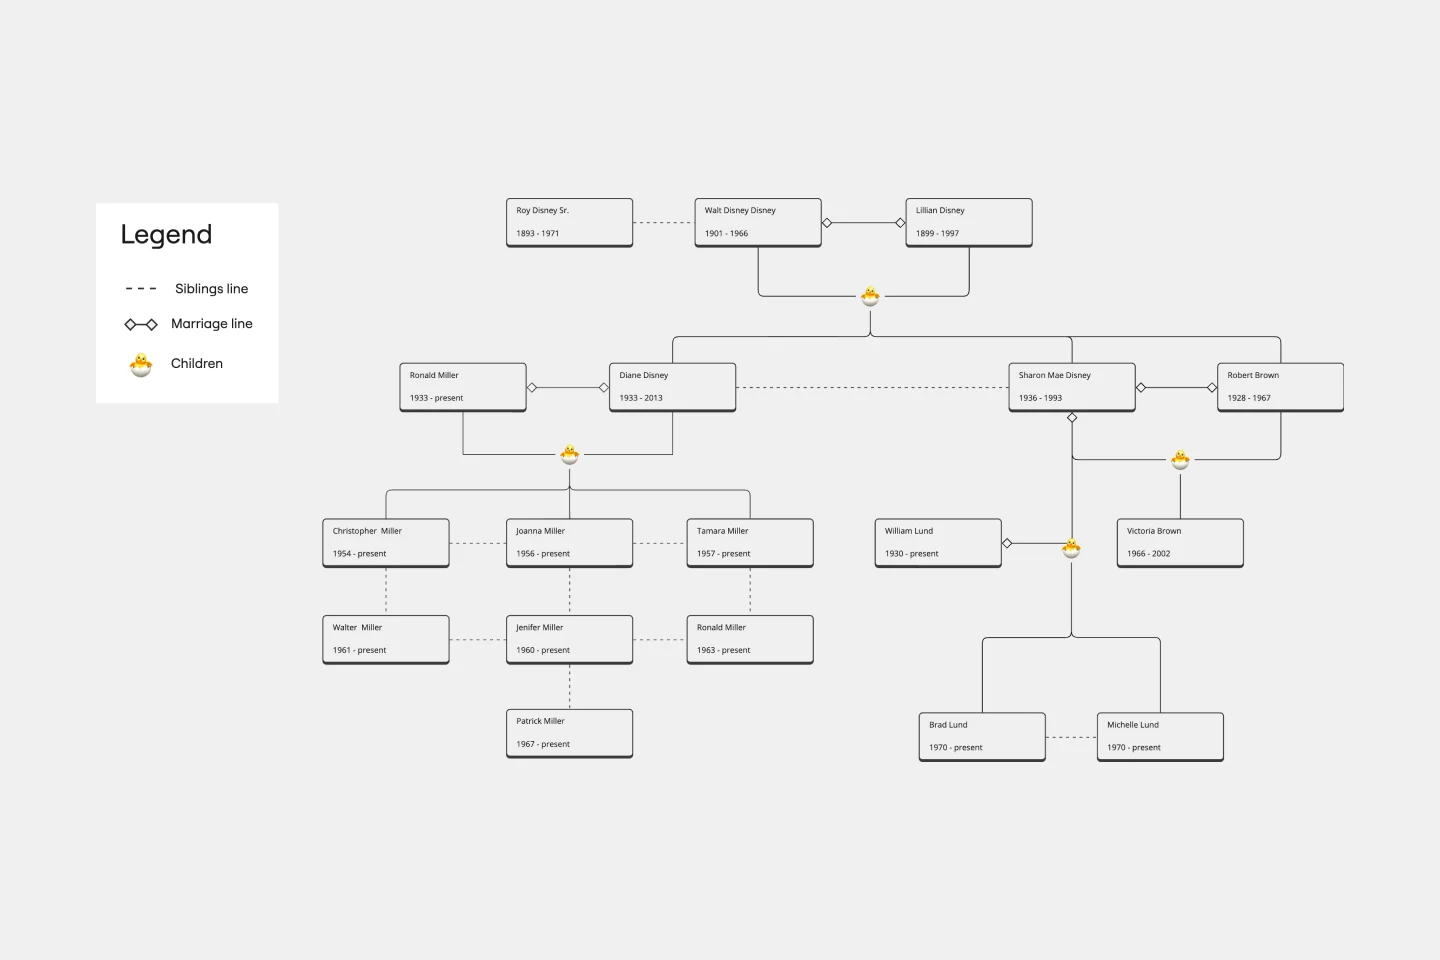
Family Tree Template
Works best for:
Education, Mapping
Family trees help you make sense of complicated family relationships, even generations back. With this Family Tree Template, you can quickly and easily add your siblings, parents, and extended family members. Plus, add extra information, notes, and even images to create a vibrant family tree.
Person Api Uml
Works best for:
Diagramming
The Person Api Uml template offers a visual framework for designing and modeling Person API structures and interactions. It provides elements for defining entities, attributes, and relationships within a Person API system. This template enables teams to visualize and communicate the structure and behavior of Person APIs, facilitating collaboration and alignment among stakeholders. By promoting clarity and consistency in API design, the Person Api Uml template empowers teams to build robust and interoperable Person API solutions.
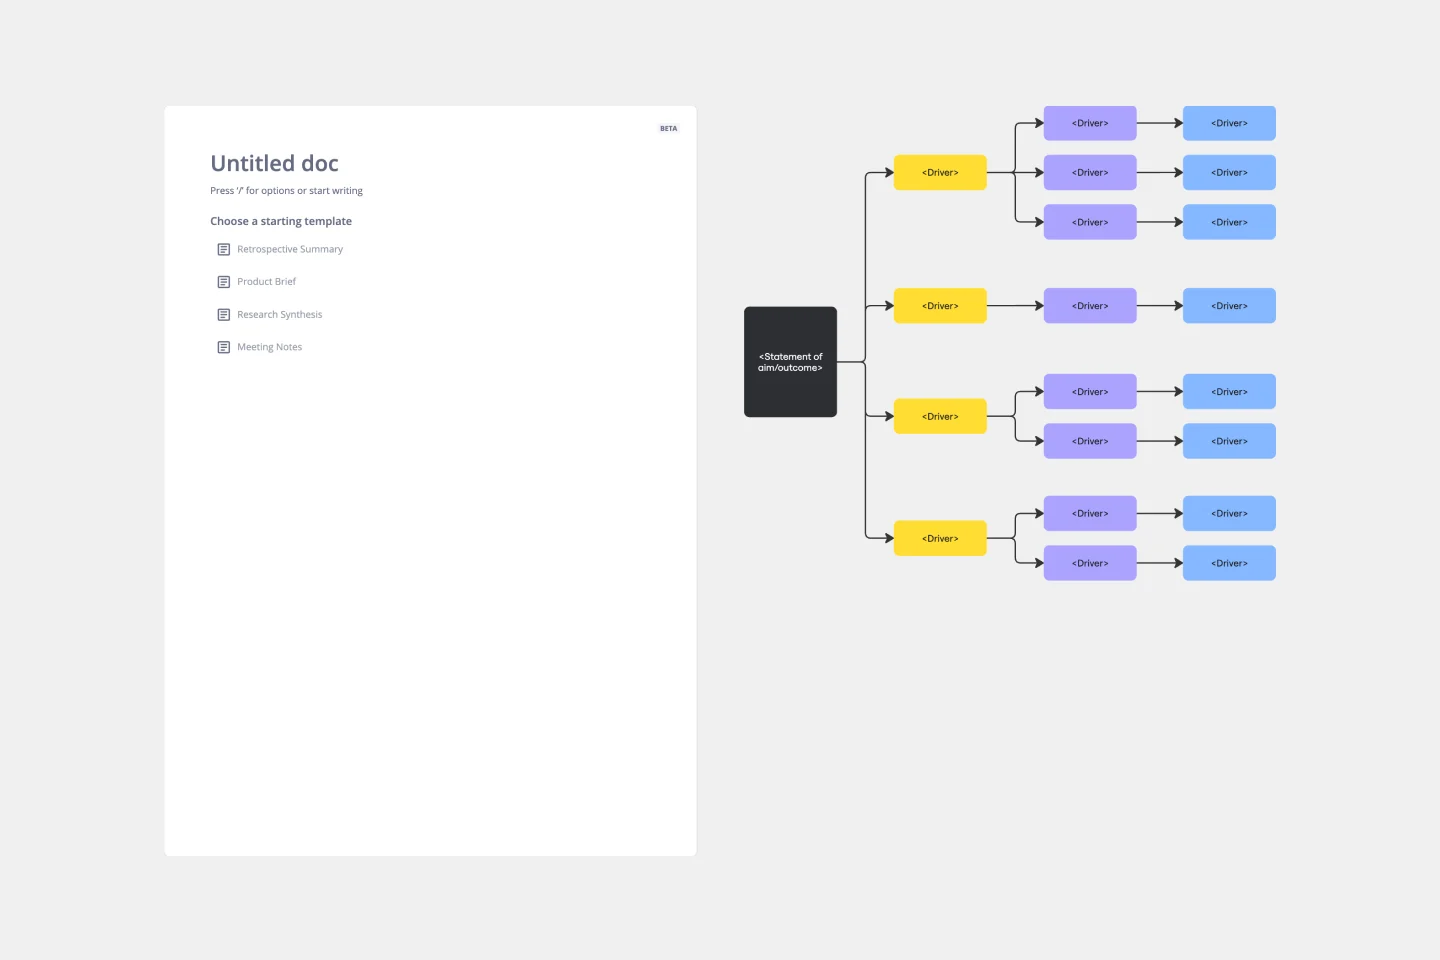
Driver Diagram Template
Works best for:
Diagramming
The driver diagram template is a strategic visual tool that helps teams map out their primary objectives and break them down into actionable components. It presents goals, drivers, and specific change ideas in a coherent and interconnected format, ensuring clarity of objective. By doing so, every team member is aligned towards a common endpoint, fostering unified efforts. The visual nature of the template simplifies complex objectives, making it easier for teams to stay on track and measure their progress effectively.
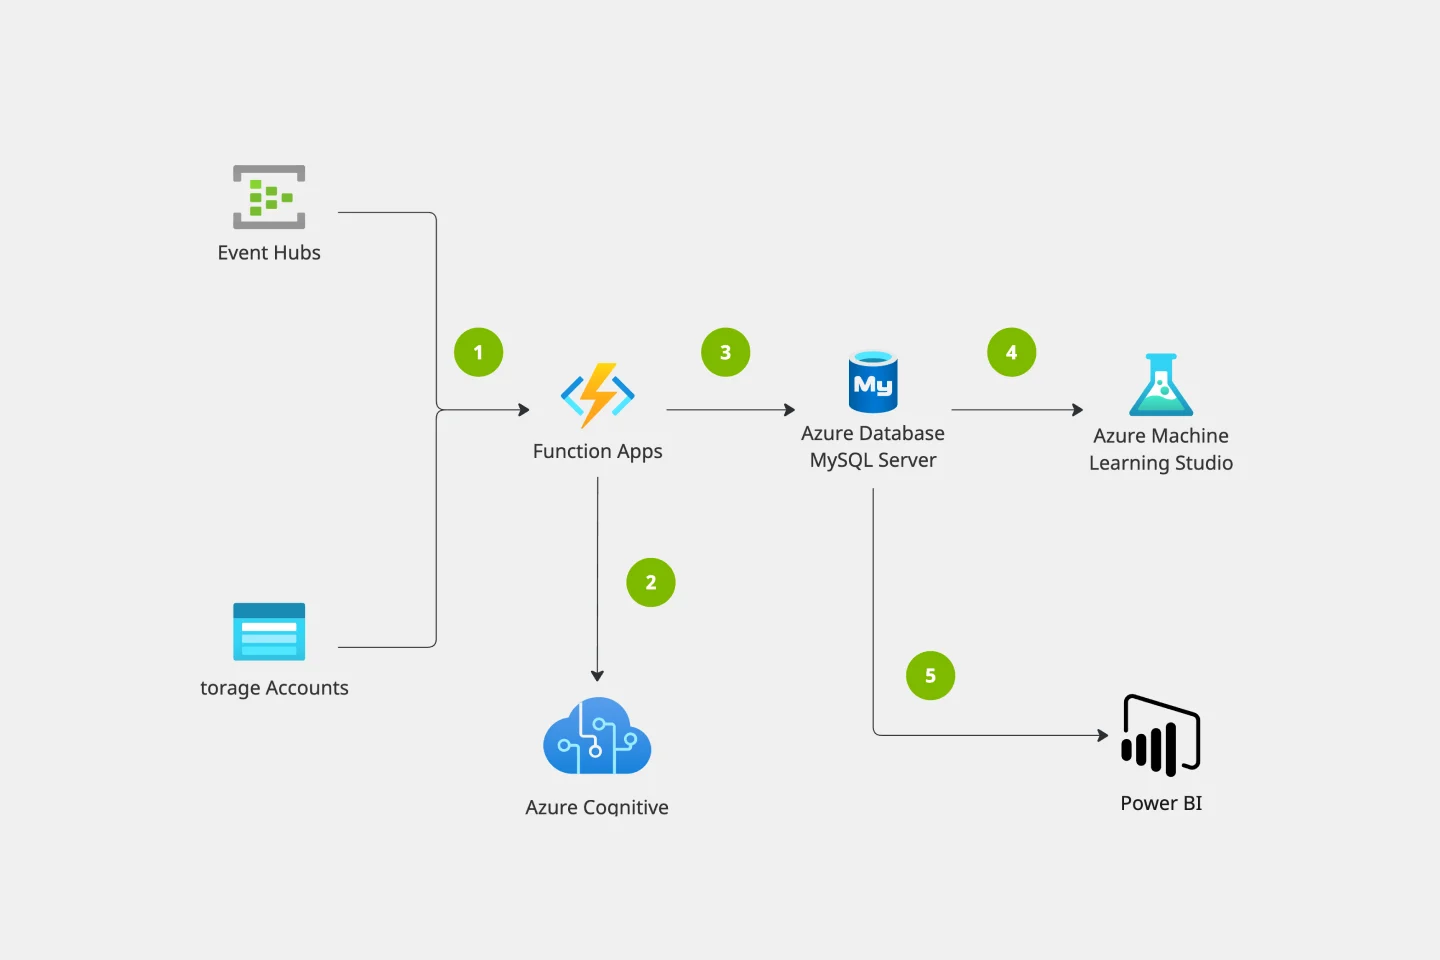
Azure Architecture Diagram Template
Works best for:
Software Development, Diagrams
The Azure Architecture Diagram Template is a diagram that will help you visualize the combination of any data and build and deploy custom machine learning models at scale. Azure is Microsoft’s cloud computing platform, designed to provide cloud-based services such as remote storage, database hosting, and centralized account management. Use Azure Architecture Diagram template to build sophisticated, transformational apps.