Bracket Template
Make the path to a final decision easier with the bracket template.
About the Bracket Template
The Bracket Template is a unique visualization tool that stands out among many others. Its structure and purpose are designed to help organize and rank ideas, teams, or topics in a sequential and competitive manner. This tool is essential for decision-making, prioritization, or even some fun team activities.
What's a bracket template?
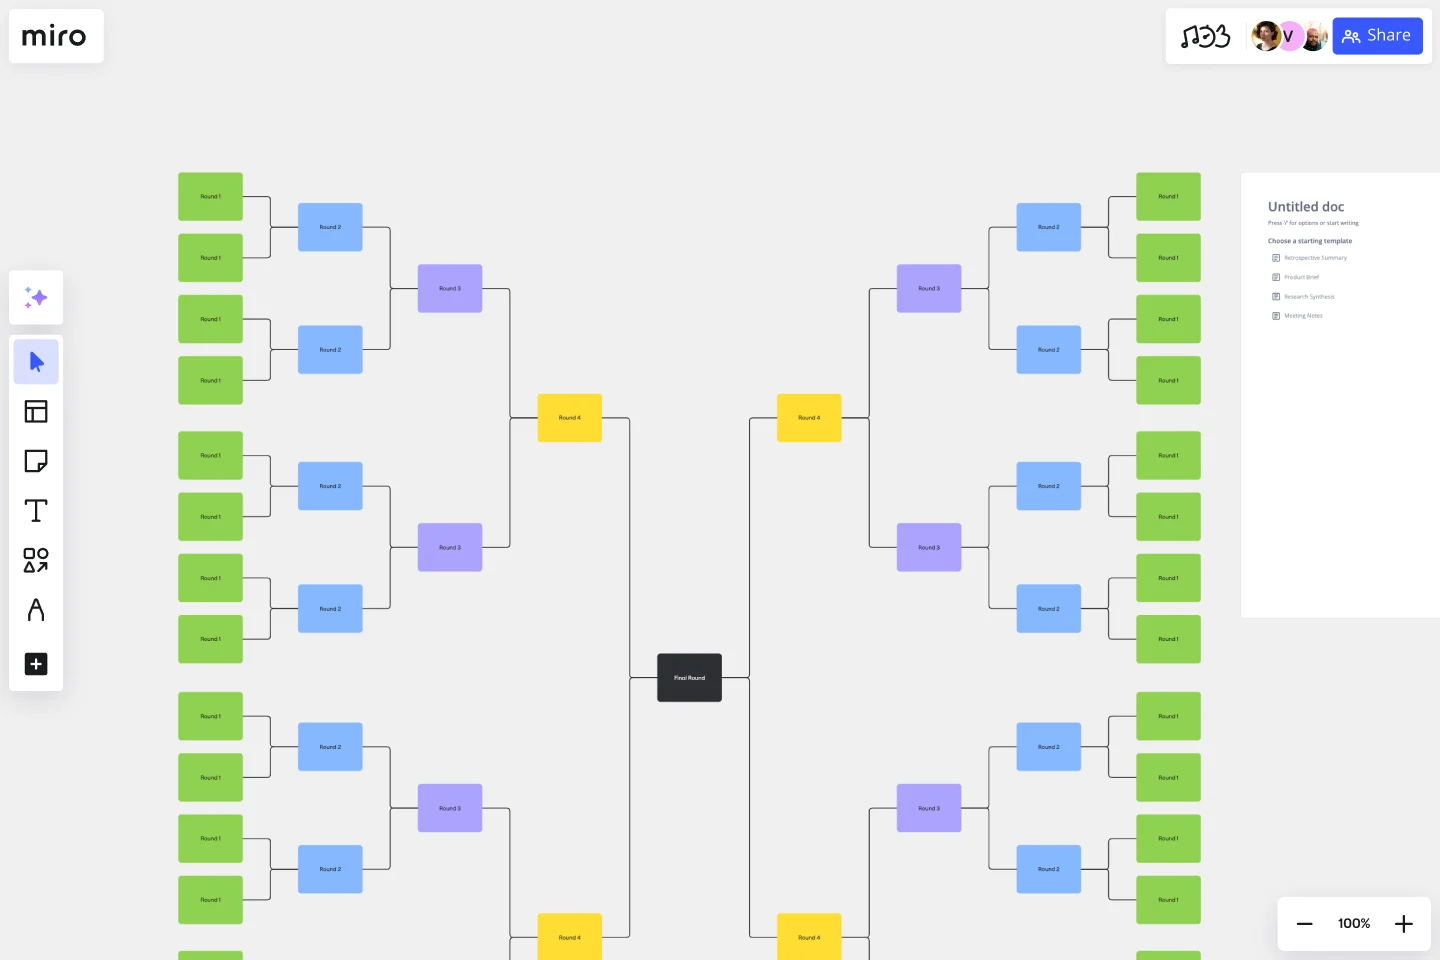
A Bracket Template is a visual representation structured in the shape of a tree, where individual entities or ideas start on either side of the diagram and face off against each other in successive rounds until a winner emerges. Each area of the template comprises:
First seeding sections: The initial placement of entities or ideas. It’s where the competition or comparison begins.
Match-up areas: These show which entities or ideas are competing against each other in each round.
Progression lines: These connector lines indicate who moves forward in the bracket after each decision or result.
Winner's circle: Located at the end of the template, it celebrates the final entity or idea that emerges victorious.
To use it, place your initial ideas or teams in the seeding sections, and as decisions are made, move or mark the progressing entity to the next round until you reach a final conclusion.
How to use the bracket template in Miro
Once on the board, you'll find it's a breeze to edit the template. With just a few clicks, adjust the names, colors, and shapes to suit your needs.
Want to expand? Use automated diagramming features to add more shapes and connector lines, ensuring the template scales with your needs.
Feel free to incorporate any artifact on the board, whether it's notes, images, or links, enriching the context and information of your bracket.
Why use a bracket template?
Structured decision-making: It helps streamline and organize complex decisions by breaking them down into smaller, manageable comparisons.
Engagement: The visual nature and competitive setup foster participation and engagement among stakeholders.
Clarity: It provides a clear visual pathway of progression, making it easier to understand the decision-making process.
Versatility: Suitable for various scenarios, from business decision-making, product prioritization, to fun team-building exercises.
Historical record: The completed template can serve as a visual record of decisions made, offering insights for future reference.
Can I customize the number of seeding sections?
Absolutely. The template is designed to be flexible. You can expand or reduce the number of seeding sections based on your requirements.
Is it possible to use the Bracket Template for non-competitive scenarios?
Yes. While traditionally used for competitive scenarios, the bracket template can be adapted for any situation where structured decision-making or organization is beneficial.
Are there any collaboration features available with the Bracket Template?
Stakeholders can comment, provide feedback, and participate in real-time, making the decision-making process collaborative and inclusive.
Get started with this template right now.
Lotus Diagram Template
Works best for:
UX Design, Ideation, Diagrams
Even creative thinkers occasionally need help getting their creative juices flowing. That's where a lotus diagram comes in. It'll empower you to run smoother, more effective brainstorming sessions. This creative-thinking technique explores ideas by putting the main idea at the diagram center and ancillary concepts in the surrounding boxes. This template gives you an easy way to create Lotus Diagrams for brainstorms, as well as an infinite canvas for the endless ideas generated.
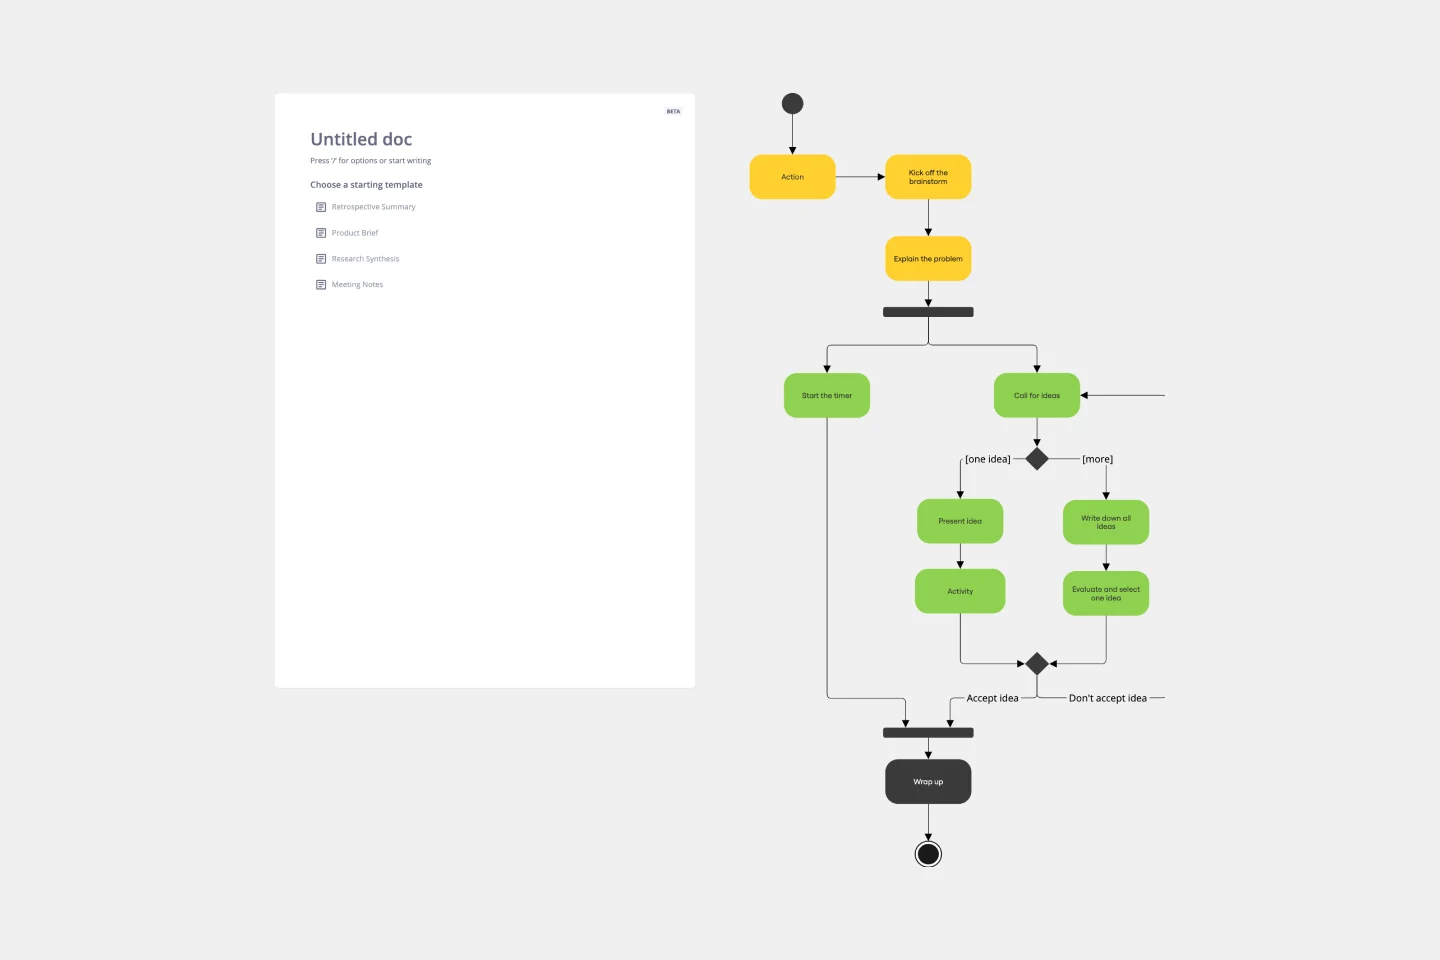
UML Activity Diagram Template
Works best for:
Diagrams
Use our Activity Diagram template to break down activities into smaller decisions and subprocesses. Improve and optimize systems and processes in I.T., business management, and more.
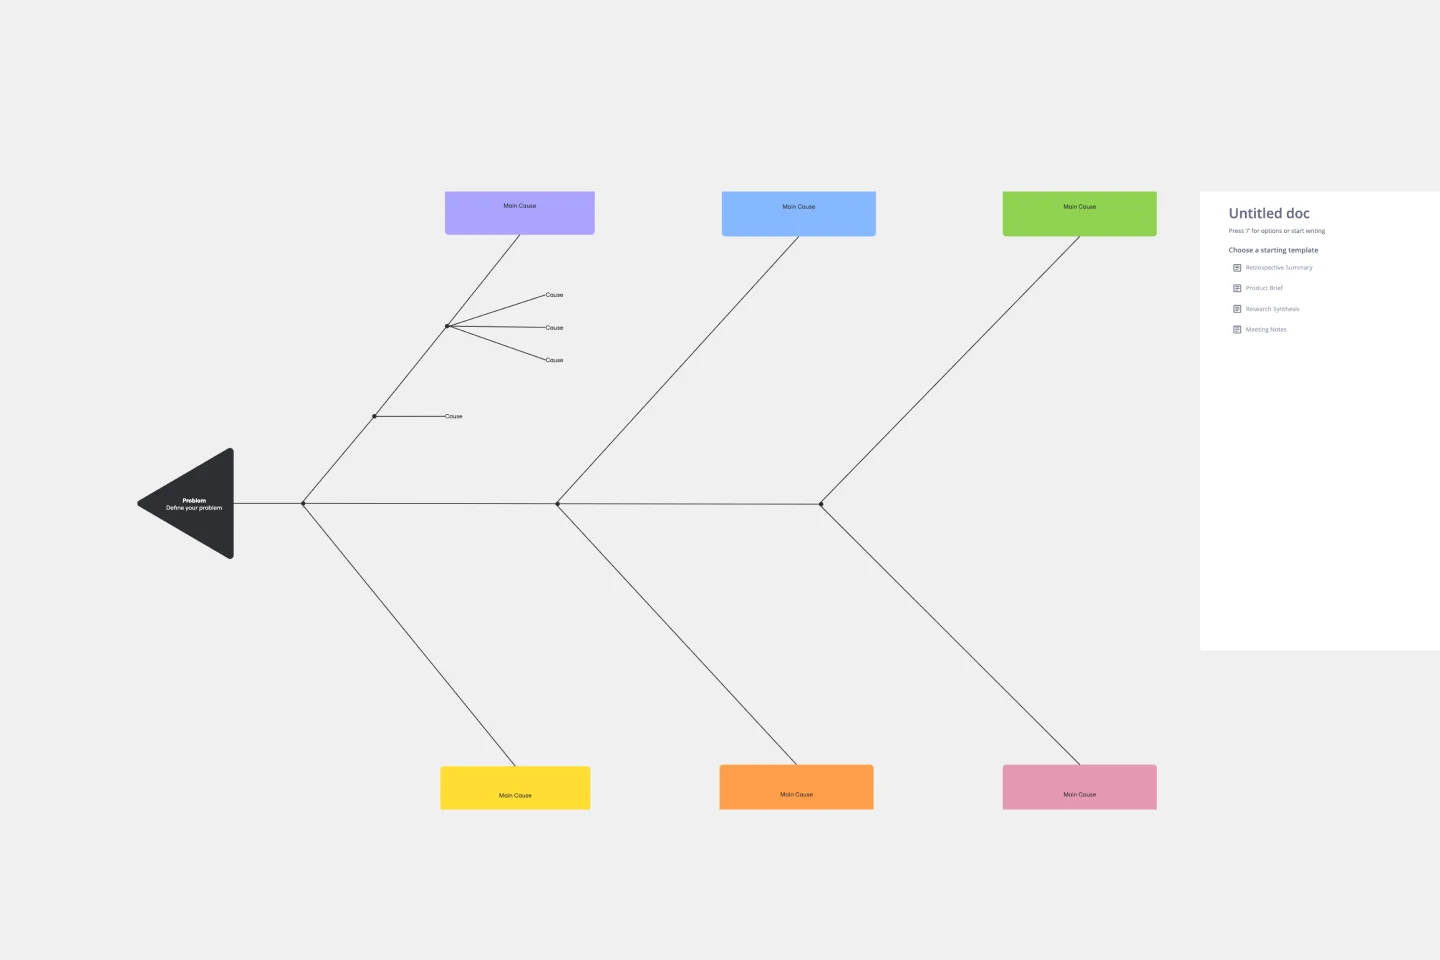
Cause and Effect Diagram Template
Works best for:
Diagramming
The Cause and Effect Diagram Template is a useful tool for analyzing complex relationships, identifying root causes of problems, and improving organizational processes. It can be customized to fit user's unique needs and provides a structured framework for analysis. Teams can use real-time collaborative analysis on the Miro platform to drive continuous improvement initiatives.
Current State vs. Future State Flowchart Template
Works best for:
Diagramming
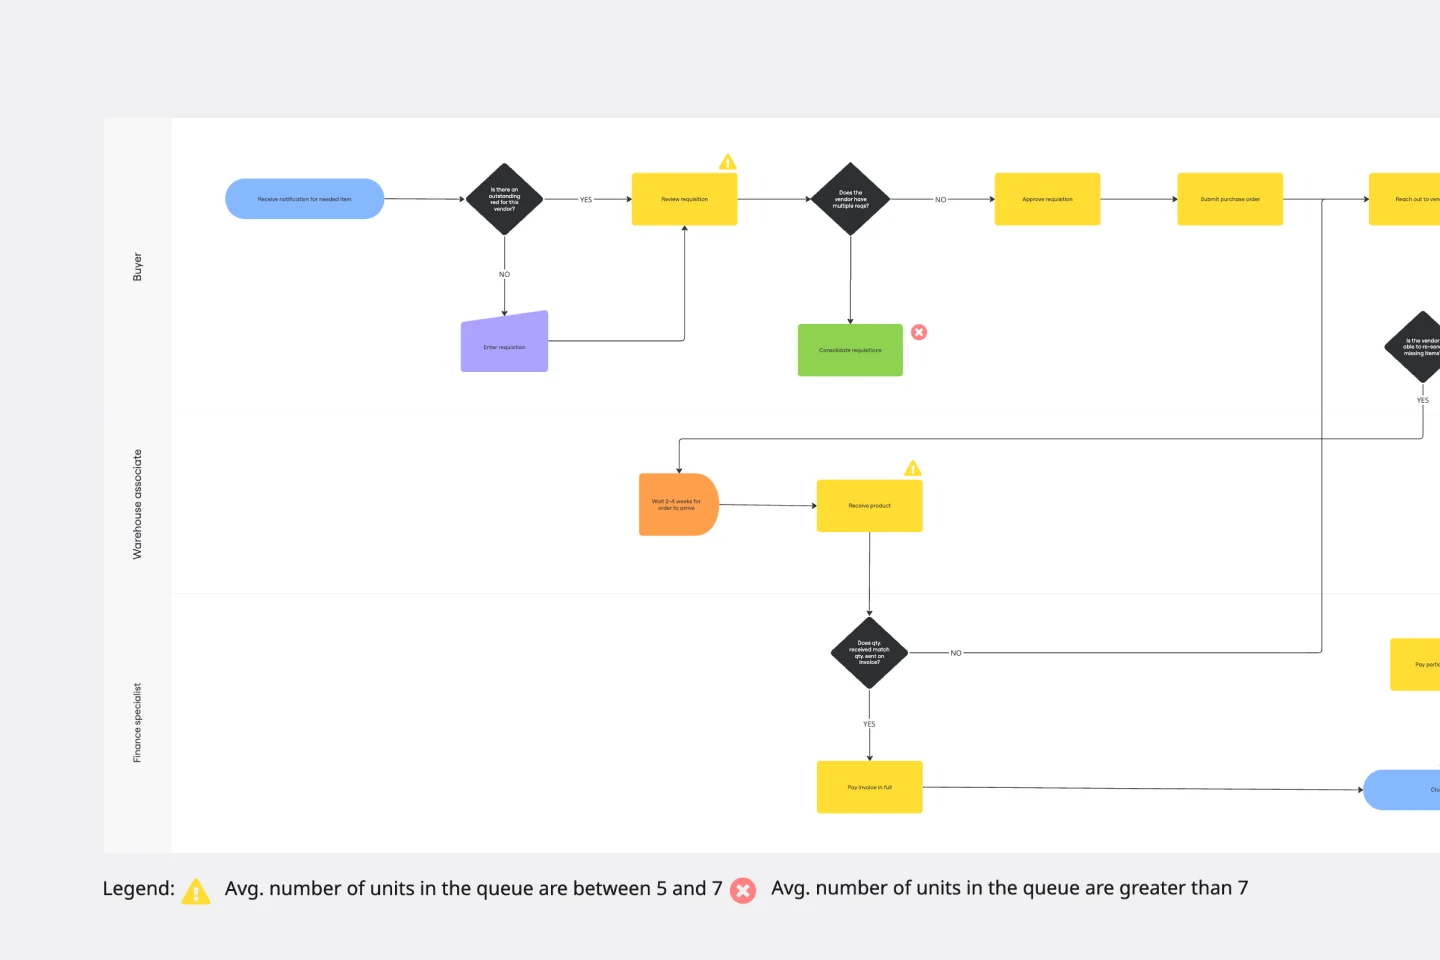
The Current State vs Future State Flowchart Template is an essential tool for strategic planning, providing teams with a dynamic and visual roadmap for organizational transformation. One of its key benefits is streamlining collaboration by using swimlanes to allocate tasks to specific departments. This feature promotes accountability and transparent communication, ensuring everyone is aligned on their responsibilities. As a result, teams can navigate complex processes with ease, fostering a shared understanding of the current and future states, ultimately leading to efficient and collaborative decision-making.
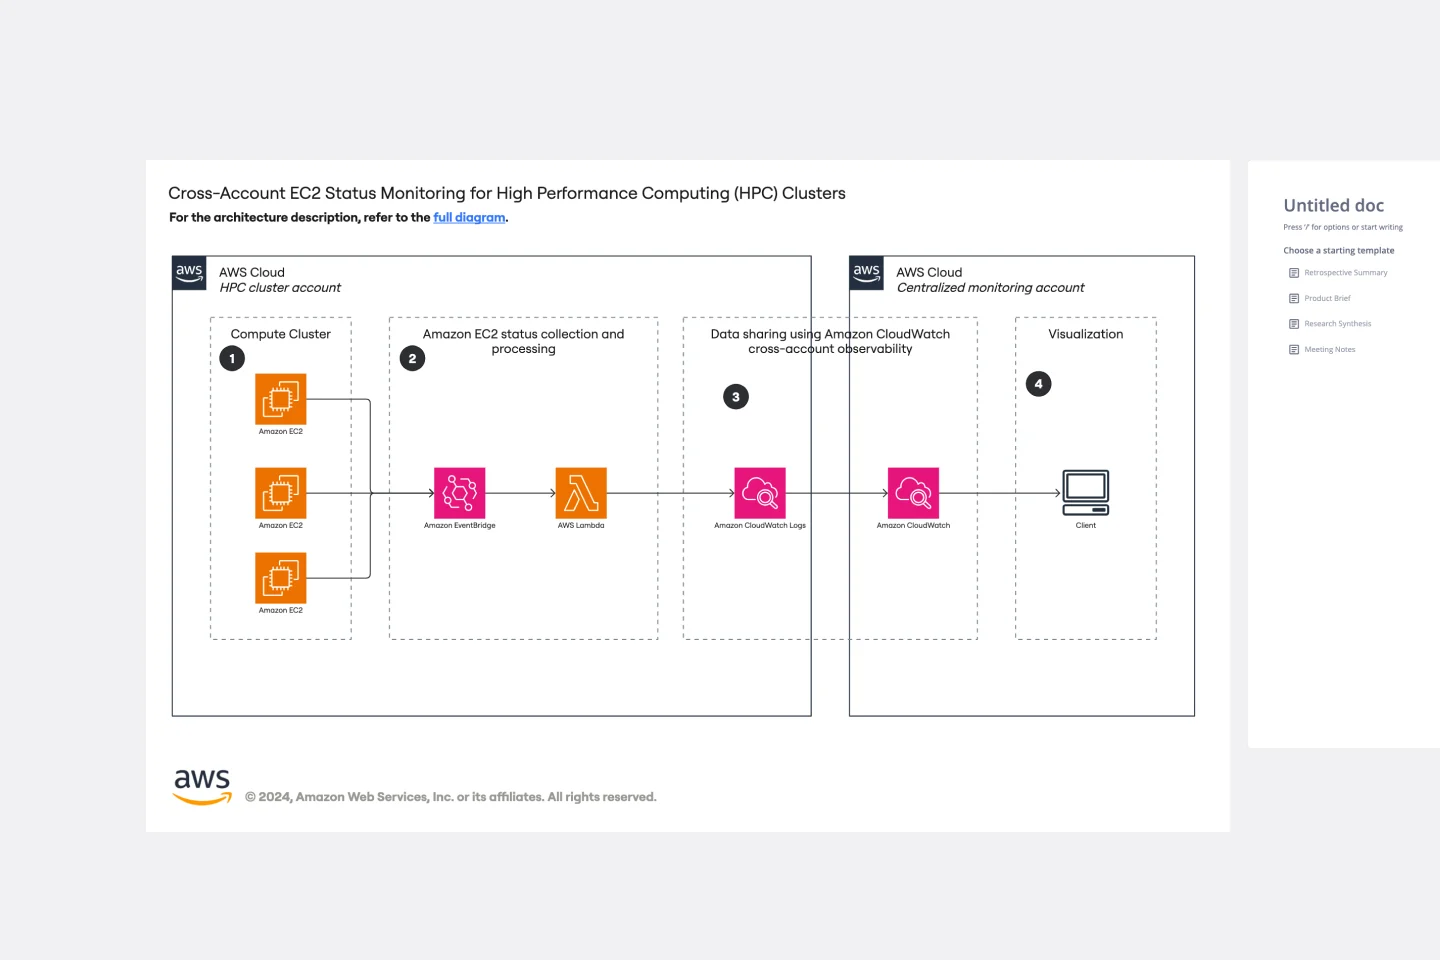
Cross-Account EC2 Status Monitoring for HPC Clusters Template
Works best for:
AWS
The Cross-Account EC2 Status Monitoring for HPC Clusters Template provides a centralized view of the health and performance of EC2 instances across multiple AWS accounts. It helps in early issue detection, reducing downtime and ensuring optimal efficiency of HPC clusters. The template offers customization options to meet specific HPC cluster configurations, simplifying monitoring and improving operational efficiency for administrators.
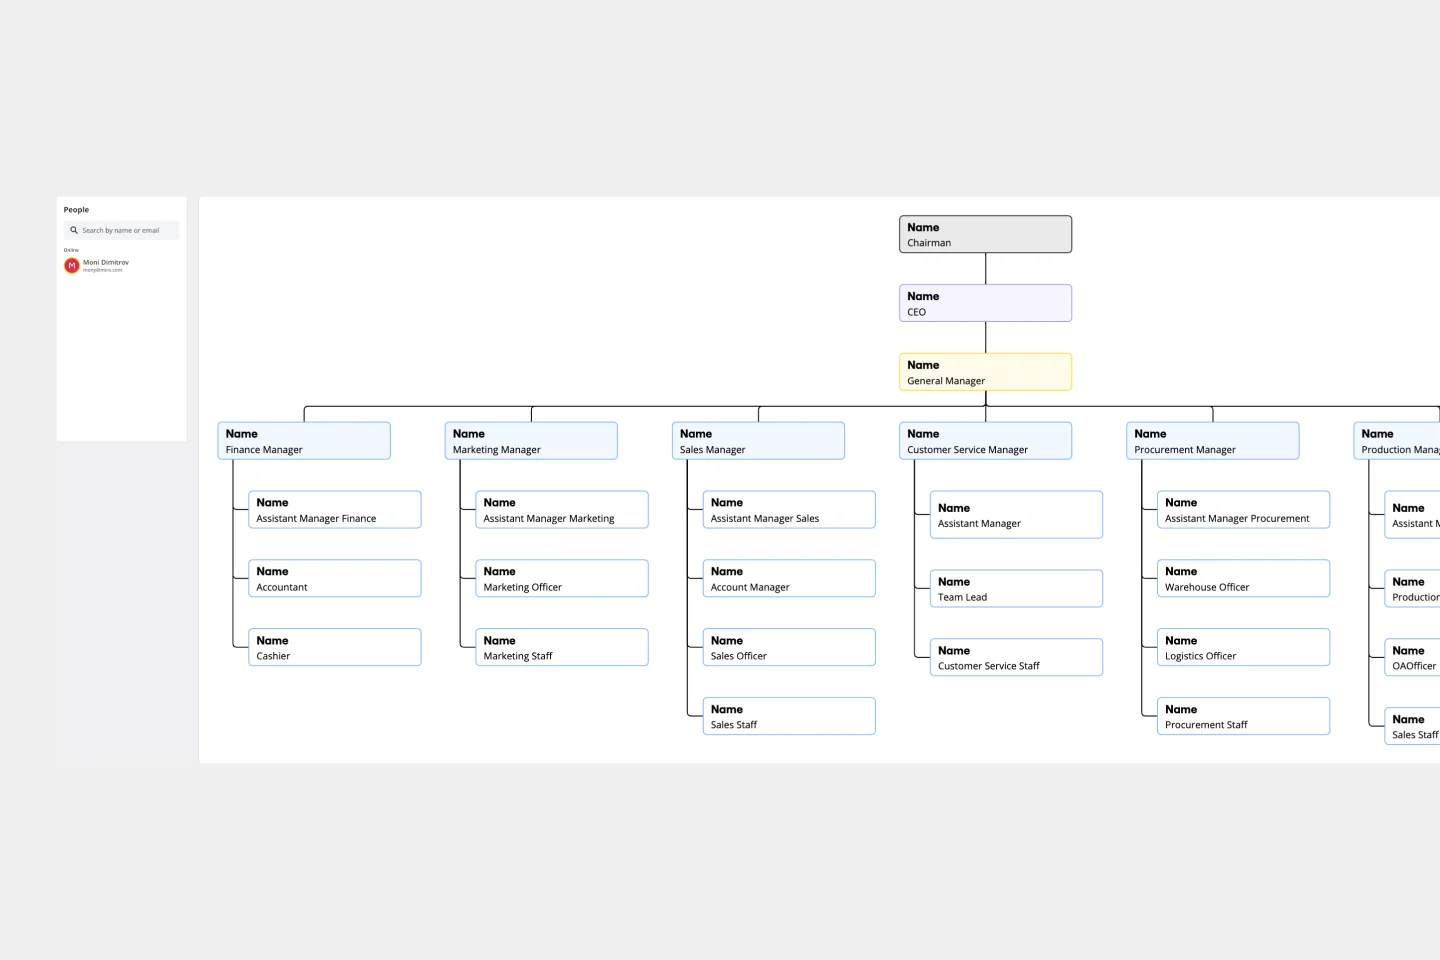
Vertical Organizational Chart
Works best for:
Organizational Charts, Organizational Design
The Vertical Organizational Chart Template is an efficient way to illustrate the hierarchy of an entity in a top-down format. This tool helps represent roles and relationships in a clear manner, starting from the topmost authority and branching downwards. It allows for a better understanding of the flow of responsibilities and communication channels within the organization. One of its most significant advantages is promoting clear communication. Depicting the organization's structure helps avoid misunderstandings and ensures everyone is on the same page regarding the chain of command.