BPMN Template
Manage operations at ease with the BPMN template. Bring agility to your team and improve communication, showing your business process graphically.
Available on Enterprise, Business, Education plans.
About the BPMN Template
BPMN, or Business Process Modeling Notation, is a method that project managers, business analysts, and other professionals can use to visualize end-to-end operations of a business process. BPMN diagrams use a standardized notation to represent processes, leading to better alignment and shared understanding.
Using a BPMN template can be your starting point when diagramming your organization’s business processes. You can also use Miro's BPMN tool to diagram from scratch if that is better suited to your needs.
What is the BPMN Template?
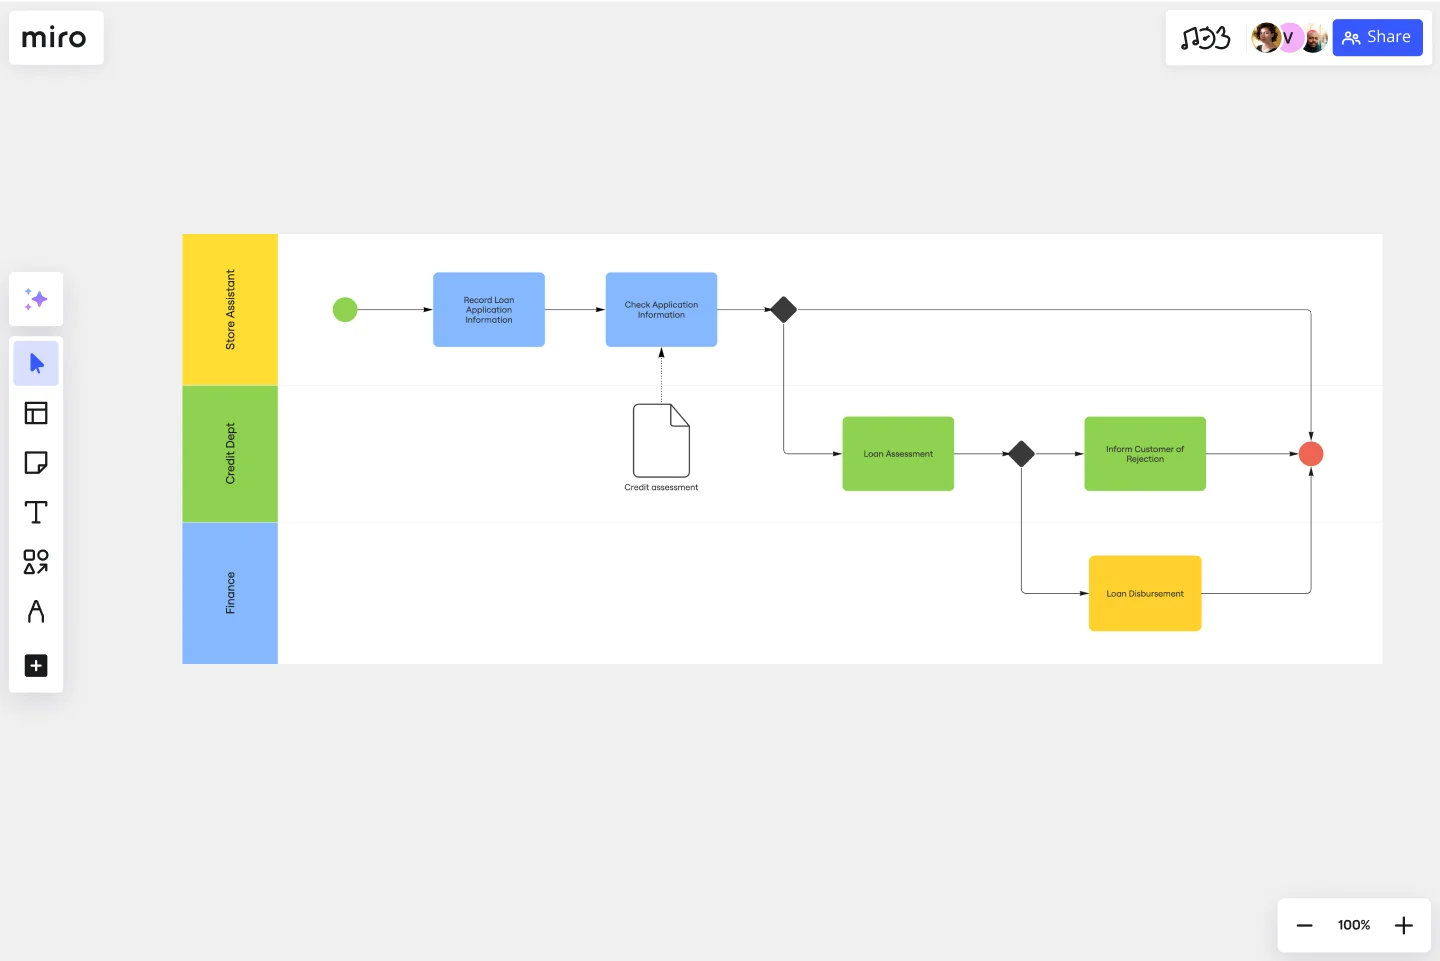
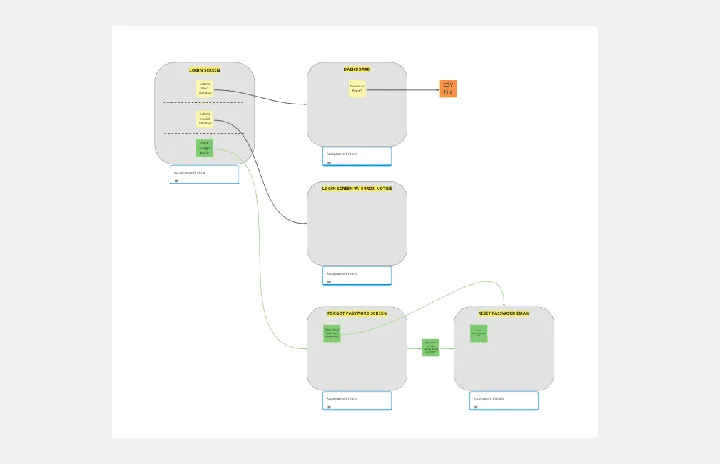
The BPMN template graphically shows your business process using standardized notations. This can be anything from recruitment to sales management.
The BPMN diagram template helps you build an overview of all the necessary steps needed to complete a business process and avoid miscommunication between teams and stakeholders. For that reason, it’s an excellent tool to bring agility to your team and move your projects forward.
When to use the BPMN Template
You can use the BPMN template to easily organize and keep track of your business process, keep everyone in the loop, and avoid misunderstandings.
Project managers can use the BPMN template to keep track of the process flow and identify any bottlenecks or unnecessary steps. Business analysts can use the template to create a BPMN diagram to track performance and identify opportunities. Many other professionals also use it to easily manage their business and keep their team’s efficiency high.
How to use the BPMN Template
You can use our BPMN template and edit it according to your organization’s needs. No matter the type of business or process you are mapping, there are some common considerations for all BPMN diagrams.
Here are some fundamentals found in the BPMN template:
1. Swimlanes for each participant or department
The template is set up using swimlanes, which can be used to represent different departments or teams. That way, you quickly see which functions are involved in each step and what they are accountable for.
2. Symbols and objects to identify flows
Objects in the BPMN template can signal flows, events, or activities. For example, rectangles represent actions or activities in the flow. Diamonds show that the flow can go in several directions. Circles represent the beginning, end, or change in the process.
3. Connection between the objects
Use arrows to connect the flow objects. Solid arrow lines represent a sequence (the order in which actions need to be taken). Dashed line arrows represent information shared between departments. Dotted line arrows show that a note is associated with a particular event or step.
4. Add artifacts
You can add extra information in case you need more details in one step or action. The artifacts can be about data or annotations about any given process step.
The advantages of using a BPMN template are that you can communicate with technical and non-technical stakeholders. Using a standard notation makes it easy to convey information to various teams implementing your business process.
Because the BPMN process flow diagram is easy to understand, project managers and business analysts can use this template to manage cross-functional teams and departments.
How do I create a BPMN diagram?
Creating a BPMN diagram in Miro is easy. You can start using the BPMN template and edit to customize it according to your needs. Before starting working on your BPMN diagram, be sure that you have determined the purpose of your diagram. What do you want to achieve with this business process? Secondly, make a list of all the steps and assign roles/departments to actions. After your process is defined, you can implement and track it. The BPMN diagram is where you can see any bottlenecks or unnecessary steps or departments involved. Make it a living document, a source of information that you can always consult and edit if necessary.
What is a BPMN diagram used for?
Many professionals use the BPMN diagram to track and monitor business processes effectively, get an overview the whole flow, avoid miscommunication across departments, and quickly identify any constraints or processes bottlenecks.
Get started with this template right now. Available on Enterprise, Business, Education plans.
Cisco Data Network Diagram Template
Works best for:
Software Development
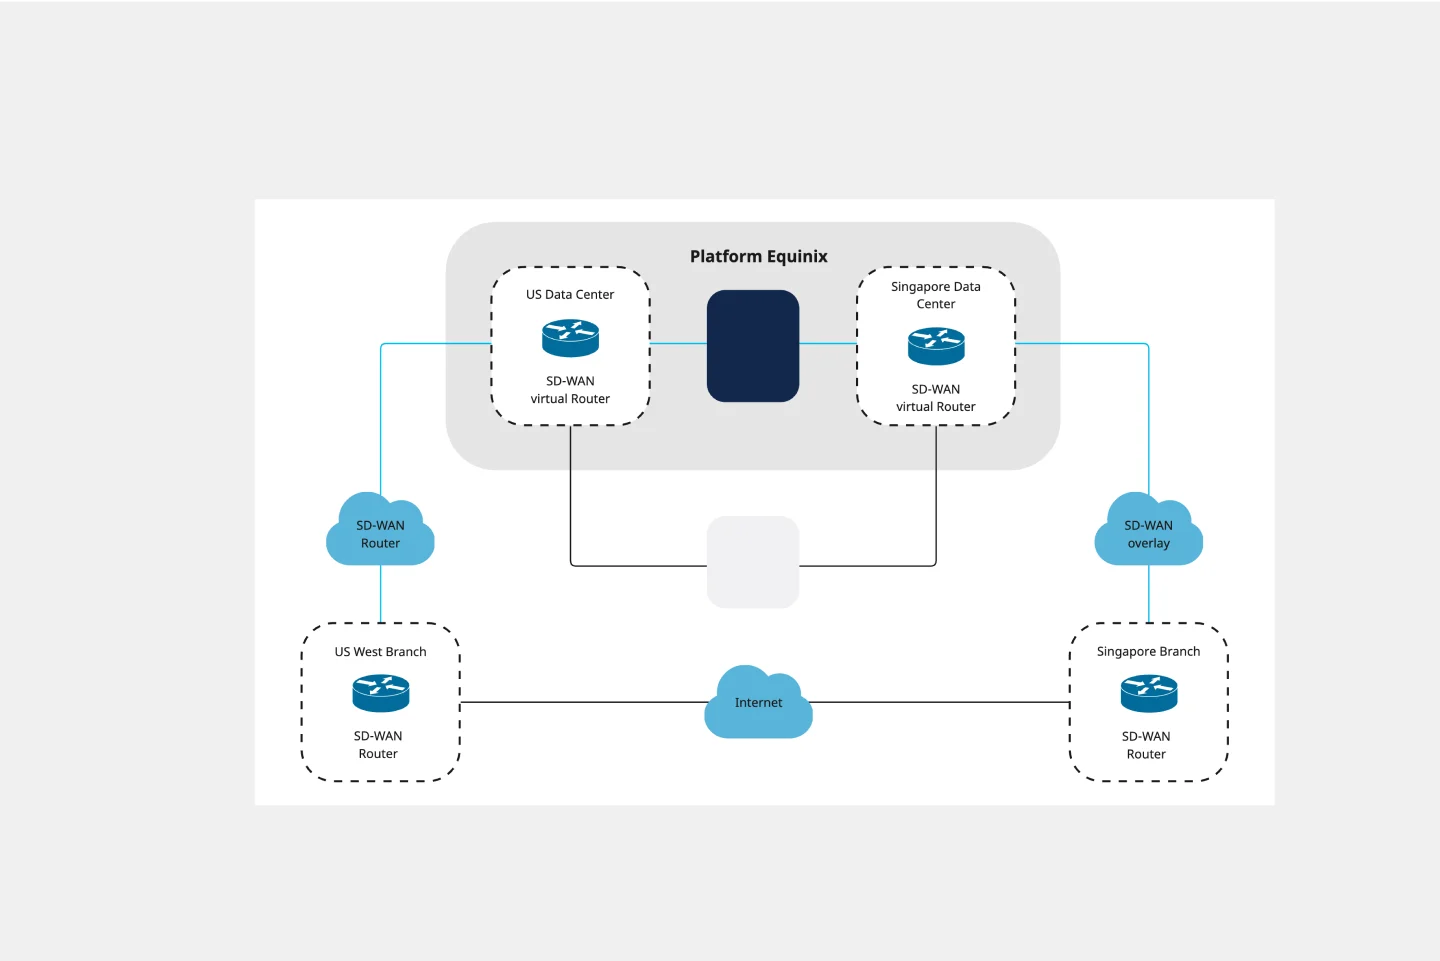
Cisco offers data center and access networking solutions built for scale with industry-leading automation, programmability, and real-time visibility. The Cisco Data Network Diagram uses Cisco elements to show the network design of Cisco Data Networks visually.
5-Circle Venn Diagram Template
Works best for:
Diagramming, Mapping, Brainstorming
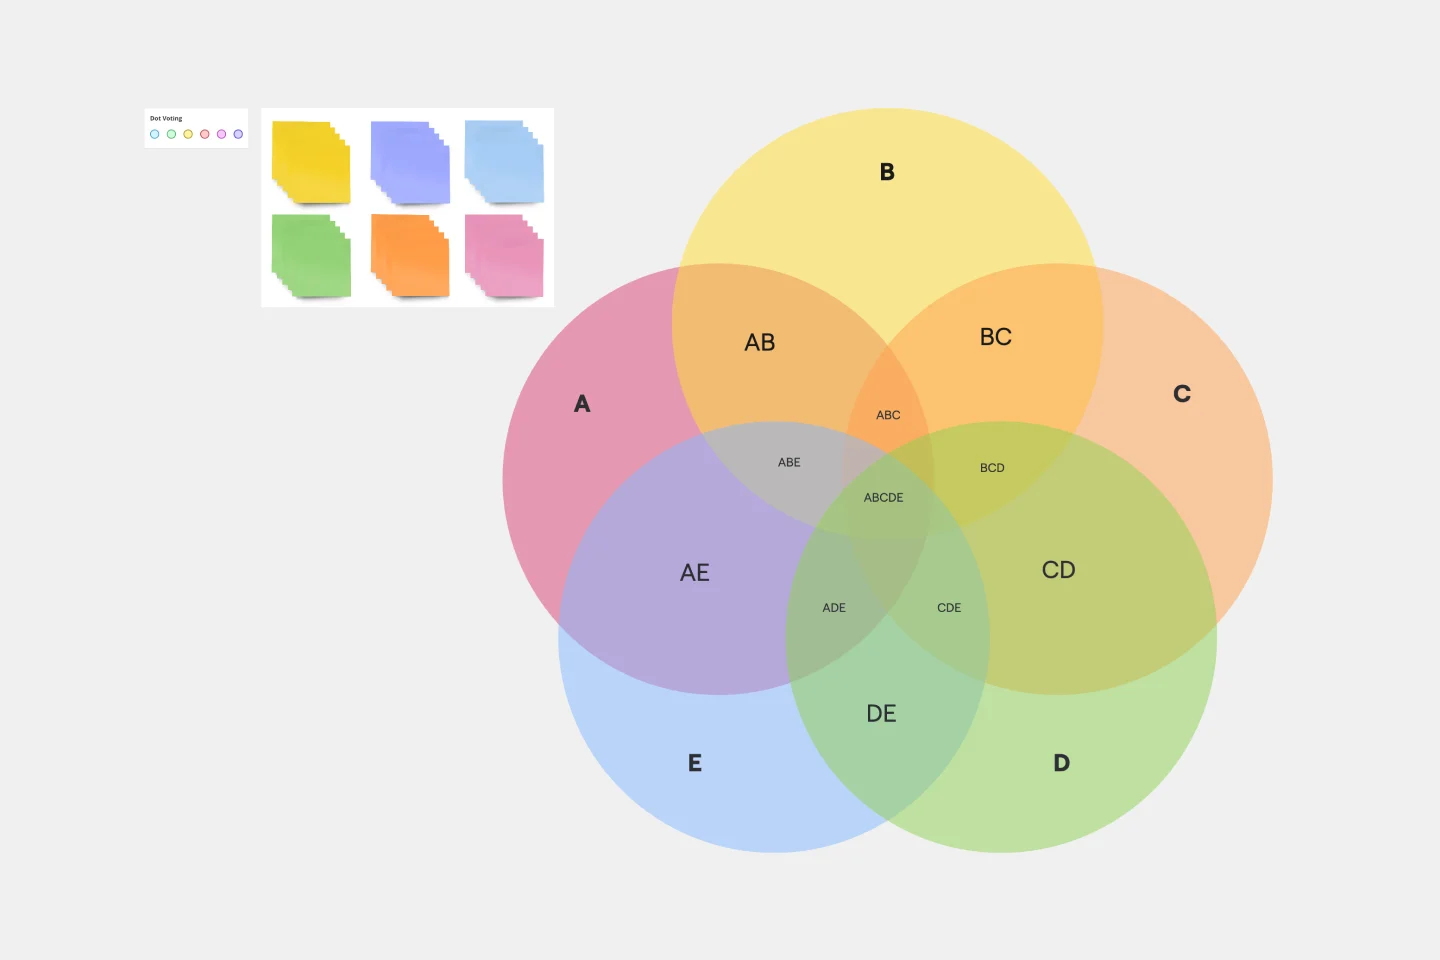
Discover how Miro's 5 Circle Venn Diagram Template can simplify complex decision-making processes. Learn how to create, customize, and share your diagrams for effective visual collaboration. Transform brainstorming sessions with real time, remote teamwork.
SAFe Program Board
Works best for:
Agile Methodology, Diagrams, Agile Workflows
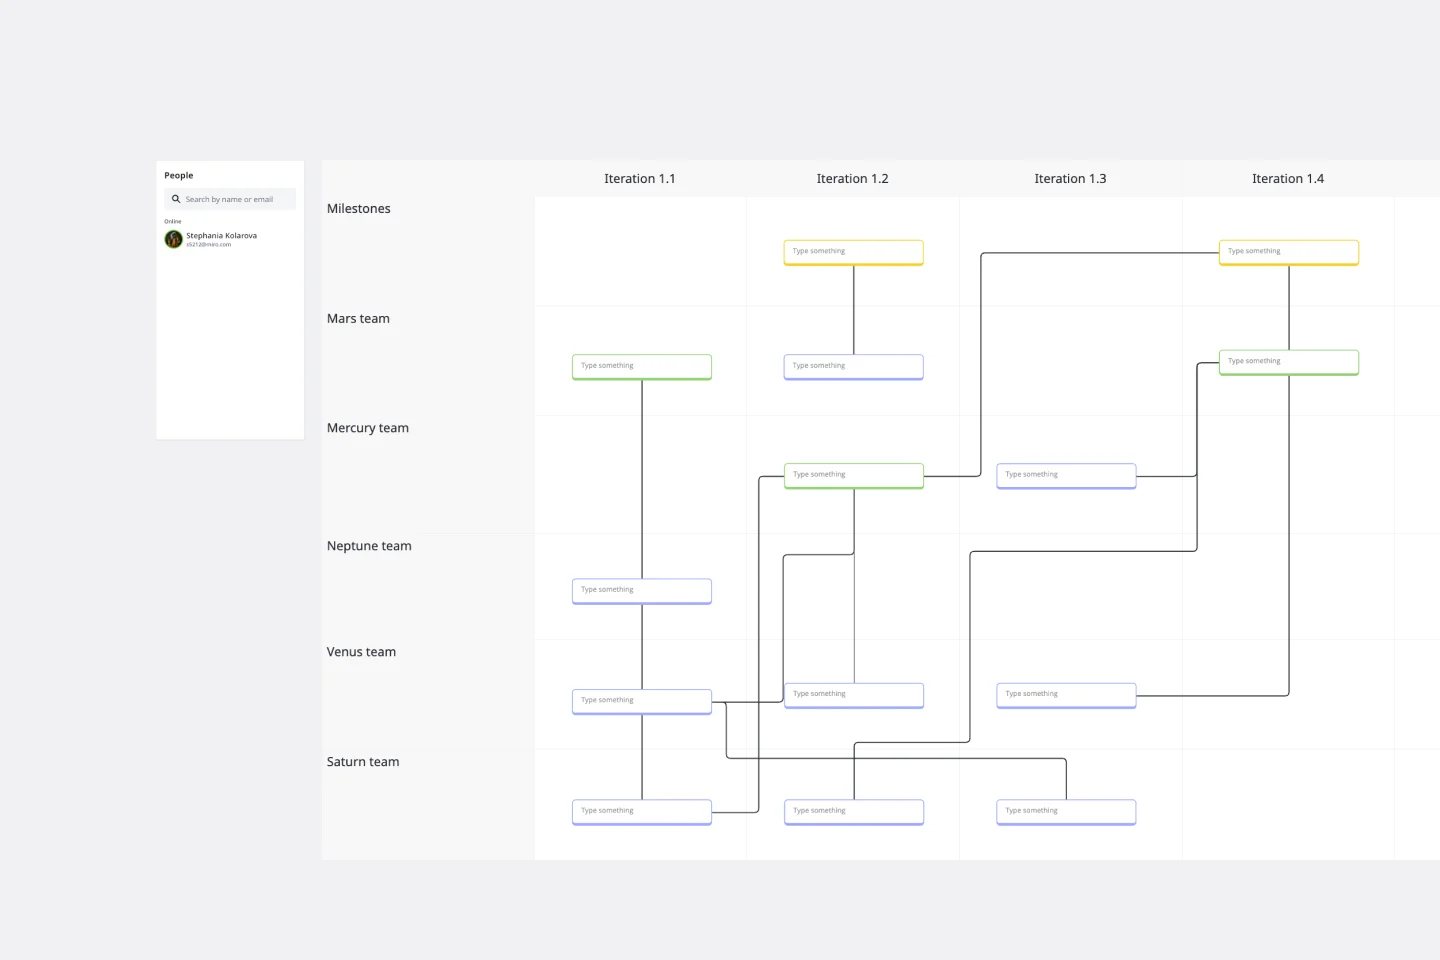
Many organizations use the Agile model, but even companies that don’t rigorously adhere to all Agile standards have adopted Agile tools and methods like Program Increment (PI) Planning. Even if you’re not participating in a formal PI session, a program board can be a great way to establish communication across teams and stakeholders, align development objectives with business goals, clarify dependencies, and foster cross-functional collaboration. The board provides much-needed structure to planning sessions, yet is adaptable enough to accommodate brainstorming and alignment meetings.
Azure Data Flow Template
Works best for:
Software Development, Diagrams
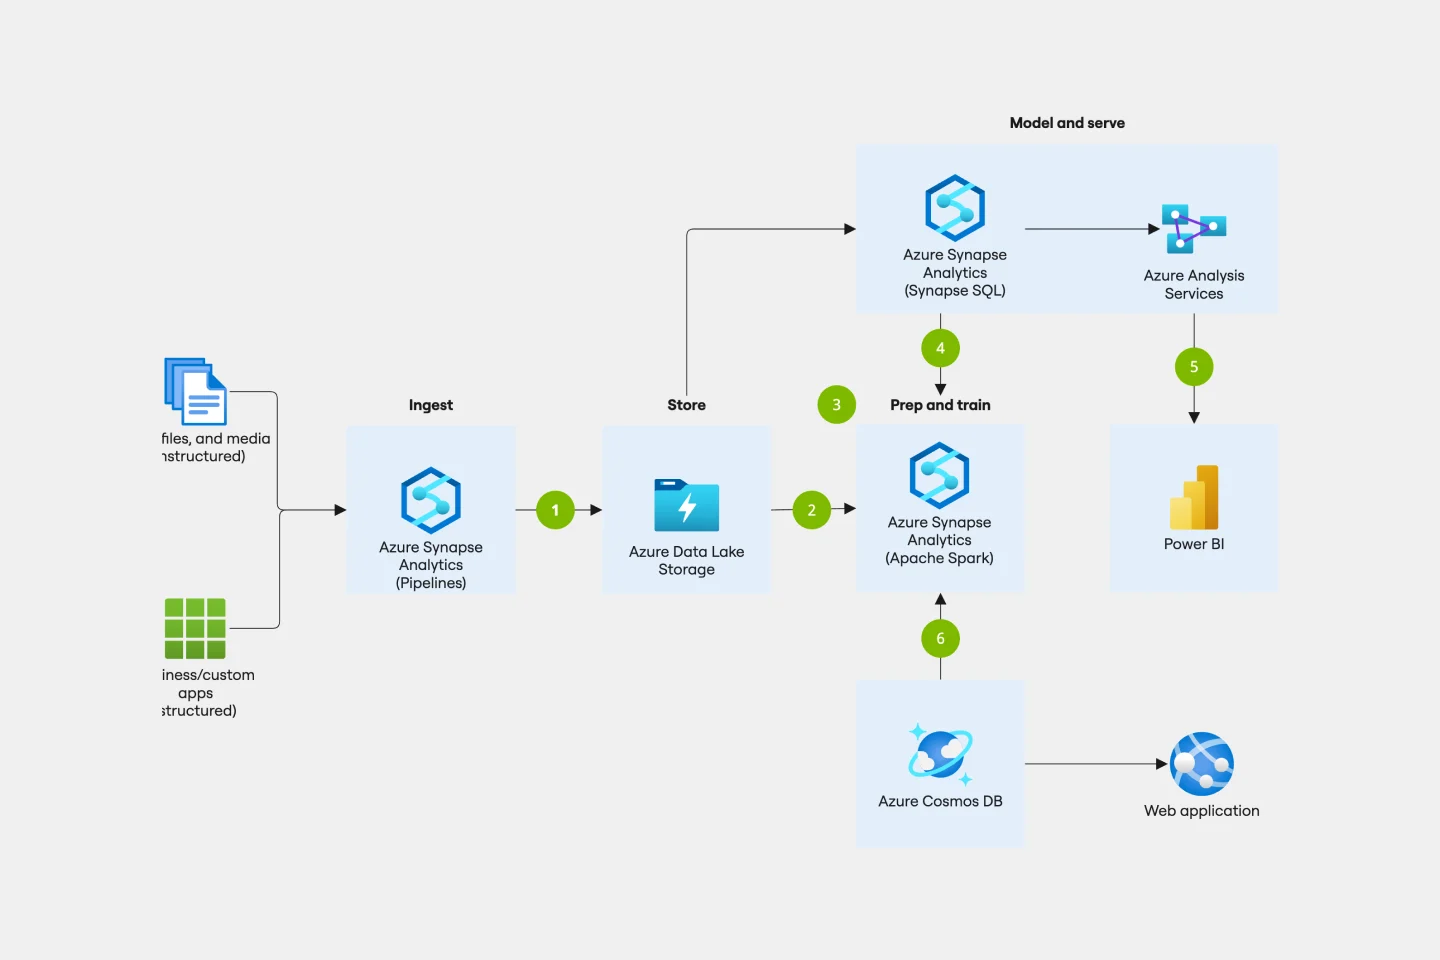
The Azure Data Flow is a diagram that will allow you to combine data and build and deploy custom machine learning models at scale. Azure is Microsoft’s cloud computing platform, designed to provide many cloud-based services like remote storage, database hosting, and centralized account management. Azure also offers new capabilities like AI and the Internet of Things (IoT).
HEART Framework Template
Works best for:
Desk Research, Project Management, User Experience
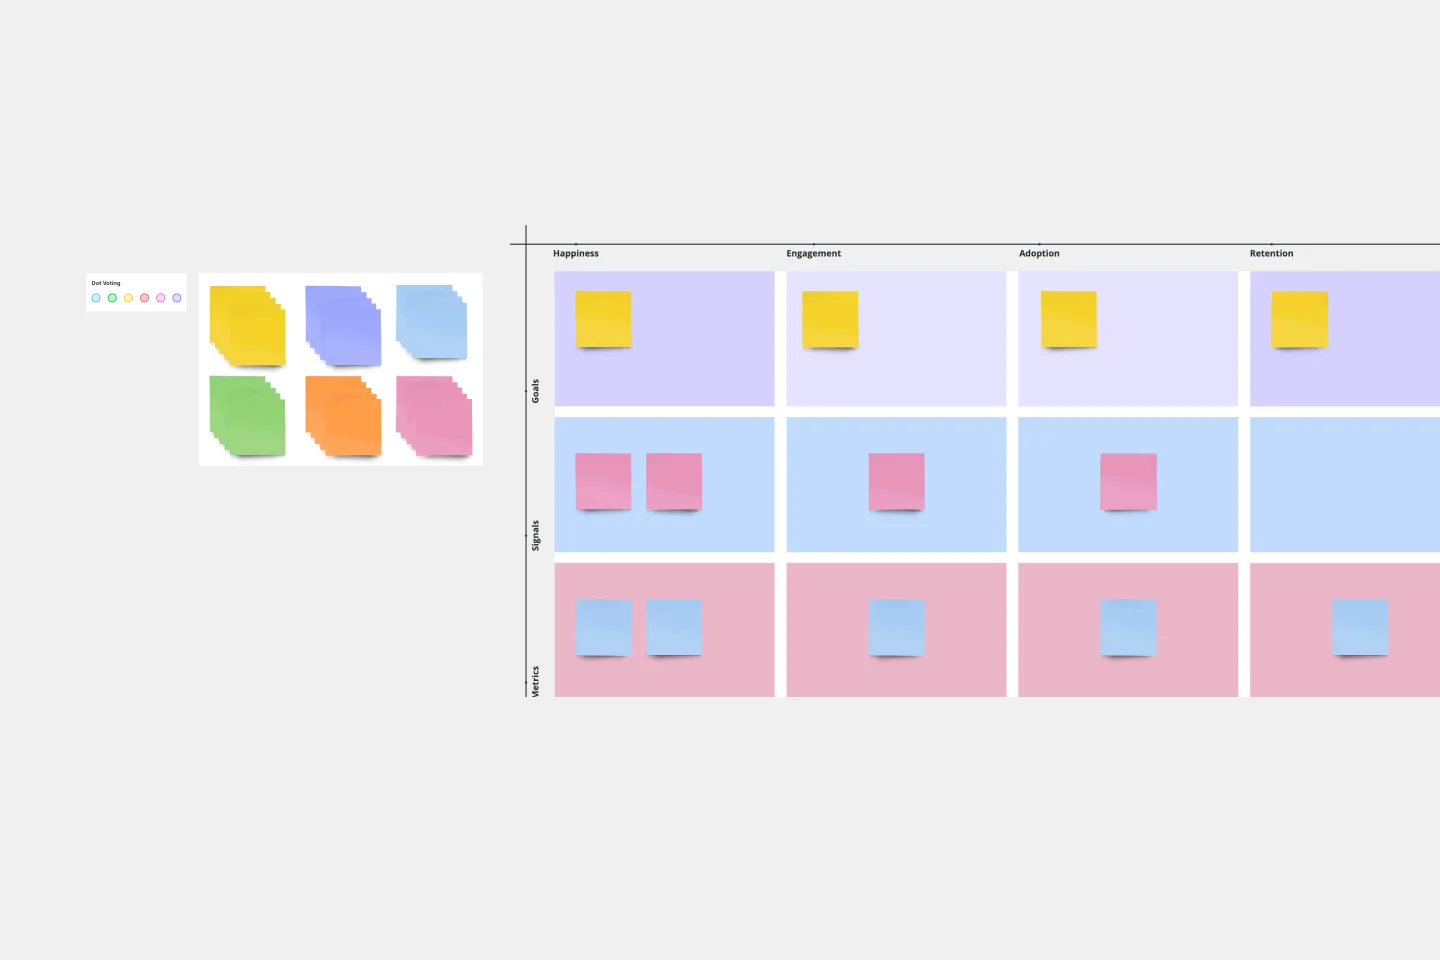
Happiness, Engagement, Adoption, Retention, and Task Success. Those are the pillars of user experience — which is why they serve as the key metrics in the HEART framework. Developed by the research team at Google, this framework gives larger companies an accurate way to measure user experience at scale, which you can then reference throughout the product development lifecycle. While the HEART framework uses five metrics, you might not need all five for every project — choose the ones that will be most useful for your company and project.
Breadboard (UI Flow Diagram)
Works best for:
Diagramming
The Breadboard (UI Flow Diagram) template offers a visual framework for designing and prototyping user interfaces (UIs) using the breadboard method. It provides elements for arranging UI components and defining user interactions. This template enables designers and developers to create interactive UI prototypes quickly and iteratively, facilitating user testing and feedback. By promoting rapid prototyping and experimentation, the Breadboard (UI Flow Diagram) empowers teams to design intuitive and user-friendly digital experiences effectively.