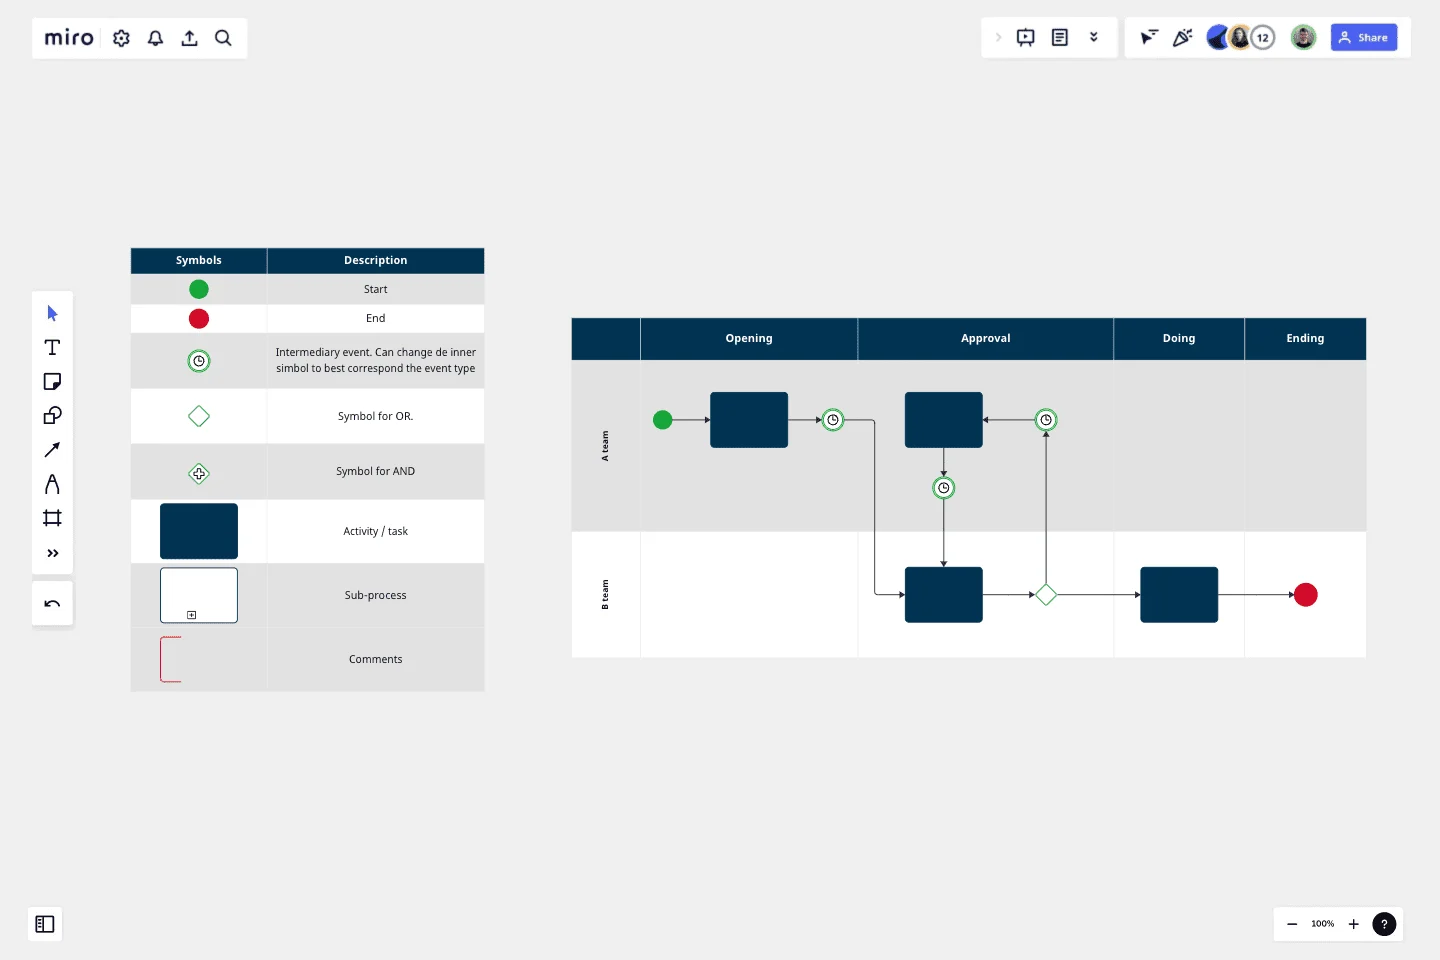
BPM
Simplified business process model based on BPMN rules. Beautiful, easy to use and customizable.
We recommend you to organize tasks into 4 big stages: Opening, approval, doing and ending. This helps to organize, understand and validate the process with users.
This is the last model you will need to use to diagram using BPM notations.
This template was created by Antonio Carelli.
Get started with this template right now.
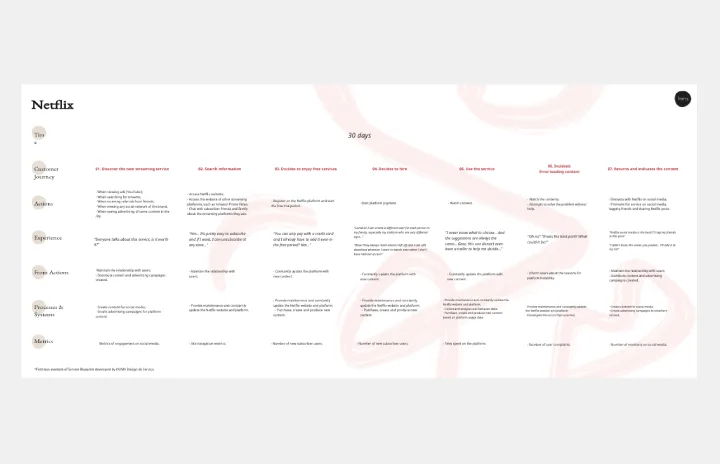
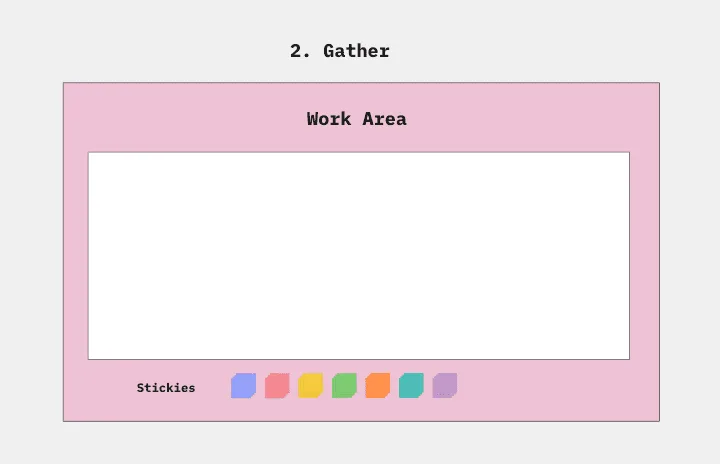
Service Blueprint by Bruna Plentz
Works best for:
Research & Design
Utilize the Service Blueprint template to visualize and optimize your service processes. This template captures interactions between customers and service elements, helping you identify areas for improvement. It's ideal for teams aiming to enhance service delivery by aligning processes, identifying inefficiencies, and fostering a comprehensive understanding of the service journey. Perfect for creating a cohesive service strategy.
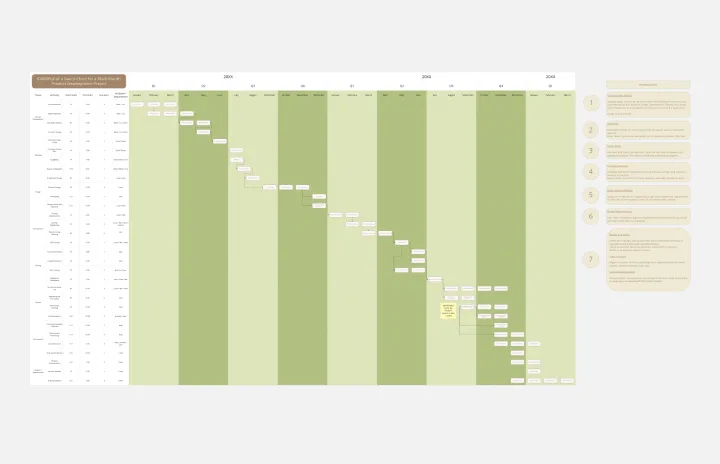
Product Development Gantt Chart
Works best for:
Gantt Chart, Planning
Developing a new product involves many steps and stakeholders. The Product Development Gantt Chart template helps you manage this complex process efficiently. Use it to outline each phase of development, set timelines, and assign responsibilities. Track progress and make adjustments as needed to stay on schedule. This template provides a clear visual representation, coordinating tasks for a successful product launch.
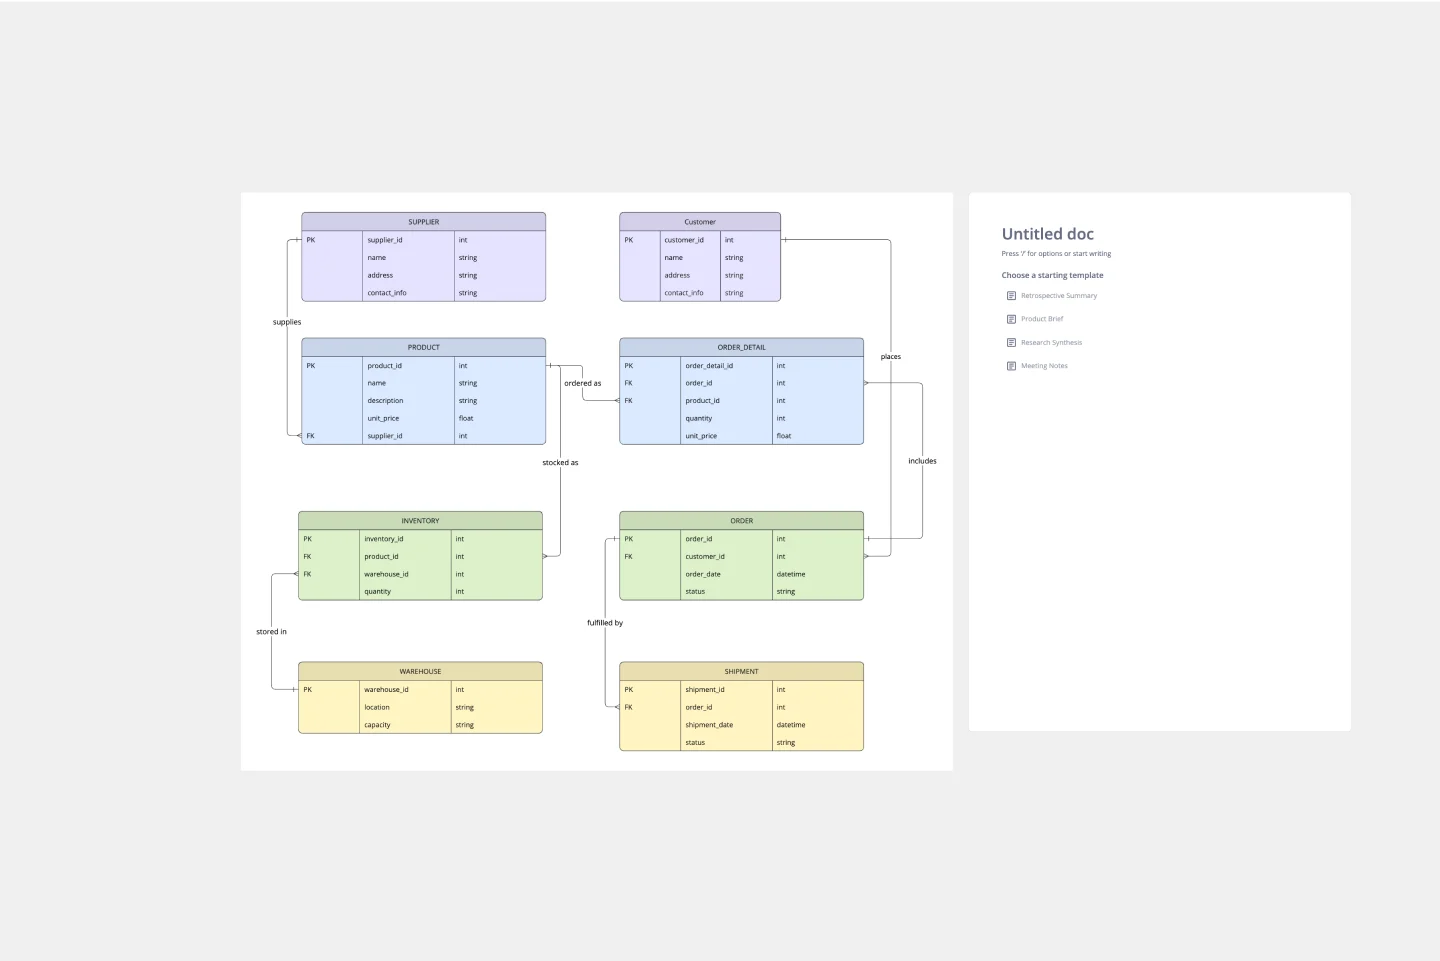
ERD Supply Chain Management System Template
Works best for:
ERD
The ERD Supply Chain Management System Template streamlines and optimizes supply chain operations. It serves as a visual support that helps businesses understand and manage the complex relationships between different entities within their supply chain, such as suppliers, products, inventory, orders, and shipments. By providing a clear visualization of these relationships, the template enables users to identify inefficiencies and areas for improvement, facilitating strategic decision-making.
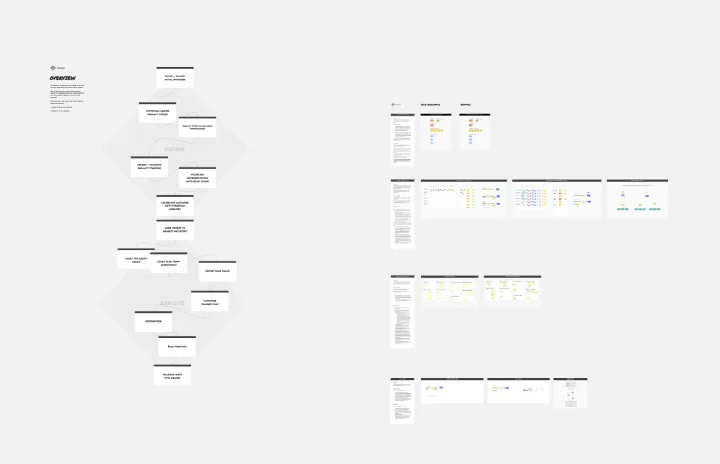
Affinity Diagram by UserPeek
Works best for:
Diagramming
The Affinity Diagram template is a visual tool for organizing and categorizing ideas, data, or issues into related groups. It provides a structured framework for conducting group brainstorming and affinity grouping activities. This template enables teams to synthesize information, identify patterns, and generate insights collaboratively. By promoting creativity and collaboration, the Affinity Diagram empowers teams to organize and prioritize information effectively, driving decision-making and problem-solving processes efficiently.
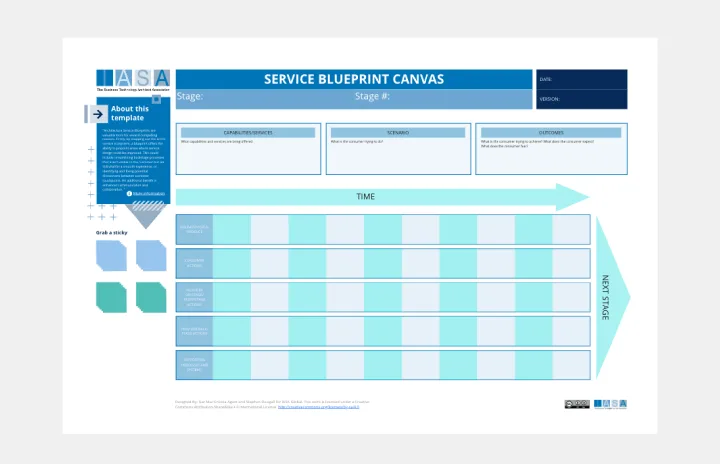
Service Blueprint Canvas
Works best for:
Research & Design
The IASA Service Blueprint Canvas helps visualize service interactions and processes in detail. This template is perfect for analyzing and improving service delivery. Use it to align teams, identify pain points, and enhance customer experiences. It's ideal for creating a shared understanding of service dynamics and fostering collaboration among stakeholders, ensuring a seamless and efficient service delivery process.
Product Thinking Board
Works best for:
Product Management, Planning
Product Thinking Board template encourages a user-centered approach to product development. By fostering empathy, collaboration, and experimentation, this template stimulates innovative thinking and problem-solving. With sections for user research, ideation, and prototyping, it supports iterative product design and validation. This template serves as a visual framework for product teams to engage in user-centric design thinking processes, driving the creation of products that truly meet user needs and deliver exceptional experiences.