BCG Matrix Template
Analyze ways to spur business growth and capture market share with the BCG matrix template.
About the BCG Matrix Template
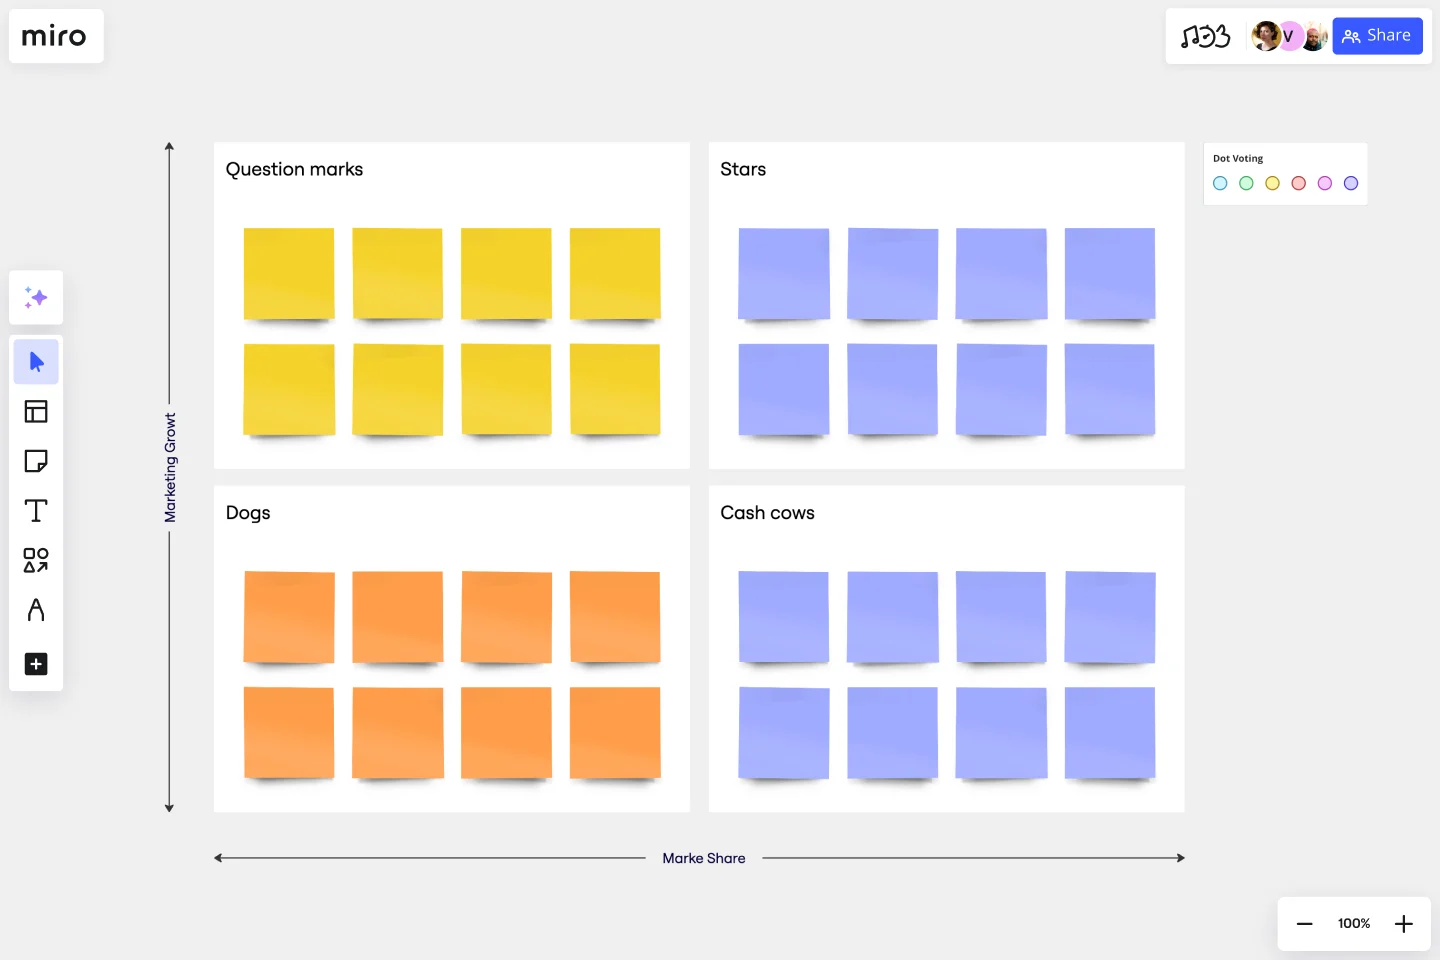
The BCG matrix template is a four-quadrant grid that allows businesses to visualize where and how they can grow their market share. Businesses can use this template to see where they currently stand in the marketplace. In doing this, they can also identify the best areas for growth.
What is a BCG matrix?
Created by the Boston Consulting Group, the BCG matrix (also known as the Boston matrix or growth-share matrix) is a strategic planning tool. The BCG matrix divides business units and products into one of four categories based on their market shares. With this information, businesses get an insight into which products can help them capitalize on market share growth opportunities.
What are the two measurements used in the BCG matrix?
There are two key measurements used in the BCG matrix: analyzing the market growth rate and reviewing relative market share.
Market growth rate: This measurement looks at the level of revenue growth within the marketplace. It usually compares growth with the previous year to predict future growth.
Relative market share: This measurement analyzes your current position in the marketplace in relation to your largest competitor.
Reviewing these measurements allows you to identify likely opportunities for growth. It also helps you find any problem areas or areas of improvement in your existing products.
4 elements of a BCG matrix template
If you’re working with a product portfolio, a BCG growth-share matrix can give you a quick overview of how products are performing and help you build a basis for further analysis. To use the chart, analysts plot a scatter graph to rank business units (or products) according to their relative market shares and growth rates.
1. Cash cows
These are products or business units with a high market share in a slow-growing industry. These units typically generate cash above the amount needed to maintain the business.
2. Dogs
Dogs are units with a low market share in a mature, low-growth industry. These units typically "break even," generating barely enough cash to maintain the business's market share. Many investors choose to sell off dogs.
3. Question marks
Also called “problem children,” question marks operate in a high-growth market yet maintain a low market share. They could potentially gain market share, become stars, and then become cash cows. Question marks should be analyzed carefully to determine whether they are worth the investment required to grow market share.
4. Stars
Stars are units with a high market share in a fast-growing industry. They have graduated from question marks with a market- or niche-leading trajectory.
How do you use a BCG matrix template?
Miro is the perfect tool to create and share your BCG matrix. Get started by selecting this BCG matrix template. The simple template allows you to collaborate on portfolio analysis in real-time and takes only a minute to set up. A completed matrix can be used to assess the strength of your organization and its product portfolio.
To give you an idea of how to create your own BCG matrix using our template, we’ve outlined a simple step-by-step guide.
Step 1: Choose the product. Start by identifying the product or services you want to analyze with the matrix.
Step 2: Define the market. To use the BCG matrix template effectively, you must define your market correctly. If you don’t, the results from the matrix won’t be accurate. To ensure you’ve got a good handle on the market you need to review, we suggest doing a market analysis.
The process involves performing a quantitative and qualitative assessment of the market. It looks at the size of the market, the target audience, the competition, and the economic environment.
Step 3: Calculate the relative market share. Find out how you currently stand by calculating your relative market share. Here’s the formula you need:
Relative market share = your market share / your largest competitor’s market share.
Step 4: Find out the market growth rate. Figure out how much the marketplace has grown over the last year using this formula:
Market growth rate = total sales in current year / total sales from previous year.
Step 5: Add all the information to the matrix. You’ve done the legwork — now it’s time to put all the information in the matrix template. Then, you can use Miro’s easy collaboration features to share it with your team, stakeholders, and anyone else who would benefit from seeing it.
Examples of when to use a BCG matrix
Your organization can find a BCG matrix useful in several areas: marketing, project management, and strategic management. Typically, the matrix is used during the strategic planning phase of a marketing plan or project. It can also be used for business portfolio analysis.
Let’s take a look at some examples:
1. To increase investment in a product to capture additional market share. If one of your products sits in the question mark category, you know that investing in this product is likely to get an increase in market share.
2. To determine whether you should pause investment in a certain product. If a product sits in the dog category, you know that you’re not likely to see a lot of growth. If you’re looking to pause investment, products in this section would be your best bet.
3. To maximize cash flow from a product. Using the matrix, you can see which products are your top performers, otherwise known as star products. These are the big sellers with the most market share, so you can use the matrix to identify which products yield the highest revenue.
4. To best allocate resources. The matrix shows you which products are worth investing time, money, and resources in so that you have the best chances of turning a profit. For businesses operating in a competitive landscape, this is incredibly helpful.
Typically speaking, the matrix is better suited for large businesses. In smaller businesses, relative market share can be too small to quantify. It’s also based on the idea that market share can be achieved by spending more on the marketing budget. If you have a limited budget, you might be restricted in how you can use the BCG matrix.
If you’re a small business, we’d suggest using a SWOT analysis instead.
What are the four quadrants of the BCG matrix?
The four quadrants of a BCG matrix are cash cows (high market share, slow growth), dogs (low market share, low growth), question marks (high market share, low growth), and stars (high market share, high growth).
How do you use the BCG matrix model?
The BCG matrix model is used to assess the quality of investments in a business portfolio and their potential for future profitability. A BCG matrix is useful because it assesses the external environment and is best paired with other forms of internal analysis that assess the quality and state of the investments themselves.
Get started with this template right now.
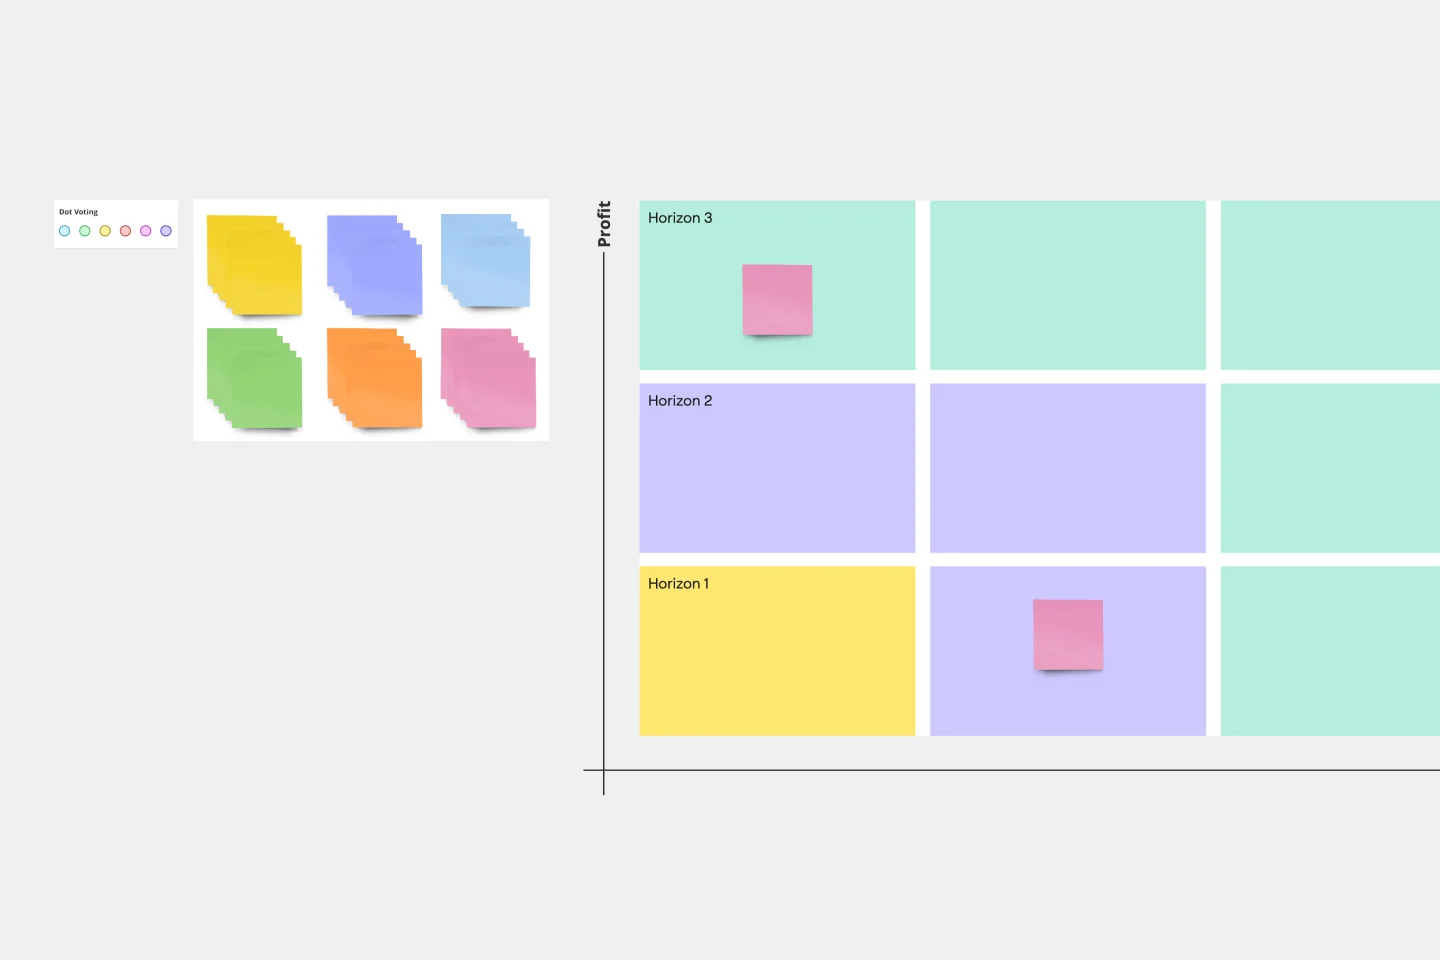
3 Horizons of Growth Template
Works best for:
Leadership, Strategic Planning, Project Planning
Featured in The Alchemy of Growth, this model gives ambitious companies a way to balance the present and the future—in other words, what’s working in the existing business and what emerging, possibly-profitable growth opportunities lie ahead. Then teams across the organization can make sure that their projects map to and support the organization’s goals. The 3 Horizons of Growth model is also a powerful way to foster a culture of innovation—one that values and depends on experimentation and iteration—and to identify opportunities for new business.
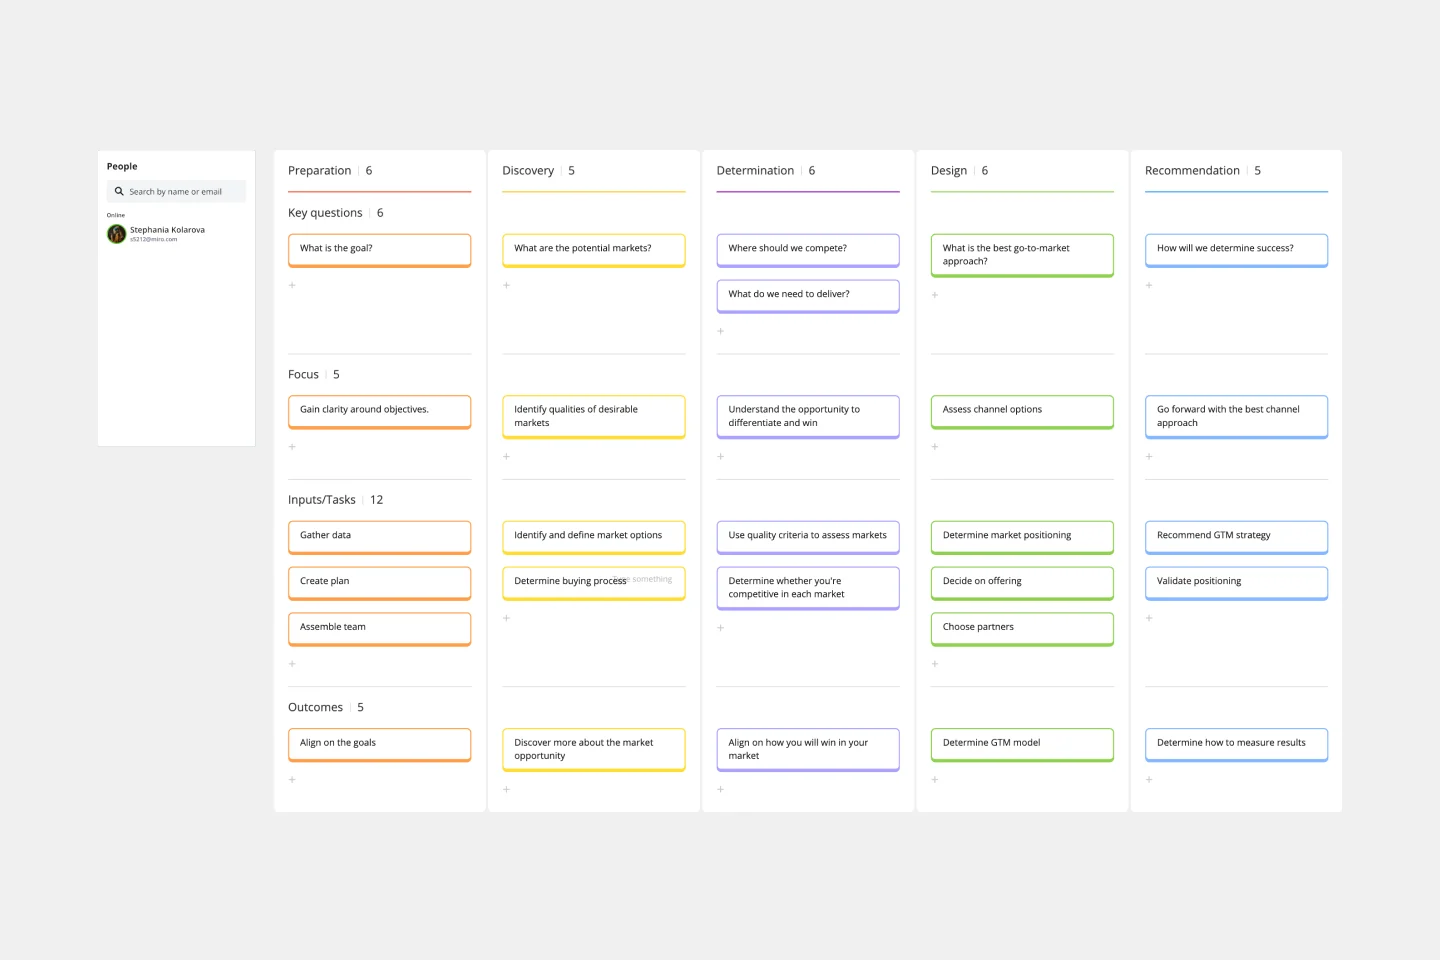
Go-to-Market GTM Template | Miro
Works best for:
Marketing, Desk Research, Strategic Planning
It doesn’t matter how innovative or effective a new product is — if it doesn’t get noticed and adopted by the right audience, the product won’t get off the ground. That’s where your Go-to-Market Strategy comes in. It’s a single resource that houses all of your research, insights, and data, and includes your business plan, target audience, marketing approach, and sales strategy. A GTM is especially important for any startups who grow fast, have to make split-second decisions, and have to be fully in sync.
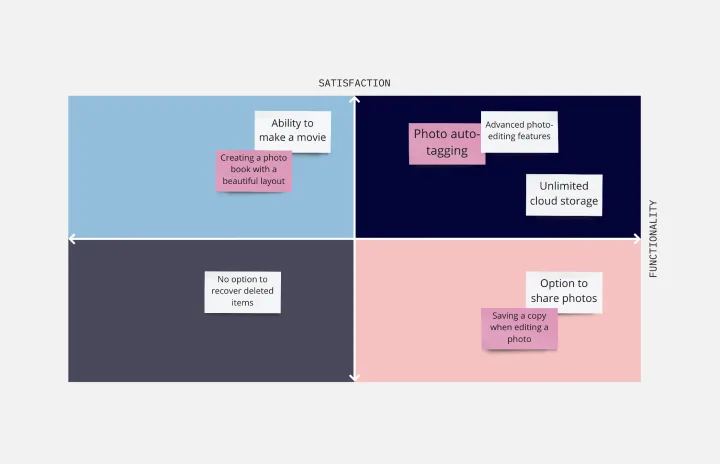
Kano Model Template
Works best for:
Desk Research, Product Management, Prioritization
When it comes down to it, a product’s success is determined by the features it offers and the satisfaction it gives to customers. So which features matter most? The Kano model will help you decide. It’s a simple, powerful method for helping you prioritize all your features — by comparing how much satisfaction a feature will deliver to what it will cost to implement. This template lets you easily create a standard Kano model, with two axes (satisfaction and functionality) creating a quadrant with four values: attractive, performance, indifferent, and must-be.
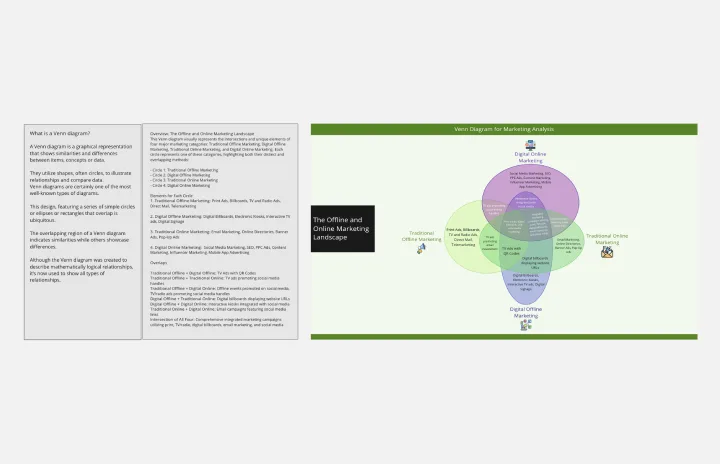
Venn Diagram for Marketing Analysis
Works best for:
Venn Diagram
Optimize your marketing strategies with the Venn Diagram for Marketing Analysis template. Use it to compare different market segments, identify overlapping interests, and analyze competitive landscapes. This tool helps you visualize data, uncover insights, and make informed marketing decisions. Perfect for marketing professionals, strategists, and business analysts looking to enhance their marketing analysis and planning efforts through visual tools.
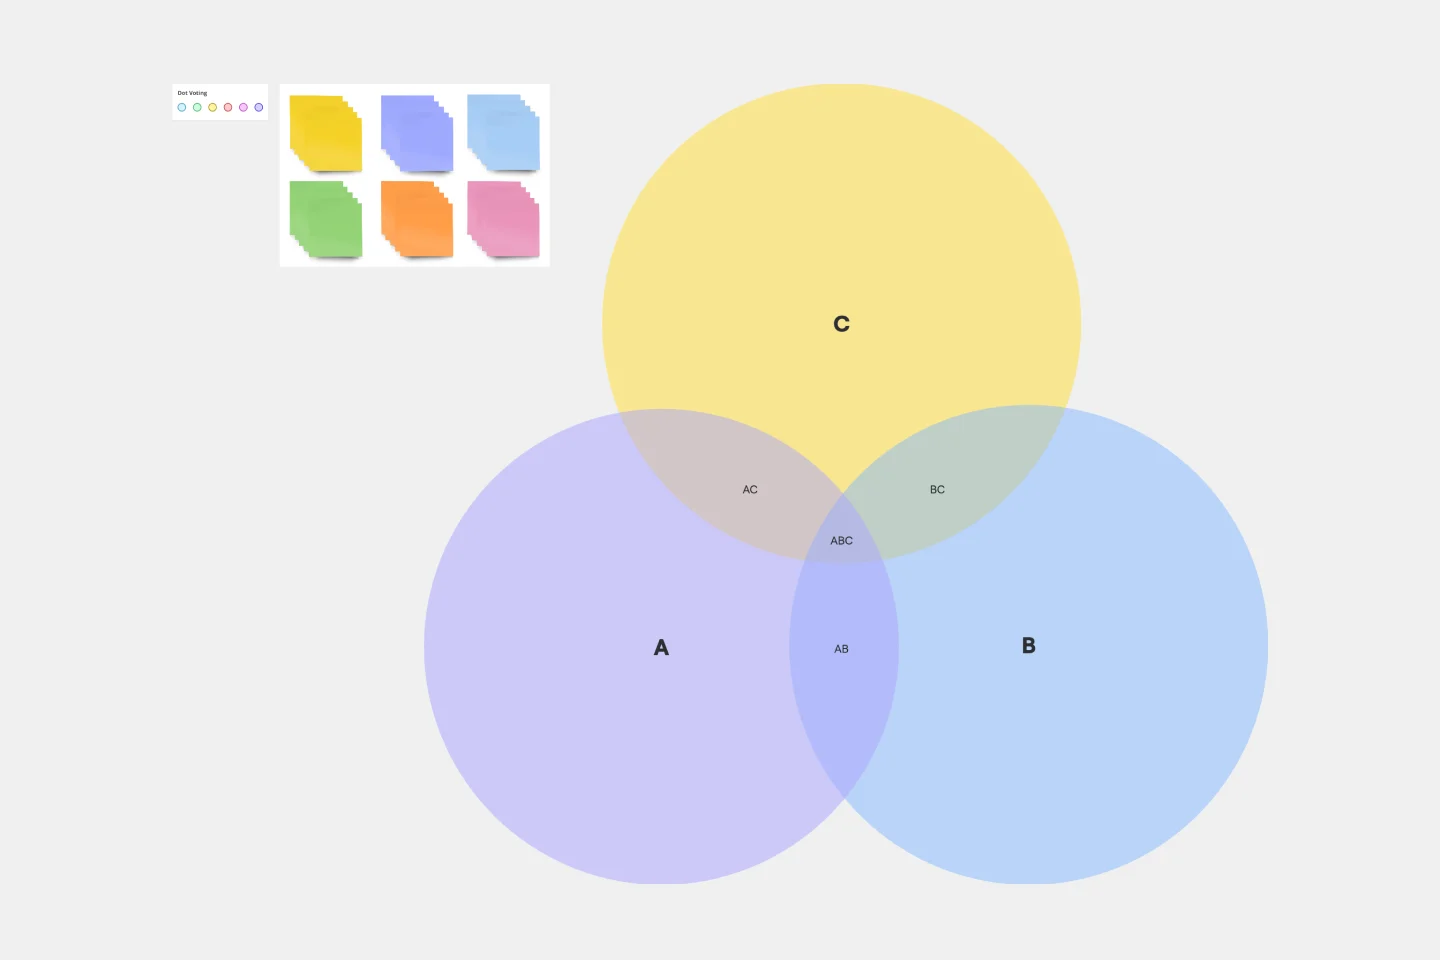
3-Circle Venn Diagram
Works best for:
Education, Diagrams, Brainstorming
Venn diagrams have been a staple of business meetings and presentations since the 1800s, and there’s a good reason why. Venn diagrams provide a clear, effective way to visually showcase relationships between datasets. They serve as a helpful visual aid in brainstorming sessions, meetings, and presentations. You start by drawing a circle containing one concept, and then draw an overlapping circle containing another concept. In the space where the circles overlap, you can make note of the concepts’ similarities. In the space where they do not, you can make note of their differences.
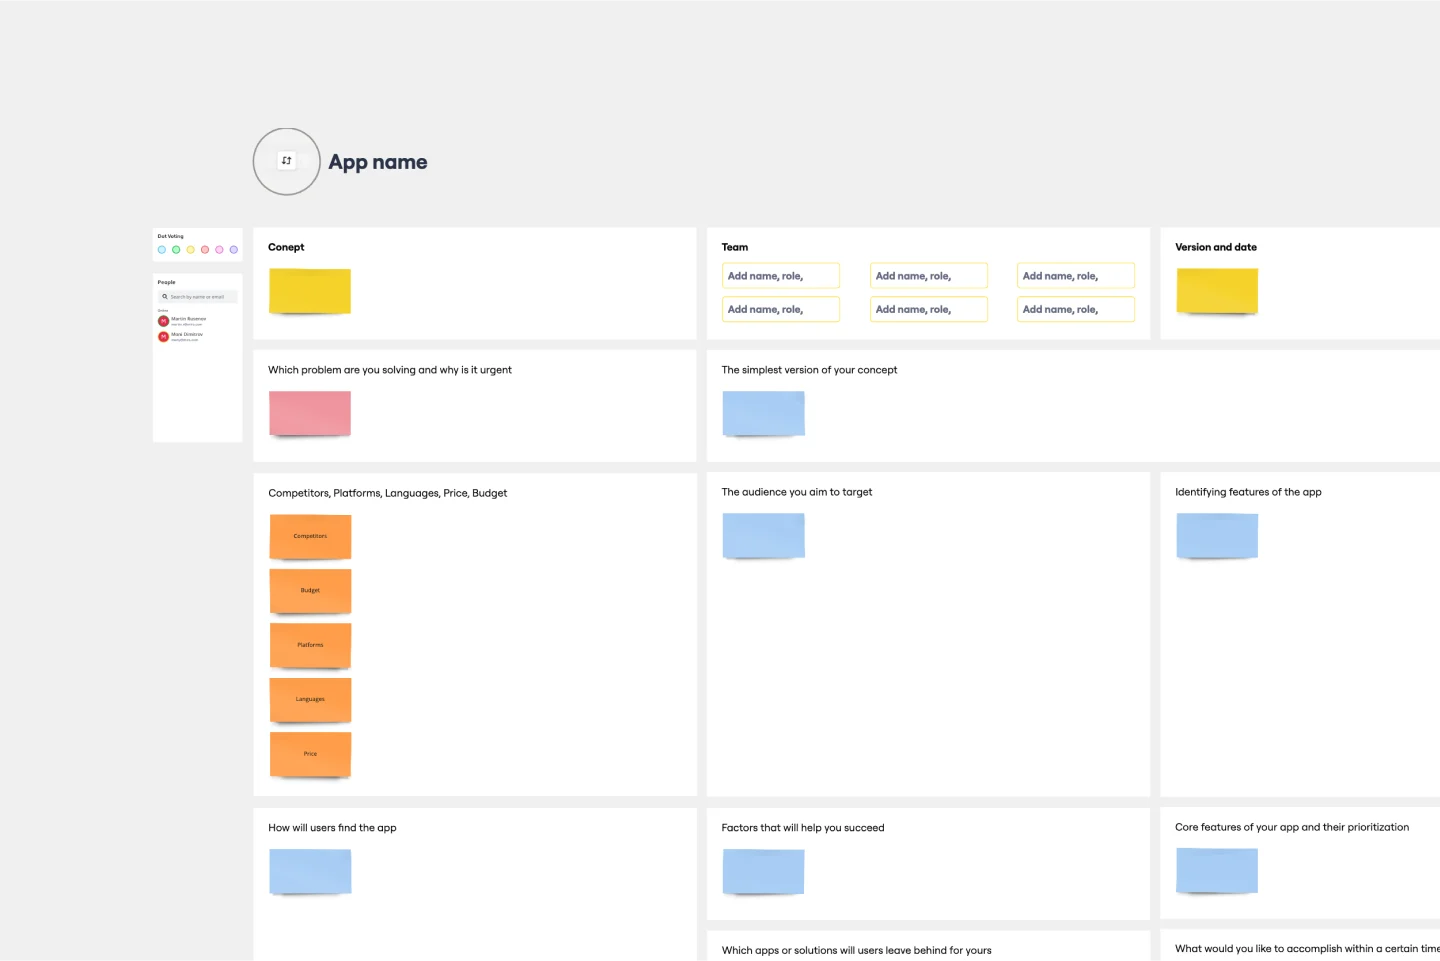
App Development Canvas Template
Works best for:
Market Research, Product Management, User Experience
Ever noticed that building a successful app requires lots of players and moving parts? If you’re a project manager, you definitely have. Lucky for you, an app development canvas will let you own and optimize the entire process. It features 18 boxes, each one focusing on a key aspect of app development, giving you a big-picture view. That way you can fine-tune processes and get ahead of potential problems along the way—resulting in a smoother path and a better, tighter product.