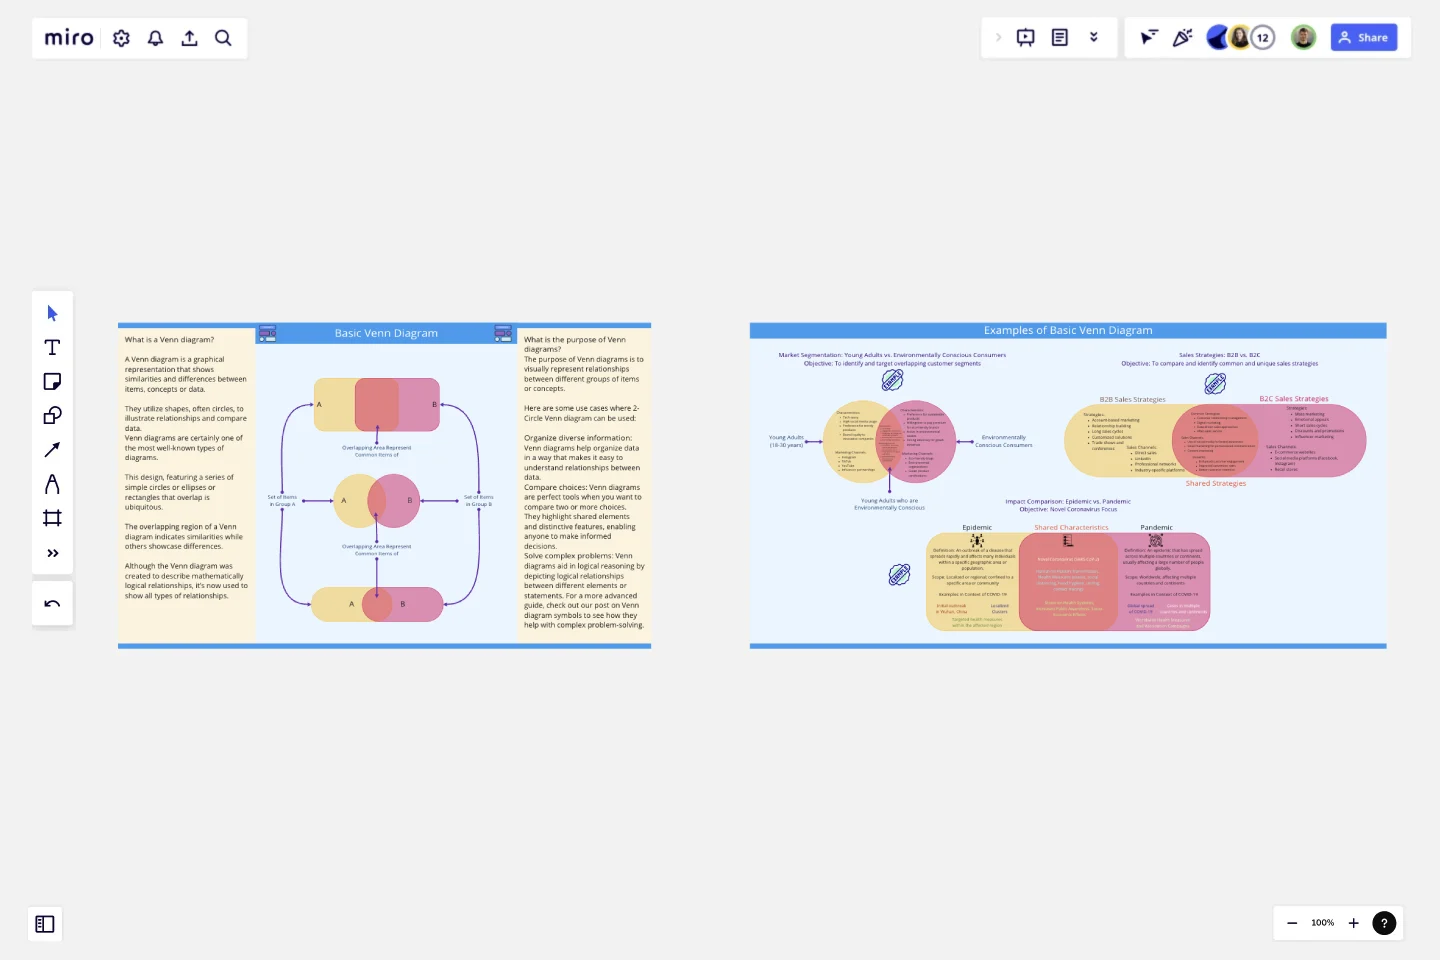
Basic Venn Diagram
A Venn diagram is a graphical representation that shows similarities and differences between items, concepts or data.
They utilize shapes, often circles, to illustrate relationships and compare data.
Venn diagrams are certainly one of the most well-known types of diagrams. This design, featuring a series of simple circles or ellipses or rectangles that overlap is ubiquitous. The overlapping region of a Venn diagram indicates similarities while others showcase differences.
Although the Venn diagram was created to describe mathematically logical relationships, it’s now used to show all types of relationships.
Purpose of Venn diagrams?
The purpose of Venn diagrams is to visually represent relationships between different groups of items or concepts.Here are some use cases where 2-Circle Venn diagram can be used:
Organize diverse information: Venn diagrams help organize data in a way that makes it easy to understand relationships between data.
Compare choices: Venn diagrams are perfect tools when you want to compare two or more choices. They highlight shared elements and distinctive features, enabling anyone to make informed decisions.
Solve complex problems: Venn diagrams aid in logical reasoning by depicting logical relationships between different elements or statements. For a more advanced guide, check out our post on Venn diagram symbols to see how they help with complex problem-solving.
Use this template to create basic level venn diagrams comprising two circles or any other shape. Three examples are also given in this template, which you can use or learn to create your venn-diagrams.
This template was created by Khawaja Rizwan.
Get started with this template right now.
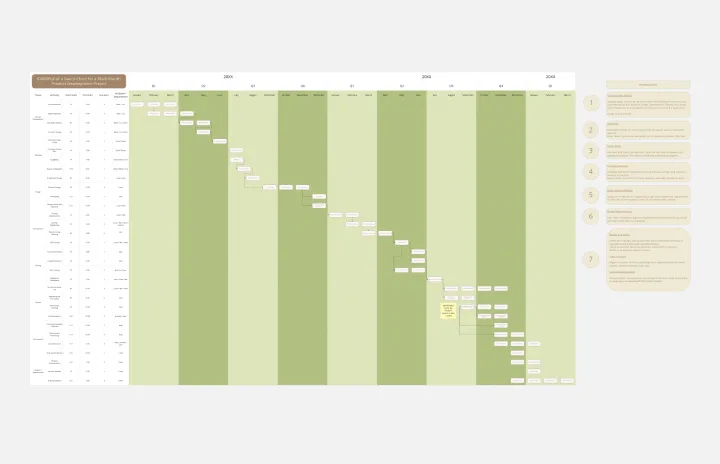
Product Development Gantt Chart
Works best for:
Gantt Chart, Planning
Developing a new product involves many steps and stakeholders. The Product Development Gantt Chart template helps you manage this complex process efficiently. Use it to outline each phase of development, set timelines, and assign responsibilities. Track progress and make adjustments as needed to stay on schedule. This template provides a clear visual representation, coordinating tasks for a successful product launch.
Product / Market Fit Canvas Template
Works best for:
Market Research, Strategic Planning, Product Management
The product/market fit canvas template is used to help product teams meet customer and market needs with their product design. This template looks at a product in two dimensions: first, how the product fits user needs, and second, how the fully designed product fits within the market landscape. This combined metric understands a product holistically from the way customers use and desire a product, to the market demand. By comparing customer and product qualities side by side, users should better understand their product space and key metrics.
Target Audience Template
Works best for:
Marketing, Desk Research, Prioritization
Understanding your target audience is vital to business success. How can you market yourself effectively if you don’t know who you’re targeting? Using the Target Audience template, you can review valuable data about who your customers are and what they want from your product or service.
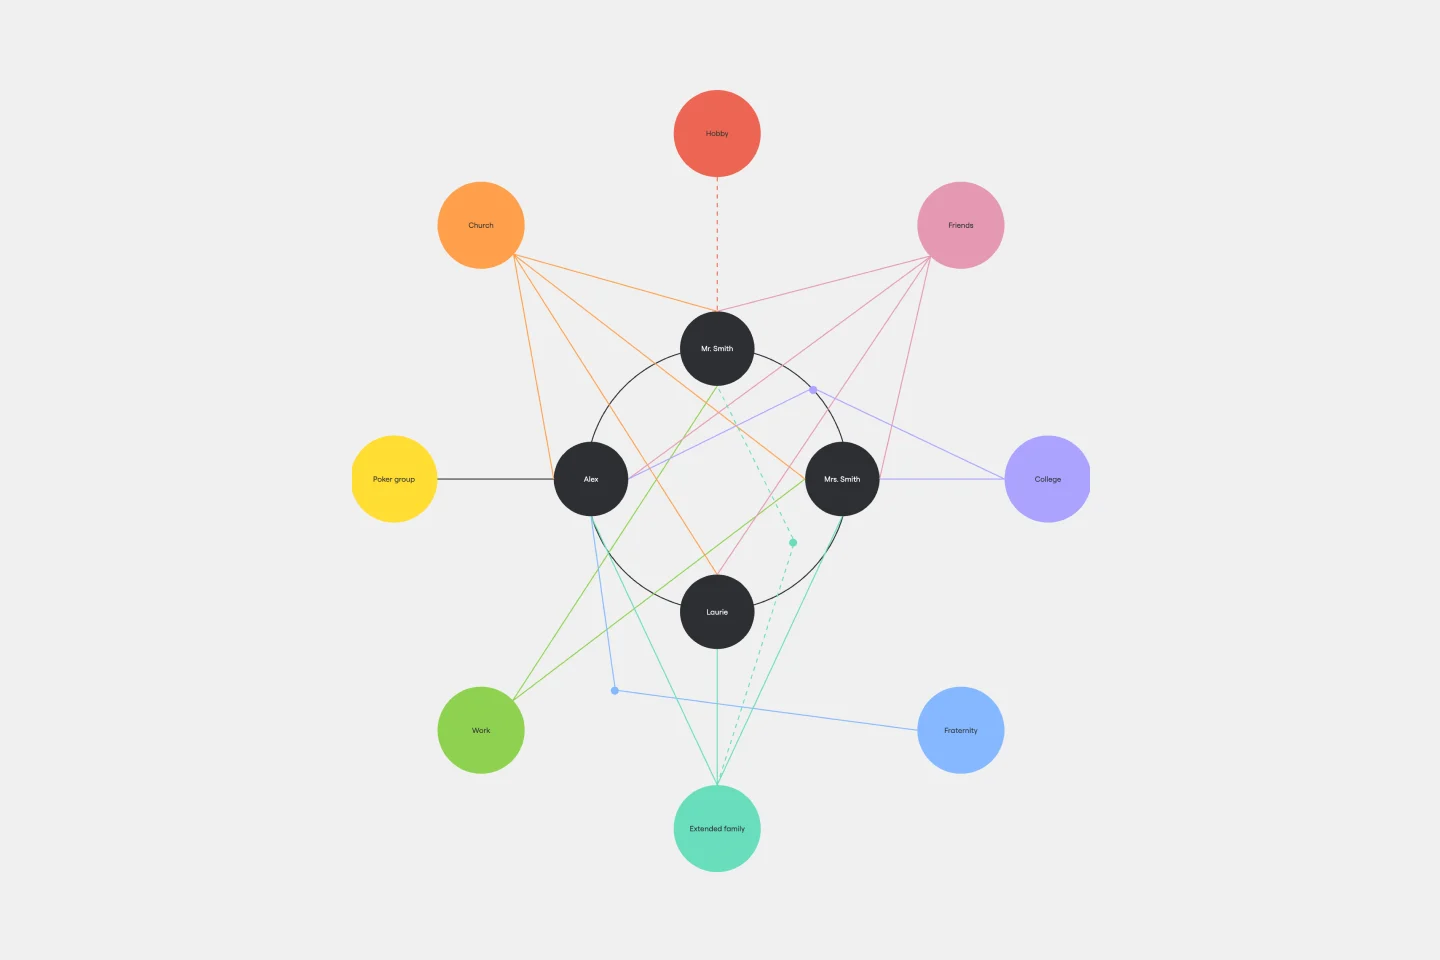
Ecomap Template
Works best for:
Strategy & Planning, Diagramming
The Ecomap Template illustrates the multifaceted relationships and environmental interactions encircling an individual or entity. Determine crucial patterns and dynamics by providing a clear and comprehensive visualization of how different systems intertwine and influence each other.
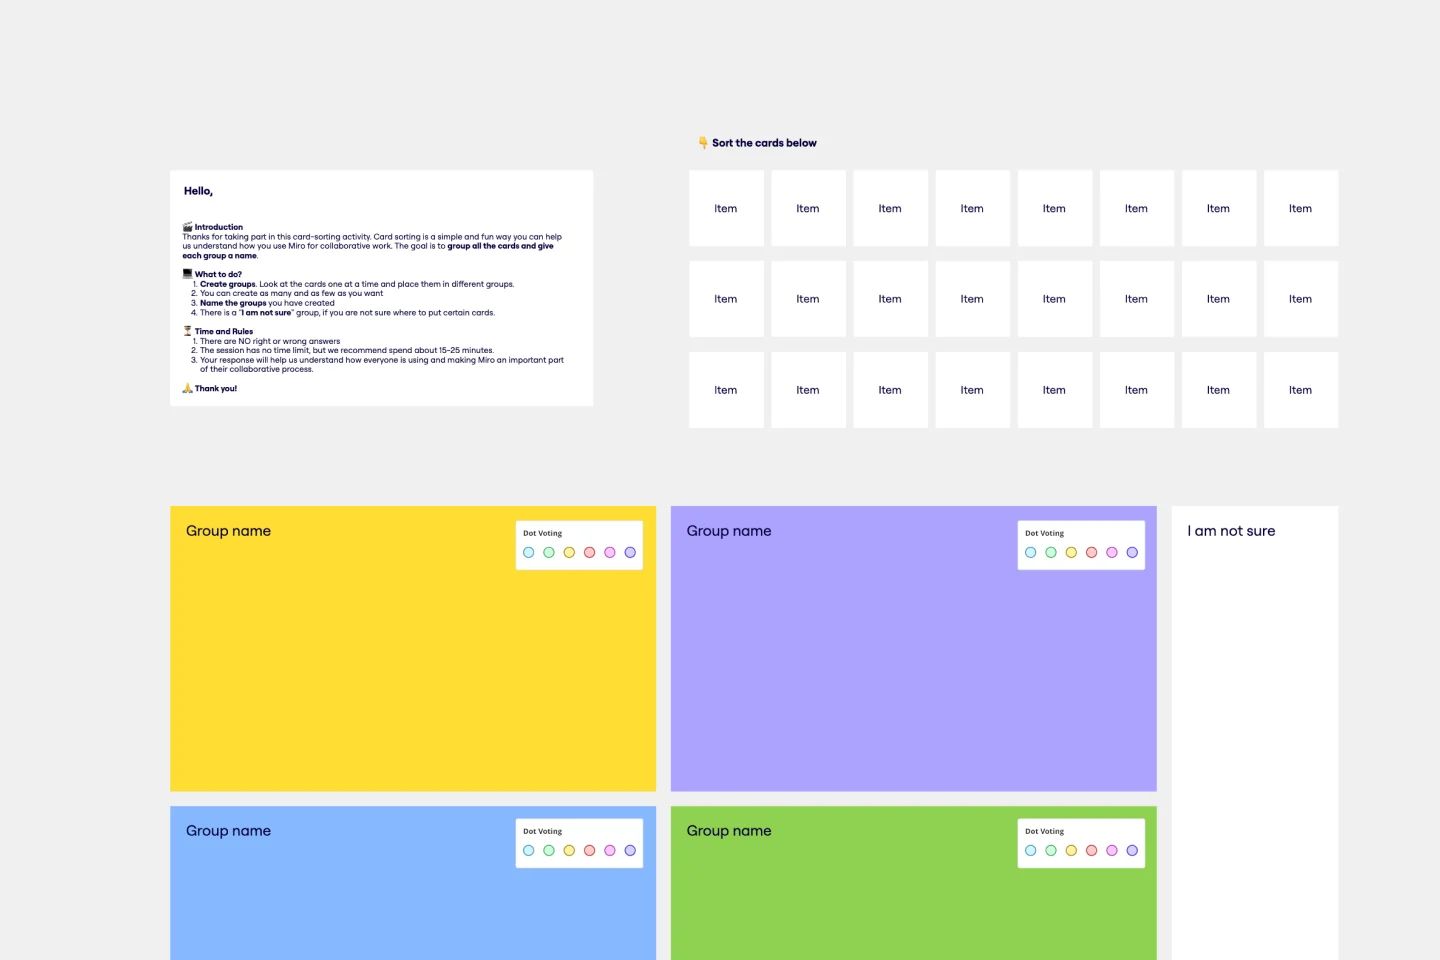
Card Sorting Template
Works best for:
Desk Research, UX Design, Brainstorming
Card sorting is a brainstorming technique typically used by design teams but applicable to any brainstorm or team. The method is designed to facilitate more efficient and creative brainstorms. In a card sorting exercise, you and your team create groups out of content, objects, or ideas. You begin by labeling a deck of cards with information related to the topic of the brainstorm. Working as a group or individuals, you then sort the cards in a way that makes sense to you, then label each group with a short description. Card sorting allows you to form unexpected but meaningful connections between ideas.
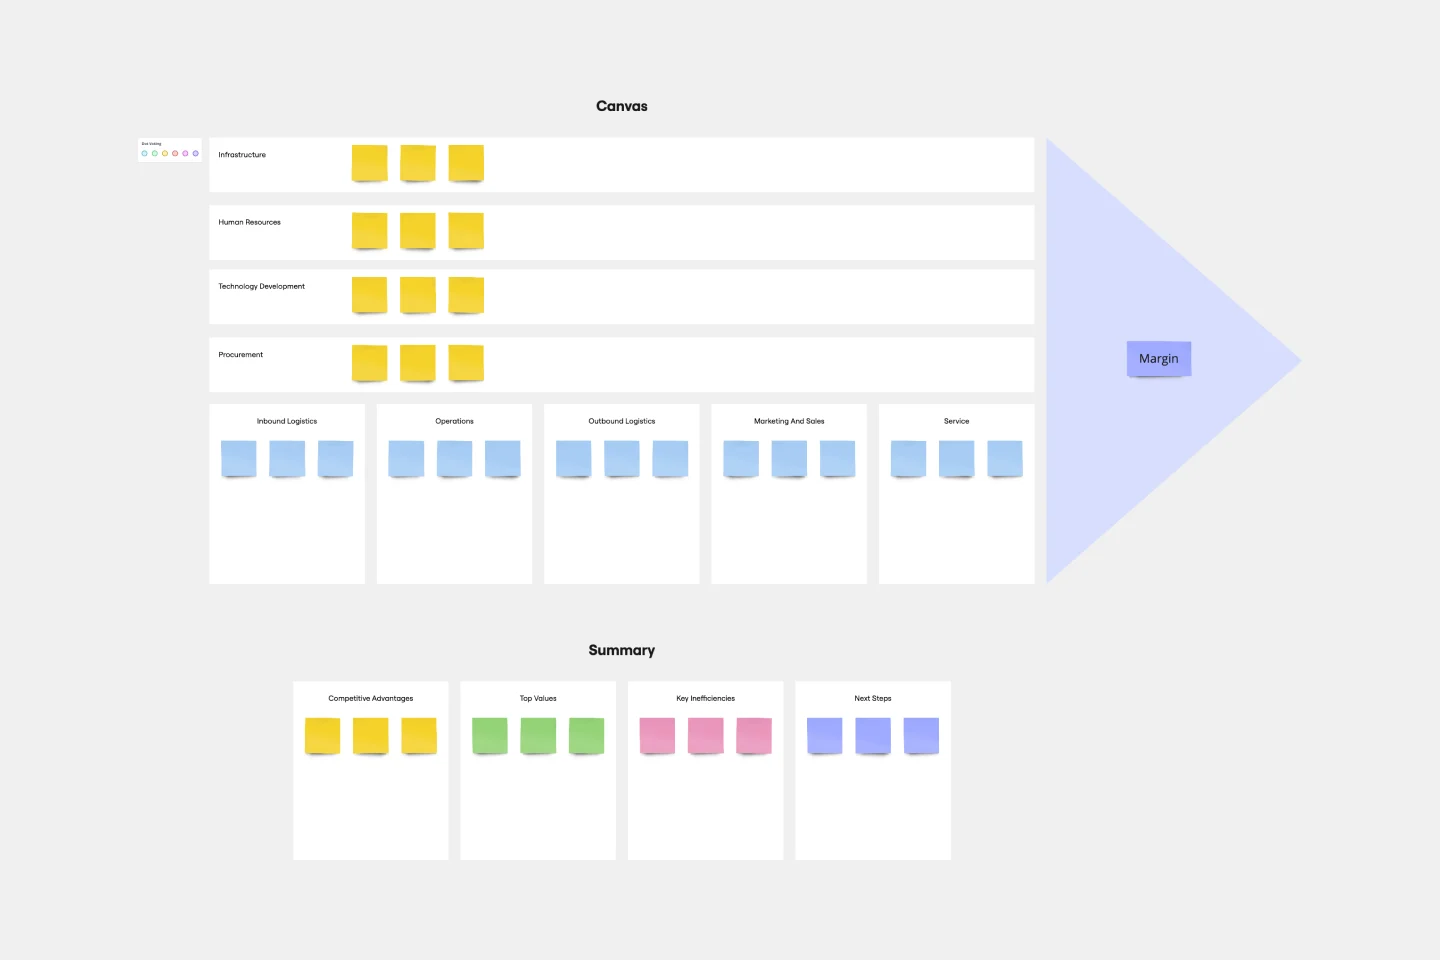
Value Chain Analysis Template
Works best for:
Leadership, Strategic Planning, Workflows
First coined by Harvard Business School professor Michael Porter, the value chain analysis helps your team evaluate your business activities so you can find ways to improve your competitive advantage. A value chain is a set of activities that a company performs in order to deliver a valuable product from start to finish. The analysis itself allows your team to visualize all the business activities involved in creating the product—and helps you identify inefficiencies, bottlenecks, and miscommunication within the process.