Azure Architecture Diagram Template
This diagram will help you visualize the combination of any data and build and deploy custom machine learning models at scale.
Available on Enterprise, Business, Education plans.
About the Azure Architecture Diagram template
The Azure Architecture Diagram Template will help you visualize and develop sophisticated, transformational apps using state-of-the-art machine learning algorithms. It will also allow you to create architecture diagrams, combine data, and build and deploy custom machine learning models at scale.
Keep reading to learn more about the Azure Architecture Diagram Template.
What is an Azure Architecture Diagram Template
The Azure Architecture Diagram Template, like any other network diagram, visually shows the steps of a given process, in this case, of the cloud architecture framework. The Azure Architecture Diagram has unique icons categorized into Stencils. Each Stencil focuses on a specific task to make it easier for users to access the right set of icons.
Azure helps to build, manage, and deploy applications. You can also use your preferred languages, frameworks, and infrastructure—even your data center and other clouds—to solve challenges large and small. Its framework consists of five pillars:
Cost optimization
Operational excellence
Performance efficiency
Reliability
Security
When to use the Azure Architecture Diagram Template
You can use the Azure Architecture Diagram Template to transform your data into actionable insights. Microsoft Azure has a wide range of use cases that it serves. Here you can see the most common examples:
Analytics
DevOps
Networks
Security
Databases
How to create an Azure Architecture Diagram Template
Here you can see some of the best practices when building your own Azure Architecture Diagram template.
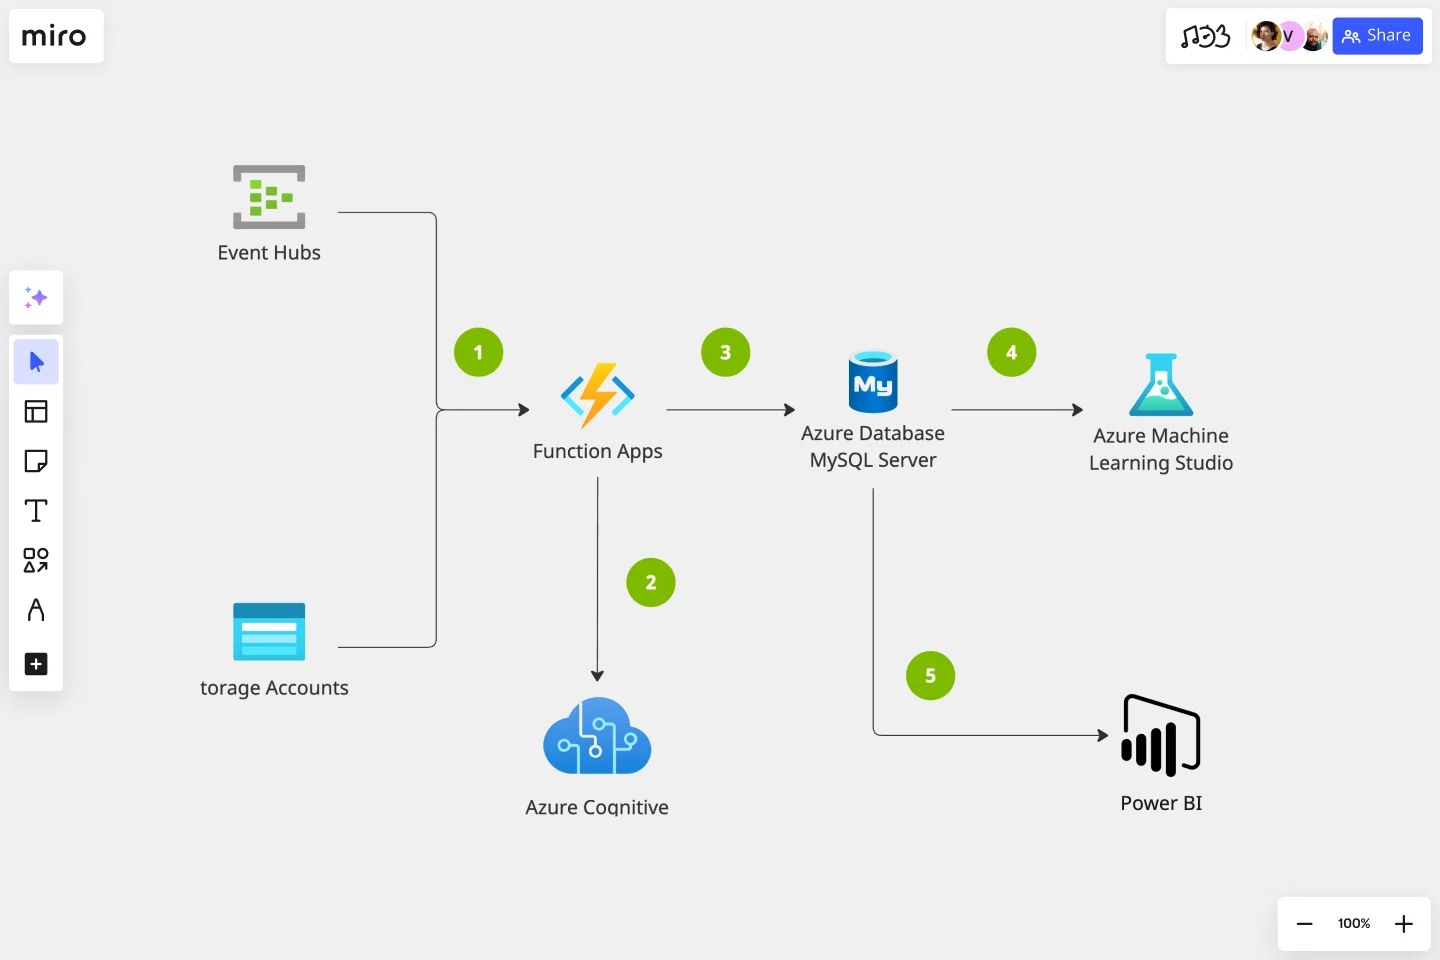
Data comes from various sources. Use the Events Hubs icon for high volumes of data ingestion or the Storage Account icon for data uploaded to Blob Storage.
Use Azure Function App icon to signalize calls to the Text Analytics API icon.
Add Azure Database for MySQL icon after Function Apps.
Add Azure Machine Learning Studio icon to show data is being further analyzed for more insights.
Add the Power BI icon to show how MySQL Power BI provides options for data visualization and analysis in Power BI.
Miro is the perfect cloud and network diagram tool with several available shape packs and templates, ranging from Azure cloud architecture to AWS to Cisco, and many more!
How do I create an Azure Architecture Diagram Template?
Creating an Azure Architecture Diagram in Miro is easy. You can use our Azure Architecture Diagram Template and customize it as you see fit. Once you have the diagram structure, you can start adding the icons. You can find the icons under our Azure Icon Set integration.
Get started with this template right now. Available on Enterprise, Business, Education plans.
Cloud Blueprint
Works best for:
Diagramming
The Cloud Blueprint template offers a visual framework for designing and planning cloud-based architectures. It provides elements for mapping out cloud services, components, and dependencies. This template enables teams to visualize and communicate complex cloud infrastructure designs, facilitating collaboration and decision-making. By promoting clarity and alignment, the Cloud Blueprint empowers organizations to design scalable, resilient, and secure cloud solutions that meet business requirements and objectives.
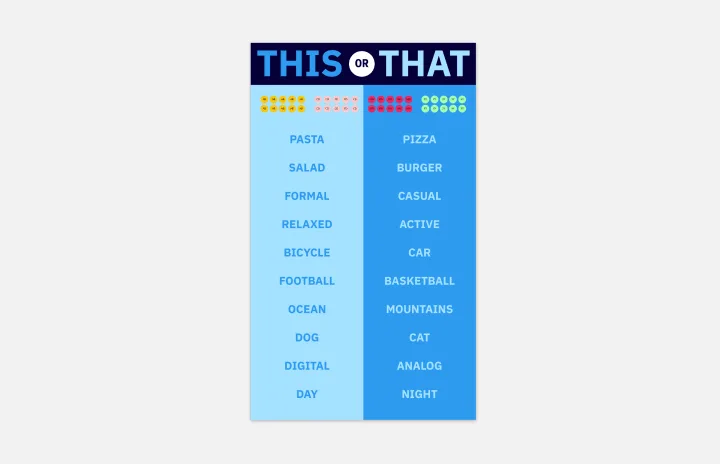
This or That Template
Works best for:
Marketing, Meetings, Workshops
If you’re a social media manager, a designer, or just someone who loves photography, then you’ve probably seen the “This or That” game on Instagram. The premise is simple: You make two parallel lists that pit a series of choices against each other, like “apples or oranges” or “pizza or hot dogs”. The Instagram user chooses between the various options by circling the one that they prefer. Then they share the completed game with their followers. Although it was popularized on Instagram, you can use This or That on other social media platforms too, or even your website or blog.

BPM
Works best for:
Diagramming
The BPM (Business Process Management) template is a visual tool for modeling, analyzing, and optimizing business processes. It provides a structured framework for documenting process flows, identifying bottlenecks, and improving efficiency. This template enables organizations to streamline operations, enhance productivity, and drive business performance. By promoting process transparency and agility, the BPM template empowers teams to achieve operational excellence and deliver value to stakeholders.

Causal Loop Diagrams (1.0)
Works best for:
Diagramming
The Causal Loop Diagrams (1.0) template offers a visual tool for modeling complex systems and understanding the feedback loops that drive behavior. It provides a structured framework for identifying causal relationships, reinforcing loops, and balancing feedback within a system. This template enables teams to analyze system dynamics, anticipate unintended consequences, and formulate effective strategies for intervention. By promoting systems thinking and understanding of interdependencies, Causal Loop Diagrams empower organizations to navigate complexity and drive sustainable change.
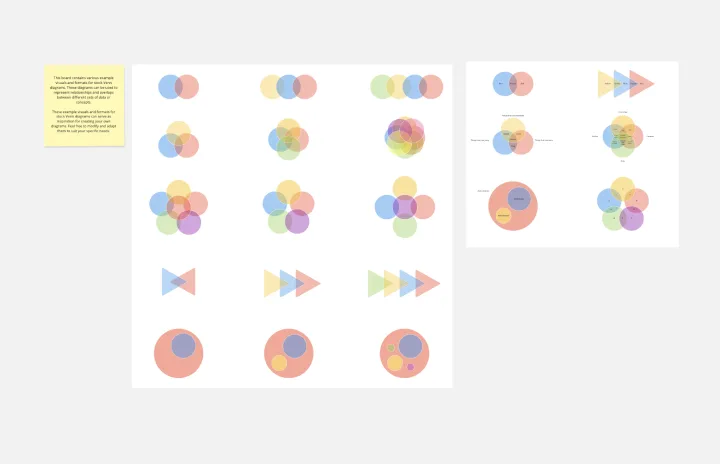
Venn Diagrams by Dave Westgarth
Works best for:
Venn Diagram
Visualize relationships and intersections clearly with the Collection Venn Diagram template. This tool is perfect for comparing multiple sets of data, identifying commonalities, and showcasing unique elements. Use it in presentations, research, and data analysis to make complex information more digestible. Ideal for educators, researchers, and analysts seeking to present data insights effectively.
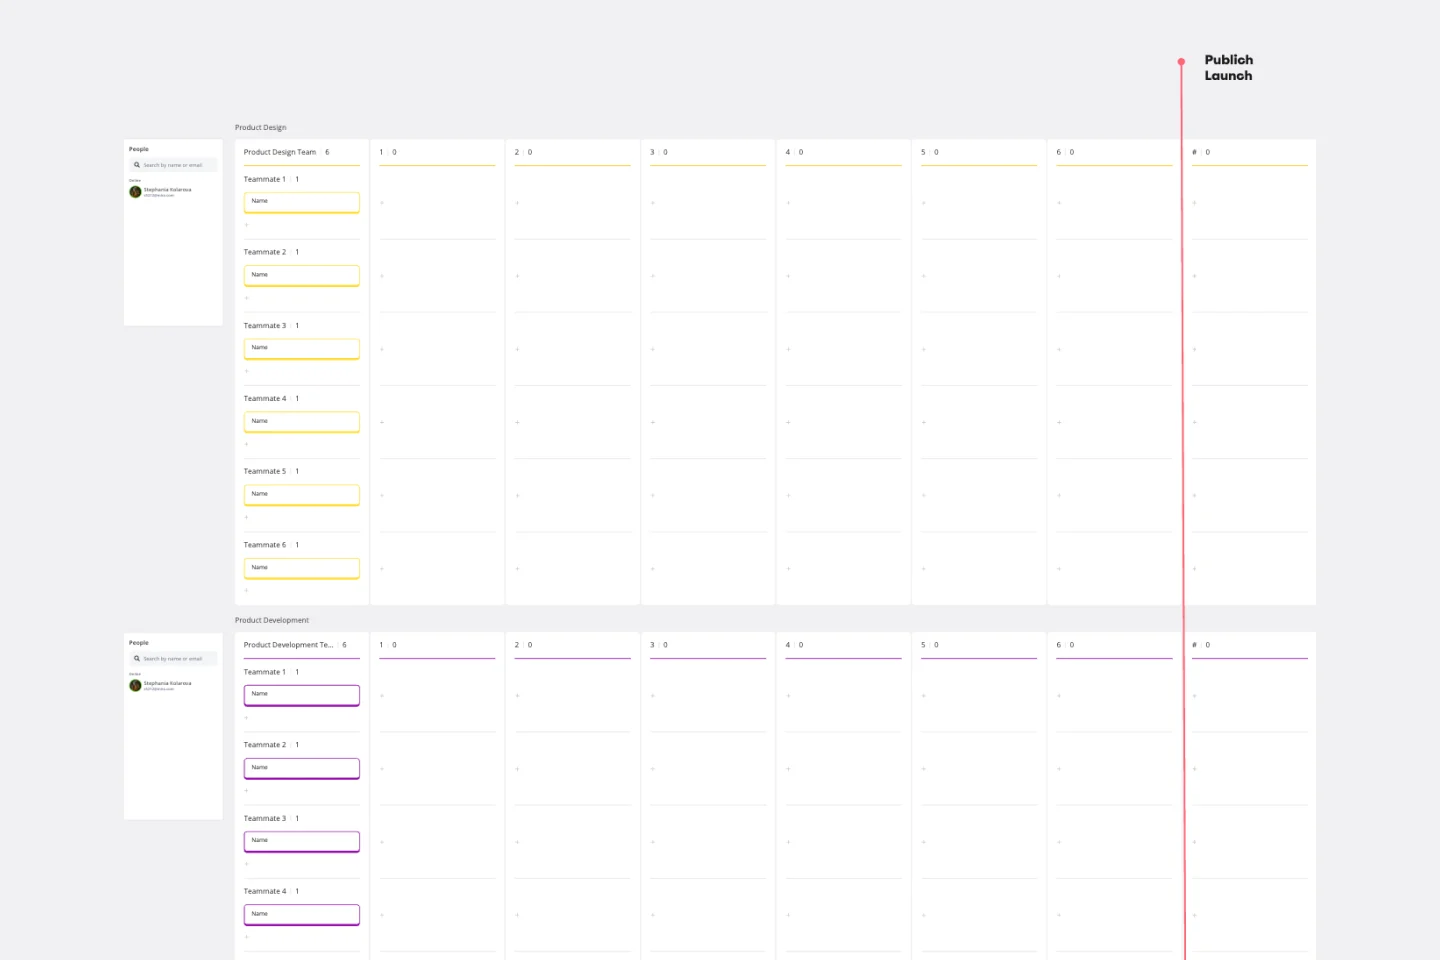
Product Roadmap Template
Works best for:
Product Management, Roadmaps
Product roadmaps help communicate the vision and progress of what’s coming next for your product. It’s an important asset for aligning teams and valuable stakeholders – including executives, engineering, marketing, customer success, and sales – around your strategy and priorities. Product roadmapping can inform future project management, describe new features and product goals, and spell out the lifecycle of a new product. While product roadmaps are customizable, most contain information about the products you’re building, when you’re building them, and the people involved at each stage.