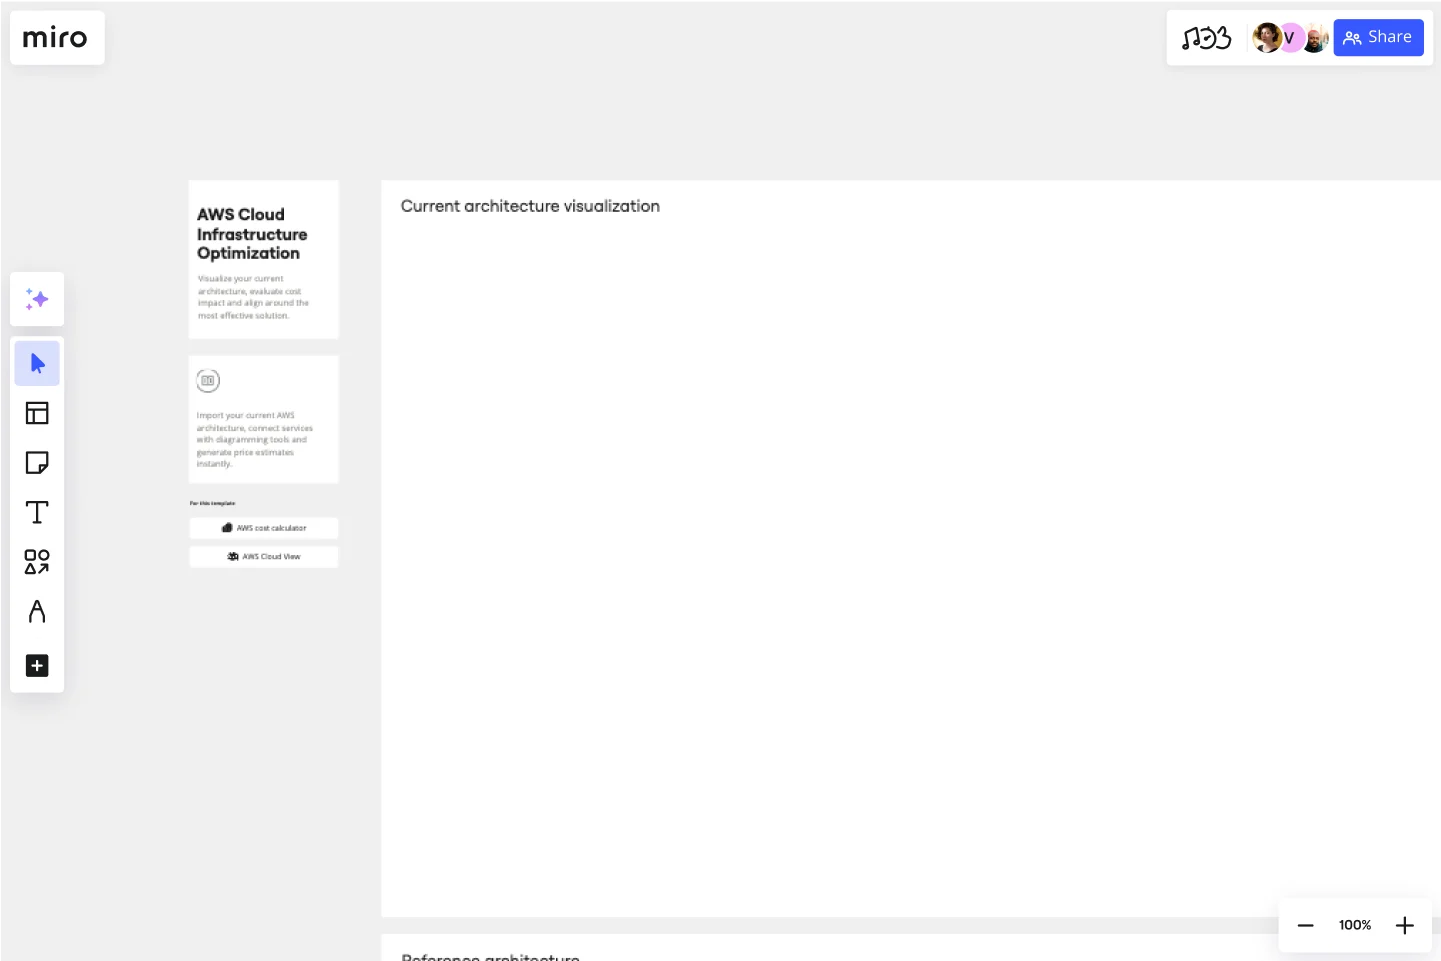
AWS Cloud Infrastructure Optimization Template
Import your AWS infrastructure, evaluate cost impact, and align on an optimal solution.
About the AWS Cloud Infrastructure Optimization Template
The AWS Cloud Infrastructure Optimization Template is part of Miro's Intelligent Templates collection, designed to streamline and enhance the management of your AWS cloud resources. This template leverages Miro's advanced diagramming tools and integrates seamlessly with AWS to provide real-time data visualization, cost analysis, and performance optimization. It is an invaluable resource for cloud architects, AWS practitioners, and DevOps engineers looking to optimize their cloud infrastructure efficiently.
How to use the AWS Cloud Infrastructure Optimization Template
Connect to AWS: Begin by linking your AWS account to Miro. This integration allows the template to fetch real-time data from your AWS environment.
Import data: Use the template to import your existing AWS infrastructure data. This can be done manually or automatically through the integration.
Visualize infrastructure: The template will auto-generate a detailed diagram of your current AWS setup, providing a clear visual representation of your architecture.
Optimize costs: Use the built-in AWS cost calculator to estimate and compare costs across different configurations. This feature supports a wide range of AWS services, ensuring comprehensive cost management.
Performance enhancements: Identify performance bottlenecks and optimize your infrastructure for better reliability and efficiency. The template offers insights and suggestions for performance improvements.
Collaborate and share: Use Miro's collaborative features to share the infrastructure diagrams with your team, gather feedback, and make informed decisions collectively.
Why use the AWS Cloud Infrastructure Optimization Template
Efficiency: Save time by automating the creation of infrastructure diagrams and cost calculations. The template reduces the manual effort required to visualize and optimize your AWS setup.
Cost management: With detailed cost analysis and comparison features, you can gain better control over your cloud spending and make more cost-effective decisions.
Performance optimization: Improve the performance and reliability of your cloud infrastructure by identifying and addressing potential issues.
Collaboration: Enhance team collaboration with Miro's interactive and real-time editing capabilities. Share insights and work together to optimize your cloud environment.
Comprehensive view: Get a holistic view of your AWS infrastructure, making it easier to manage and scale your cloud resources effectively.
The AWS Cloud Infrastructure Optimization Template, as part of Miro's Intelligent Templates, simplifies the complex task of managing cloud infrastructure, making it accessible and efficient for all users.
Get started with this template right now.
ERD Supply Chain Management System Template
Works best for:
ERD
The ERD Supply Chain Management System Template streamlines and optimizes supply chain operations. It serves as a visual support that helps businesses understand and manage the complex relationships between different entities within their supply chain, such as suppliers, products, inventory, orders, and shipments. By providing a clear visualization of these relationships, the template enables users to identify inefficiencies and areas for improvement, facilitating strategic decision-making.
Bar Chart / Diagram Combined
Works best for:
Diagramming
The Bar Chart / Diagram Combined template offers a versatile tool for creating visualizations that combine bar charts with other diagrammatic elements. It provides elements for representing data trends, relationships, and comparisons effectively. This template enables teams to create customized visualizations that communicate complex information in a clear and compelling manner. By promoting visual clarity and insight, the Bar Chart / Diagram Combined template empowers teams to make data-driven decisions and communicate findings with impact.
Genogram Template
Works best for:
Diagramming
The Genogram Template maps out family structures and relationships with exceptional depth and detail. Unlike traditional family trees, this template provides a comprehensive perspective by encapsulating familial connections, emotional ties, and significant life events. Create a genogram to unearth patterns and trends within a family, whether hereditary or environmental. Professionals across different domains can gain a holistic understanding of familial dynamics by showing deep insights into the nuances of relationships, facilitating better communication and problem-solving.
UML Class Messaging System Template
Works best for:
UML
The UML Class Messaging System Template streamlines the process of designing and analyzing messaging systems. It allows users to visually map out the structure of a system by detailing classes, their attributes, operations, and the relationships among objects. This template is particularly useful for illustrating the functionality of a messaging system, including the management of text messages, conversation threads, user contacts, notifications, and channels. It offers a clear visual representation of how all these elements interact within the system, making it an invaluable resource for developers, designers, and stakeholders aiming to enhance communication and reduce errors in the development phase.
ERD Blogging System Template
Works best for:
ERD
The ERD Blogging System template in Miro efficiently manages and organizes digital content. It features key entities such as User, Post, Comment, Category, Tag, and File, which are essential for managing the creation and publication of blog posts, engaging users through comments, and organizing content via categories and tags. Additionally, it supports media attachments through the File entity, linking them to the relevant content. This template helps streamline the blogging process, making it an invaluable tool for content management and publication.
