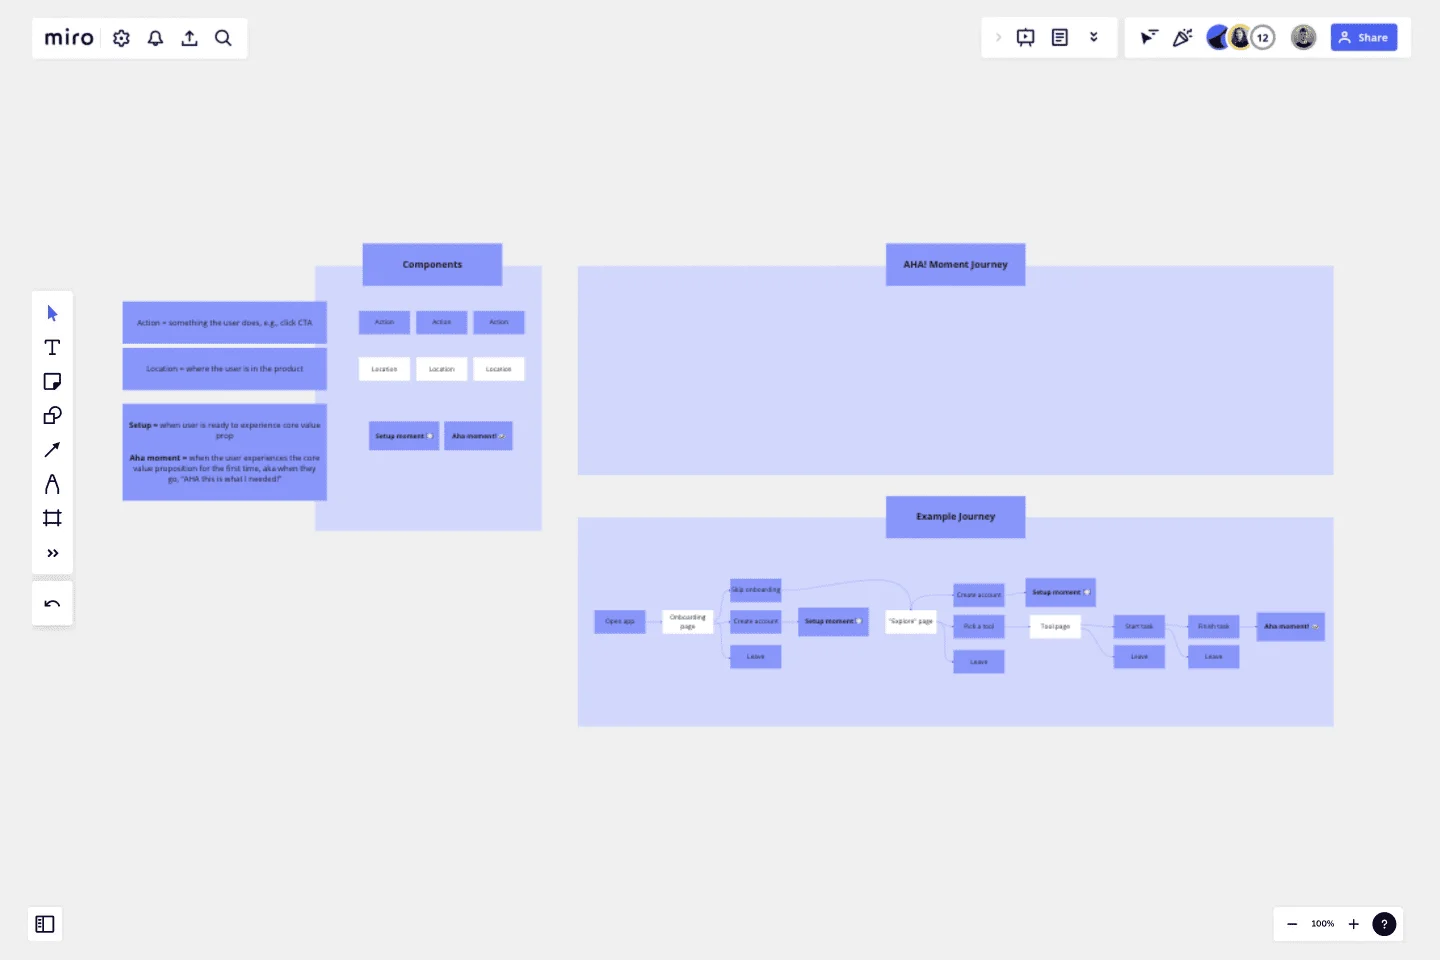
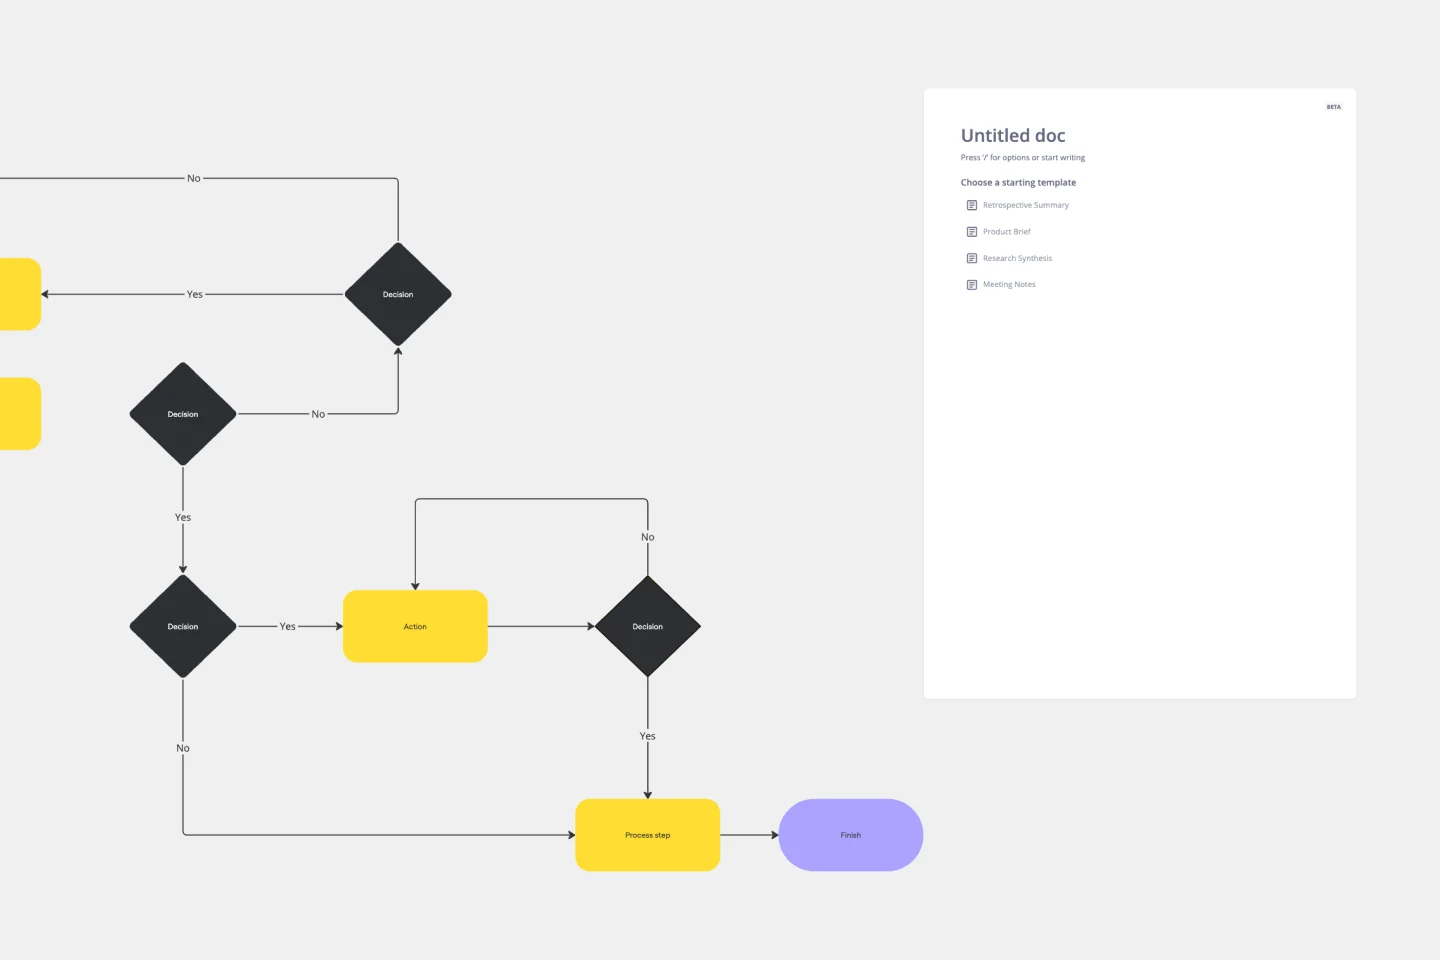
AHA! Moment Flowchart
Break down the user journey to the first aha moment!
The aha moment is the first time the user experiences the core value proposition. Mapping out the journey will help you to identify the roadblocks that might hinder your users from experiencing the benefit you intend to bring with your product.
Make sure to map out every action and every page the user visits in order to pin point potential UX issues to fix. Have fun!
Get started with this template right now.
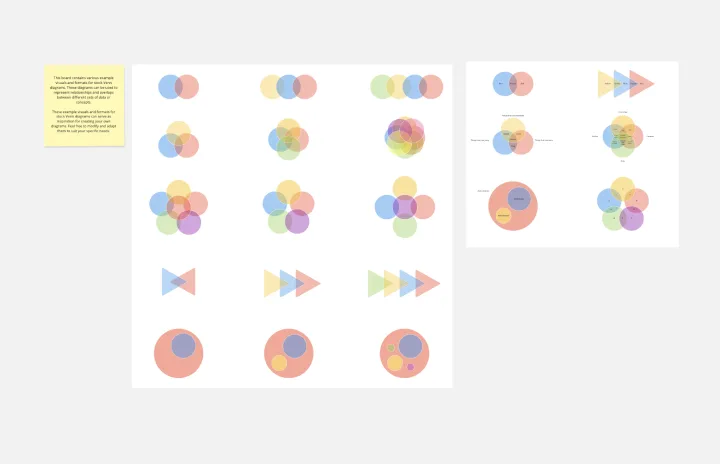
Venn Diagrams by Dave Westgarth
Works best for:
Venn Diagram
Visualize relationships and intersections clearly with the Collection Venn Diagram template. This tool is perfect for comparing multiple sets of data, identifying commonalities, and showcasing unique elements. Use it in presentations, research, and data analysis to make complex information more digestible. Ideal for educators, researchers, and analysts seeking to present data insights effectively.
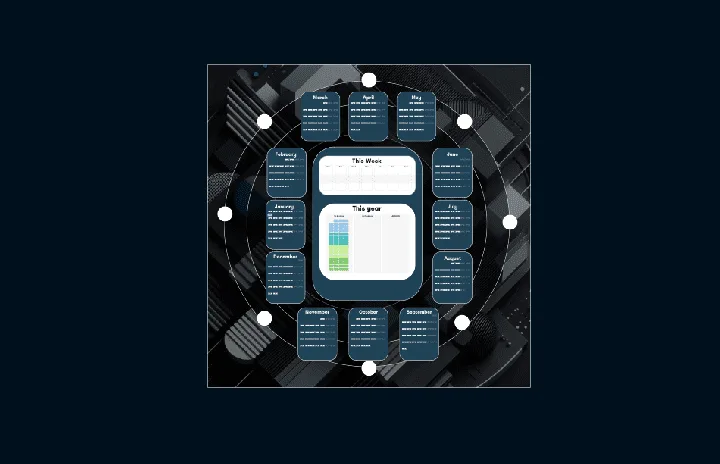
Kanban Planner 2024 Week & Month
Works best for:
Kanban Boards, Agile Methodology, Agile Workflows
KANBAN Planner 2024 Week & Month template provides a flexible framework for planning and managing tasks on a weekly and monthly basis. By organizing tasks by priority and deadlines, teams can optimize their workflow and ensure timely delivery of projects. This template fosters transparency and accountability, enabling teams to collaborate effectively and achieve their goals efficiently.
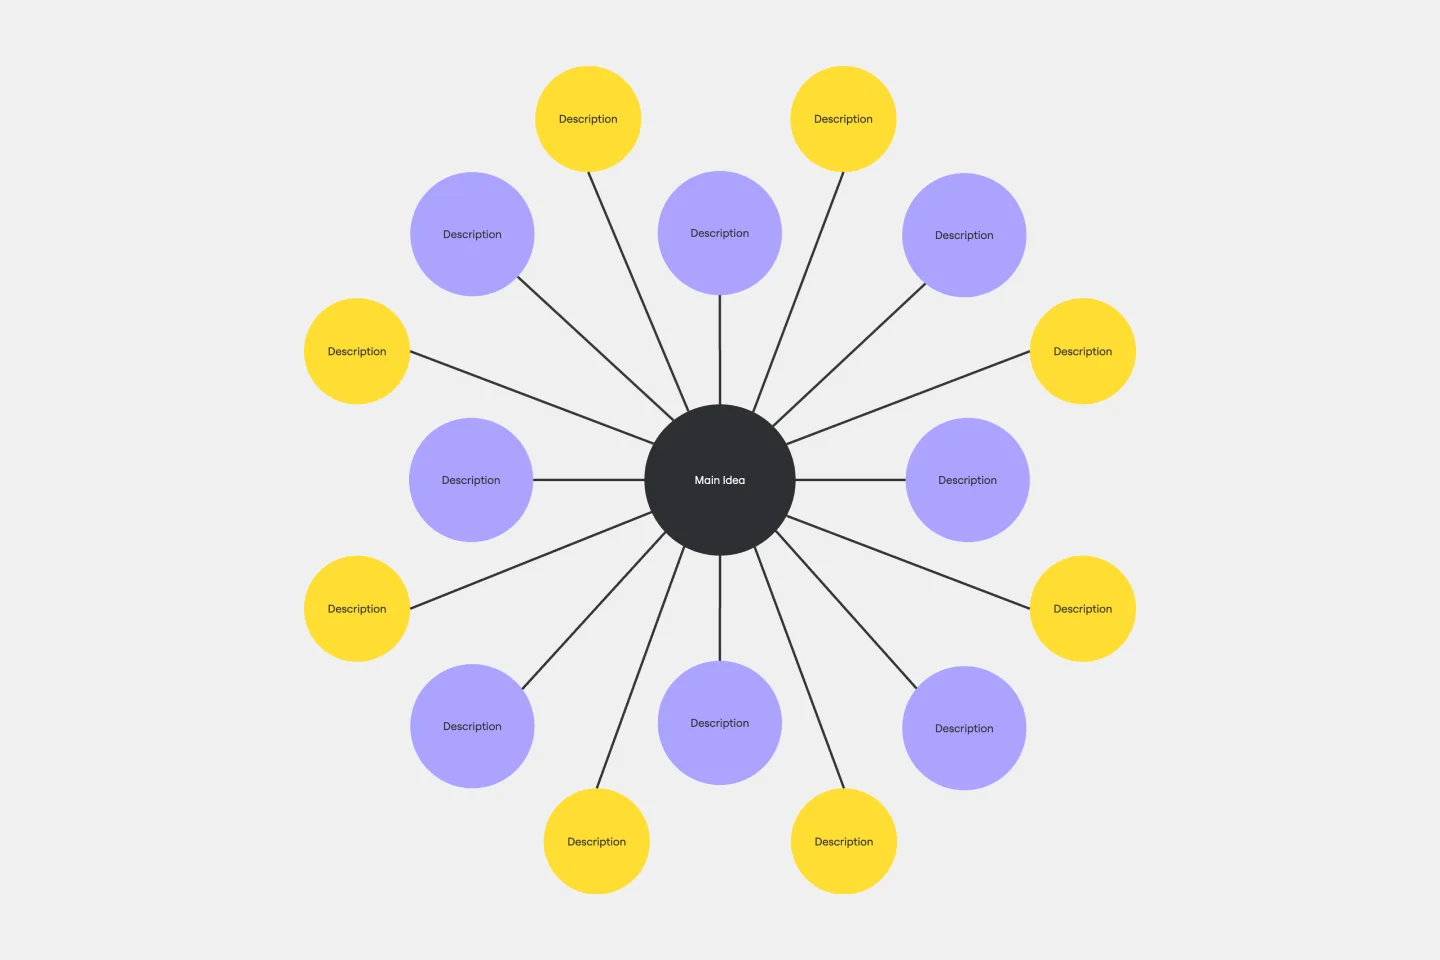
Bubble Map Template
Works best for:
Diagramming, Mapping, Brainstorming
A Bubble Map Template is a visual organization tool that uses bubbles or circles to represent various ideas or data points. These bubbles are linked together, displaying their relationships and creating a network of interconnected thoughts. Use a Bubble Map Template to streamline complex information, enhancing comprehension and promoting efficient decision-making.
ICOR® Workflows
Works best for:
Flowcharts, Diagrams, Mapping
The ICOR® Workflows template offers a visual framework for documenting and optimizing business processes according to the ICOR® (Input, Control, Output, Resources) methodology. It provides elements for defining process inputs, controls, outputs, and resource requirements. This template enables organizations to streamline operations, enhance quality management, and achieve process excellence. By promoting systematic process documentation and analysis, the ICOR® Workflows template empowers organizations to optimize efficiency, minimize risks, and deliver value to stakeholders effectively.
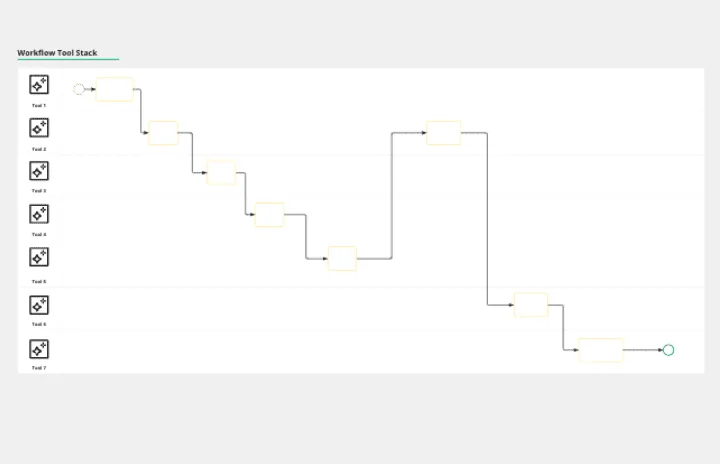
Production Flowchart Template
Works best for:
Flowcharts
The Production Flowchart Template is a well-crafted tool that clearly represents a production process from start to finish. It breaks down complex procedures into easy-to-understand segments, making it easier for stakeholders to grasp the entire process. One of the key benefits of using this template is that it helps to clarify complex production pathways. By mapping out operations visually, teams can identify potential bottlenecks or inefficiencies, facilitating timely and well-informed decision-making.
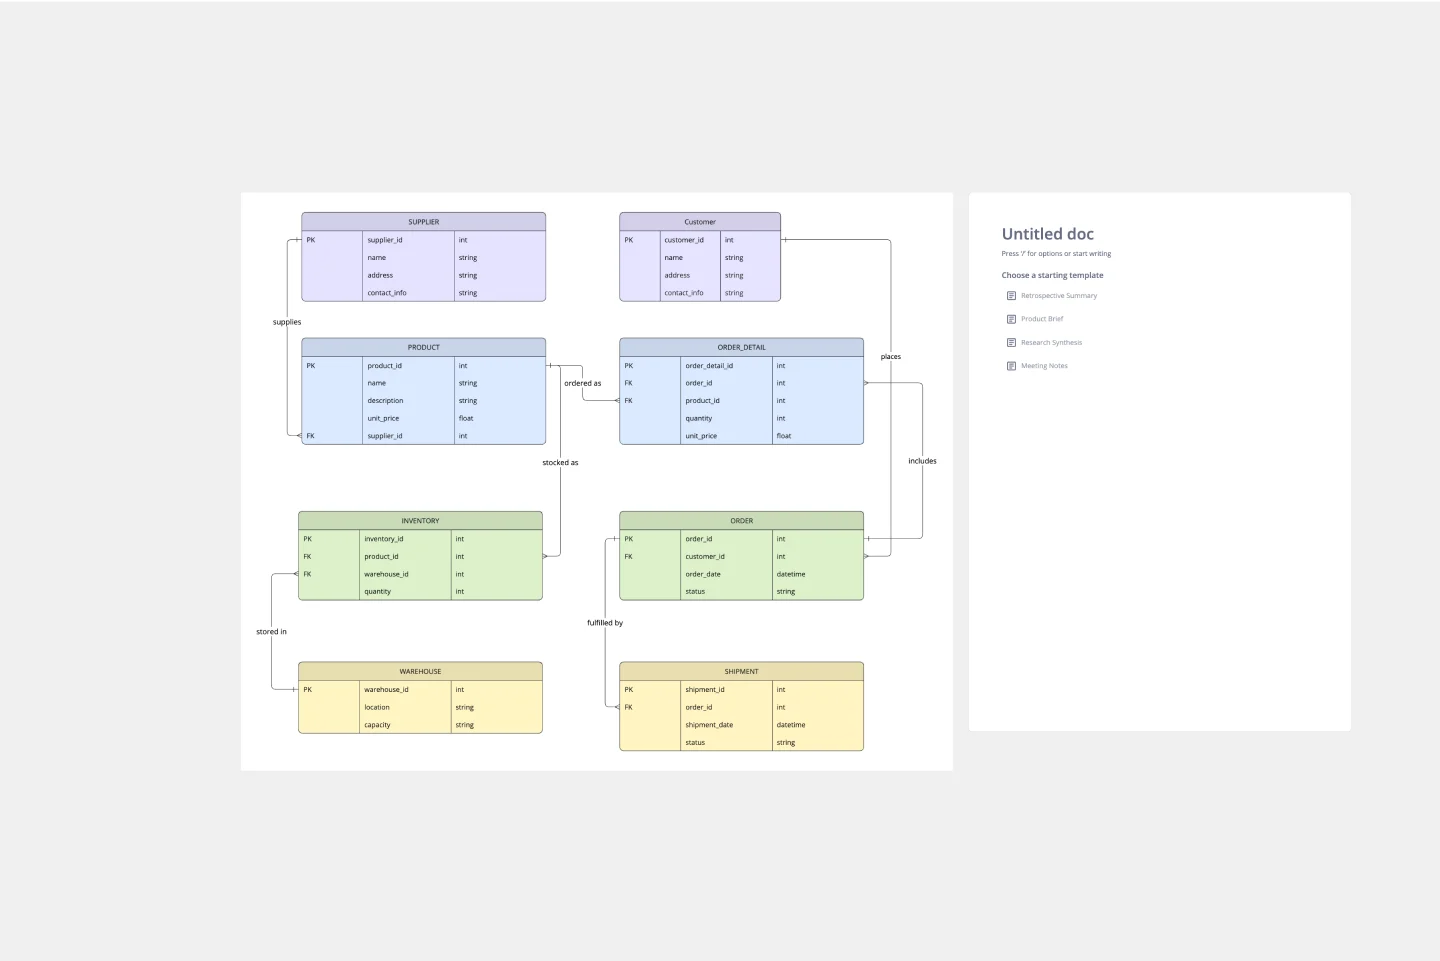
ERD Supply Chain Management System Template
Works best for:
ERD
The ERD Supply Chain Management System Template streamlines and optimizes supply chain operations. It serves as a visual support that helps businesses understand and manage the complex relationships between different entities within their supply chain, such as suppliers, products, inventory, orders, and shipments. By providing a clear visualization of these relationships, the template enables users to identify inefficiencies and areas for improvement, facilitating strategic decision-making.