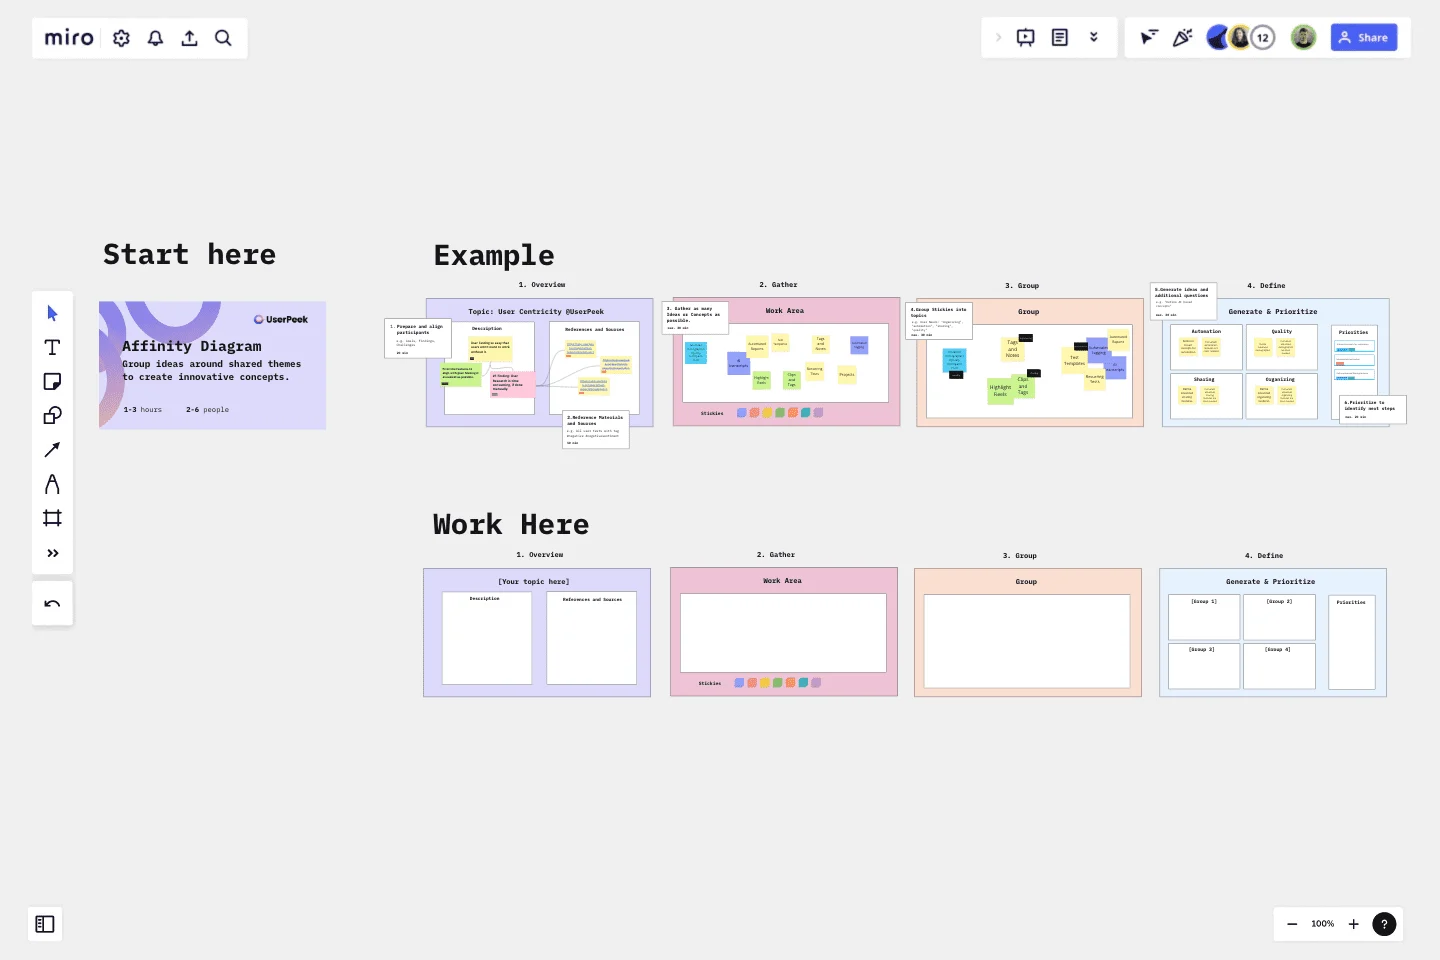
Affinity Diagram by UserPeek
This visual tool transforms complex processes into structure by grouping large volumes of information or ideas based on inherent relationships.
UserPeek's Affinity Diagram Template is perfect for
handling unstructured data,
interpreting subjective feedback,
managing intricate projects,
streamlining processes,
and bolstering decision-making.
This visual tool transforms complex processes into structure by grouping large volumes of information or ideas based on inherent relationships. It doesn't just collate ideas, but uncovers patterns and themes, guiding teams towards innovative solutions.
This template was created by UserPeek.
Get started with this template right now.
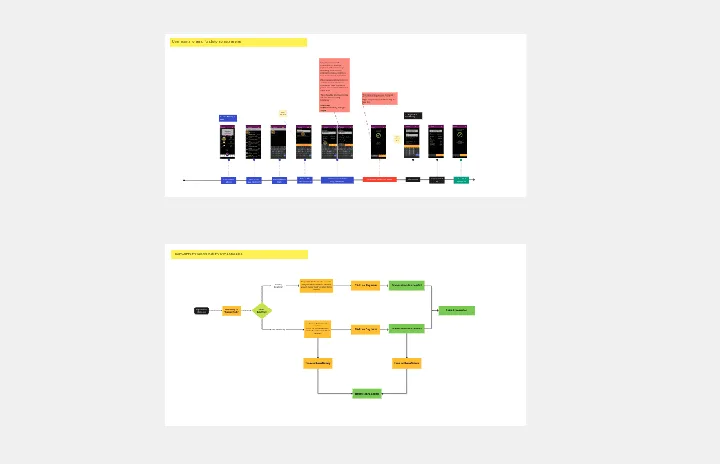
Bank Mobile App User Journey
Works best for:
Diagramming
The Bank Mobile App User Journey template offers a visual framework for mapping out the user experience journey within a banking mobile application. It provides elements for visualizing user interactions, touchpoints, and emotions throughout the journey. This template enables teams to understand user needs, pain points, and opportunities for improvement, facilitating the design of user-friendly and intuitive banking apps. By promoting empathy and user-centric design, the Bank Mobile App User Journey template empowers teams to create digital experiences that meet customer expectations and drive engagement.
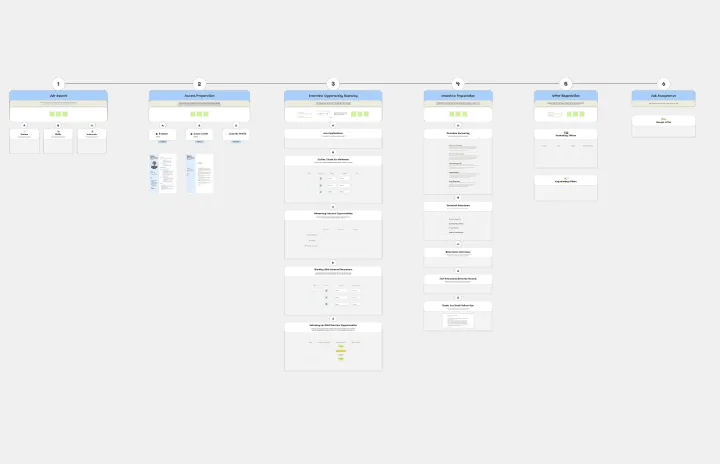
Job Search Process Diagram
Works best for:
Diagramming
The Job Search Process Diagram template offers a visual tool for mapping out the steps and stages involved in the job search process. It provides a structured framework for organizing tasks, tracking progress, and managing resources. This template enables job seekers to streamline their job search efforts, stay organized, and increase their chances of success. By promoting clarity and efficiency, the Job Search Process Diagram empowers individuals to navigate the job market effectively and achieve their career goals.
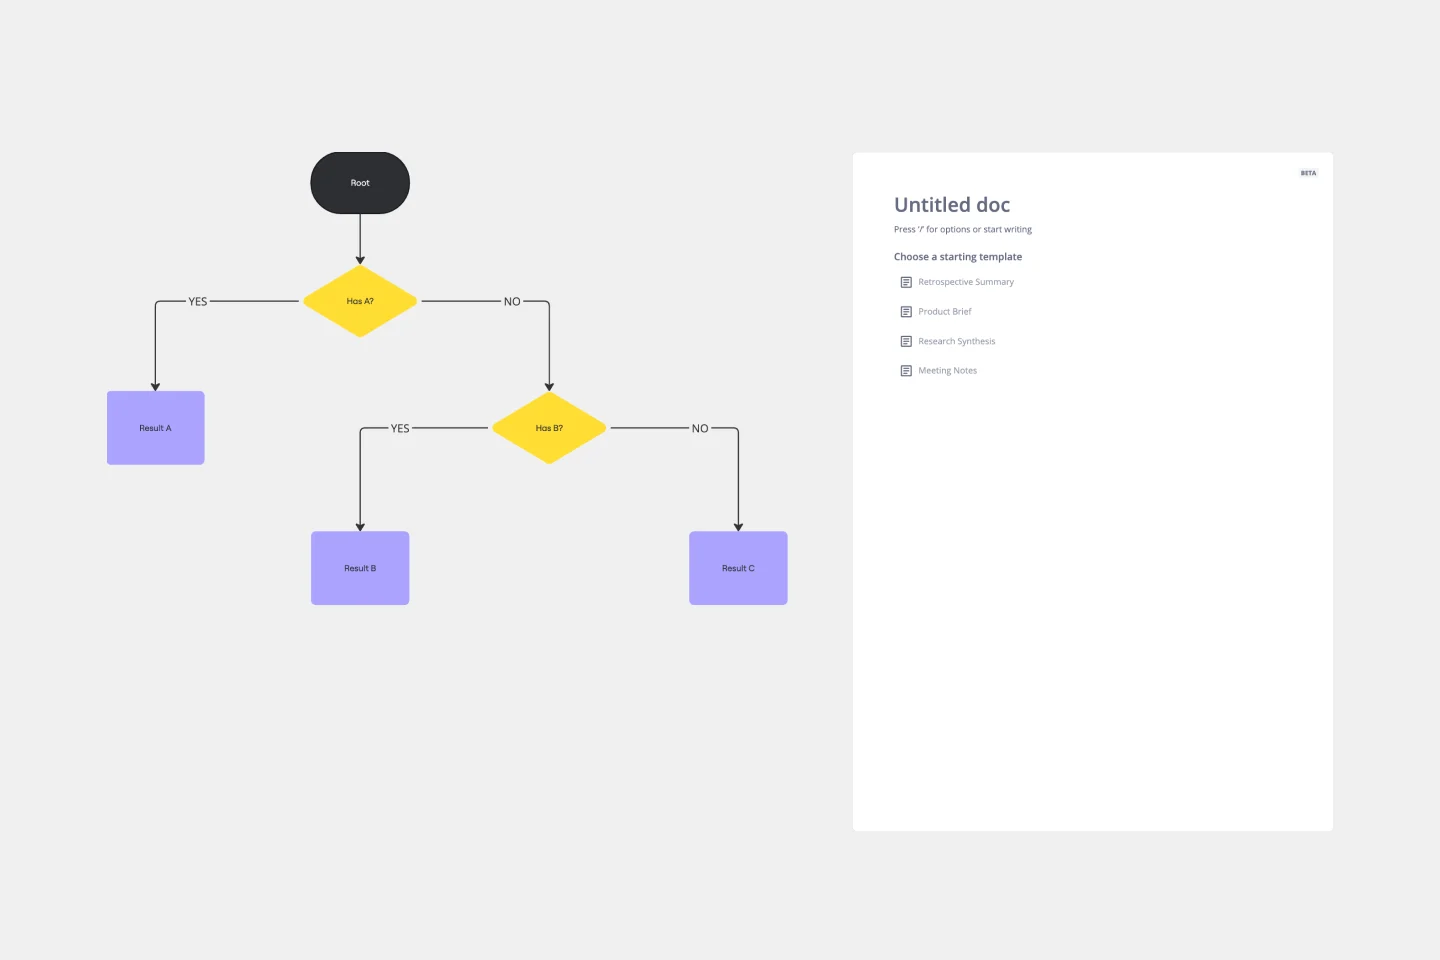
Dichotomous Key Template
Works best for:
Diagramming
The Dichotomous Key Template stands out as an exceptional tool for simplifying complex classification processes, significantly enhancing learning experiences. Breaking down intricate subjects into a series of binary decisions transforms how information is absorbed and understood. This systematic approach not only aids in retaining intricate details but also makes the learning process more engaging and interactive. Whether for educational purposes or professional use, the template’s design fosters a deeper comprehension of the subject matter, allowing learners and professionals to navigate complex scenarios with clarity and ease.
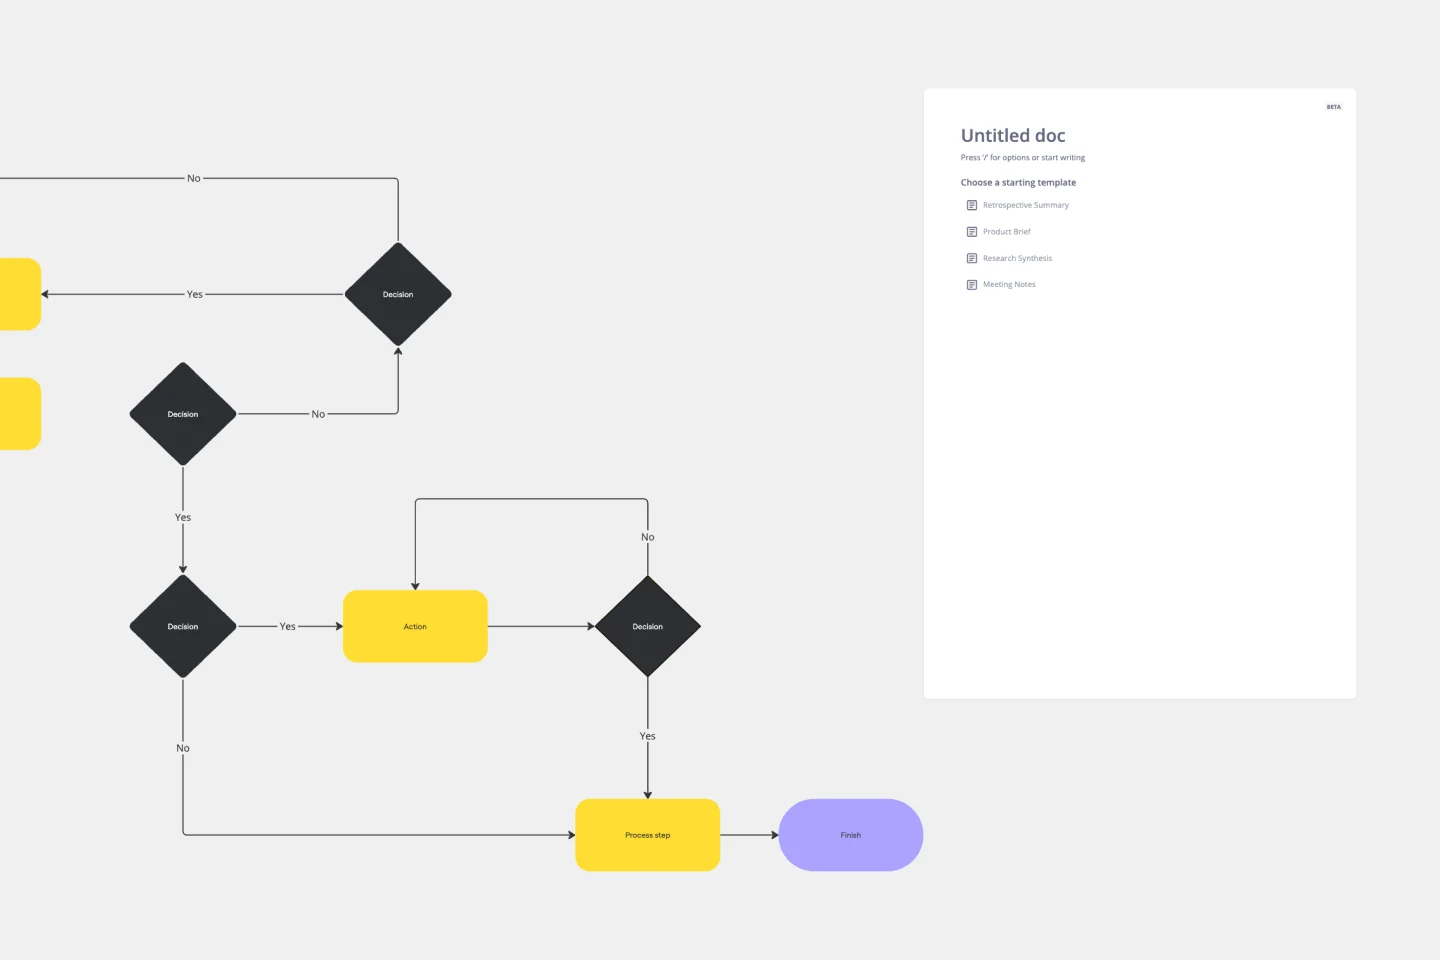
Production Flowchart Template
Works best for:
Flowcharts
The Production Flowchart Template is a well-crafted tool that clearly represents a production process from start to finish. It breaks down complex procedures into easy-to-understand segments, making it easier for stakeholders to grasp the entire process. One of the key benefits of using this template is that it helps to clarify complex production pathways. By mapping out operations visually, teams can identify potential bottlenecks or inefficiencies, facilitating timely and well-informed decision-making.
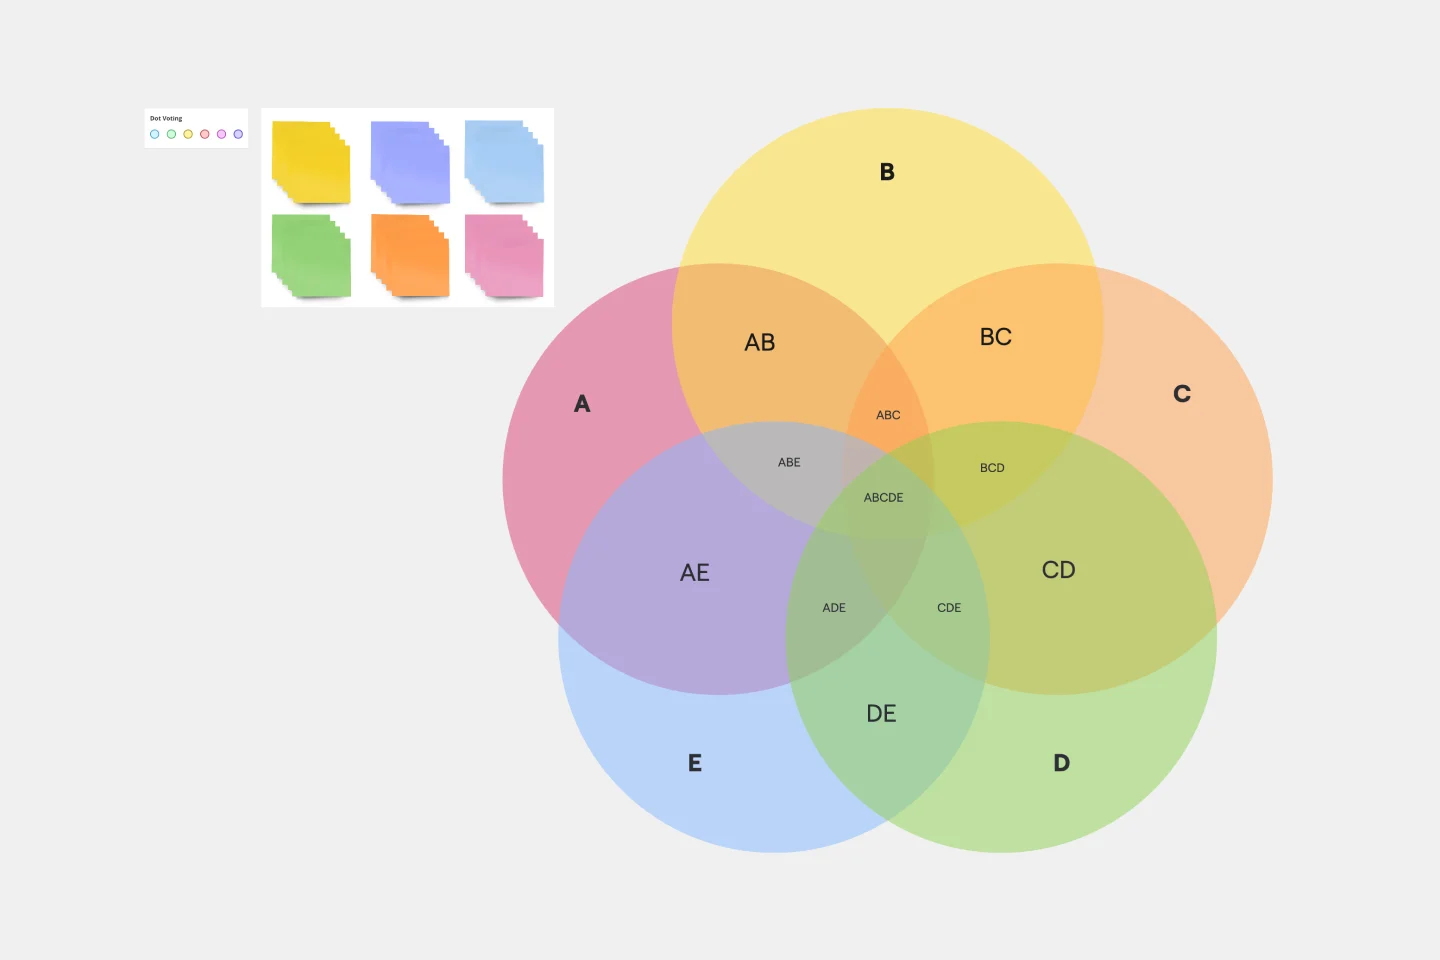
5-Circle Venn Diagram Template
Works best for:
Diagramming, Mapping, Brainstorming
Discover how Miro's 5 Circle Venn Diagram Template can simplify complex decision-making processes. Learn how to create, customize, and share your diagrams for effective visual collaboration. Transform brainstorming sessions with real time, remote teamwork.