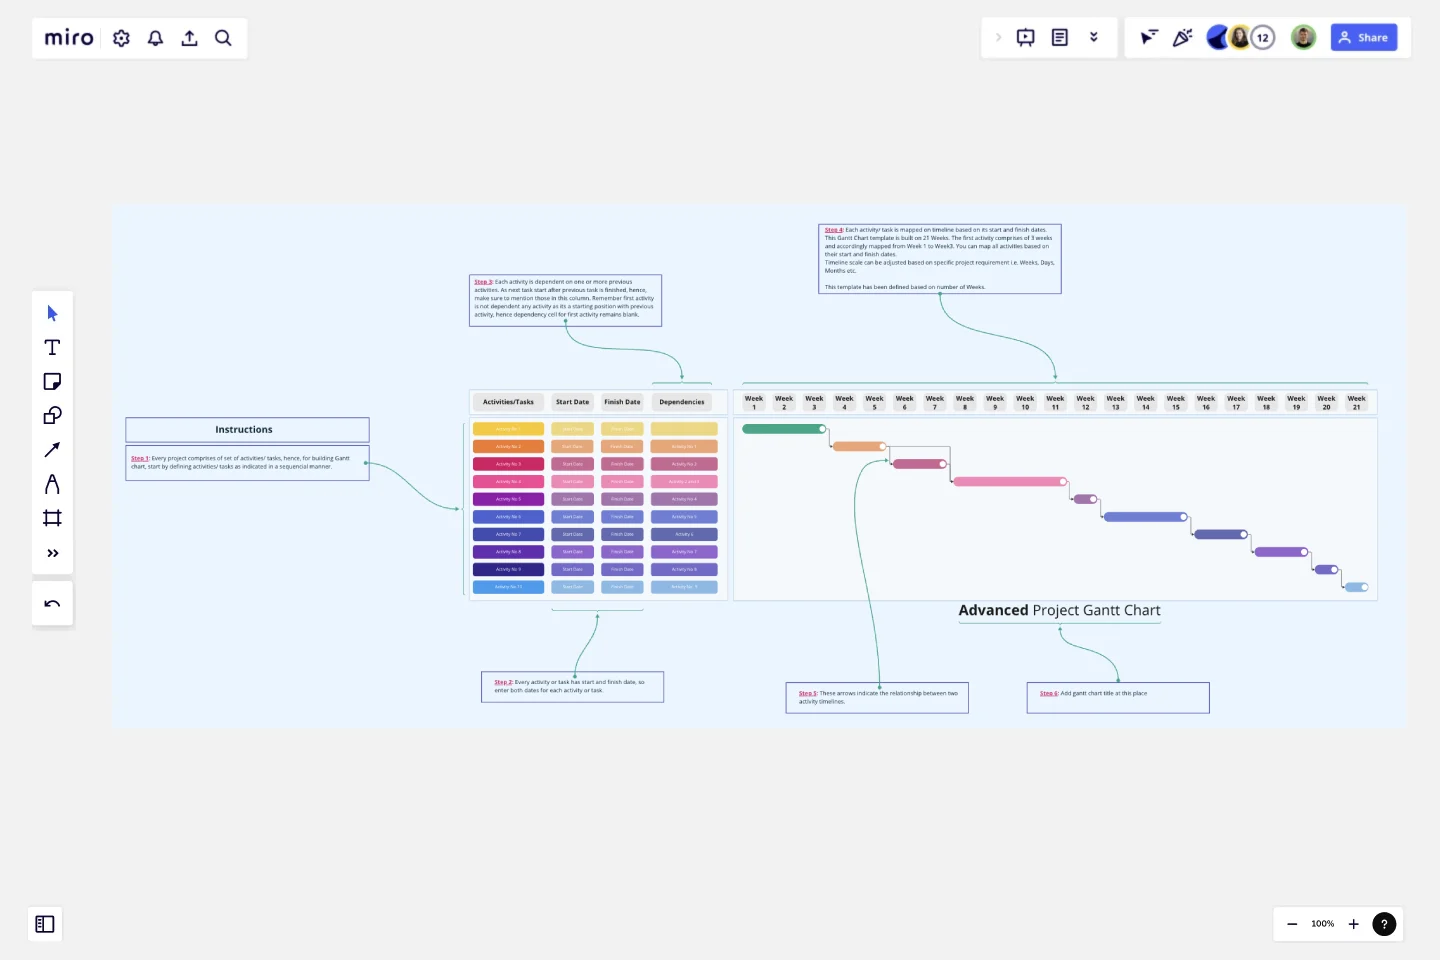
Advanced Project Gantt Chart Template
This Advanced Project Gantt Chart Template is designed to help you plan, manage, and track the progress of your projects efficiently over a 21-week period.
You can select duration in Days and Months as well, depending upon the length of the project.Whether you're working on a software development project or any other type of complex project, this template provides a comprehensive framework to ensure all activities and tasks are organized and dependencies are clearly defined.What is this template about? The template is a visual project management tool that outlines the key phases and tasks of a project, including start and finish dates, dependencies, and timelines. It includes an example titled "Software Development Phases" to demonstrate how to use the template effectively.
What it helps to achieve?:
Effective Project Planning: Clearly define and schedule all project activities and tasks.
Time Management: Allocate start and finish dates for each task to ensure timely completion.
Dependency Tracking: Identify and manage task dependencies to prevent bottlenecks.
Progress Monitoring: Visualize the entire project timeline to track progress and make adjustments as needed.
Who would benefit from it the most?:
Project Managers: To plan, execute, and monitor project timelines.
Team Leaders: To assign tasks and manage team workload.
Software Development Teams: To organize and track software development phases.
Students and Educators: To learn and teach project management principles.
How to use it:
Define Project Phases: Use the provided example "Software Development Phases" as a guide to define the key phases of your project.
List Tasks and Activities: Break down each phase into specific tasks and activities.
Set Start and Finish Dates: Assign start and finish dates to each task to create a timeline.
Identify Dependencies: Use the dependencies feature to link tasks that are dependent on the completion of others.
Track Progress: Update the chart regularly to reflect the progress of each task and make any necessary adjustments to the timeline.
With this template, you can streamline your project management process and ensure successful project completion. Enjoy the benefits of visualizing your project from start to finish and keeping your team aligned and on track.
This template was created by Khawaja Rizwan.
Get started with this template right now.
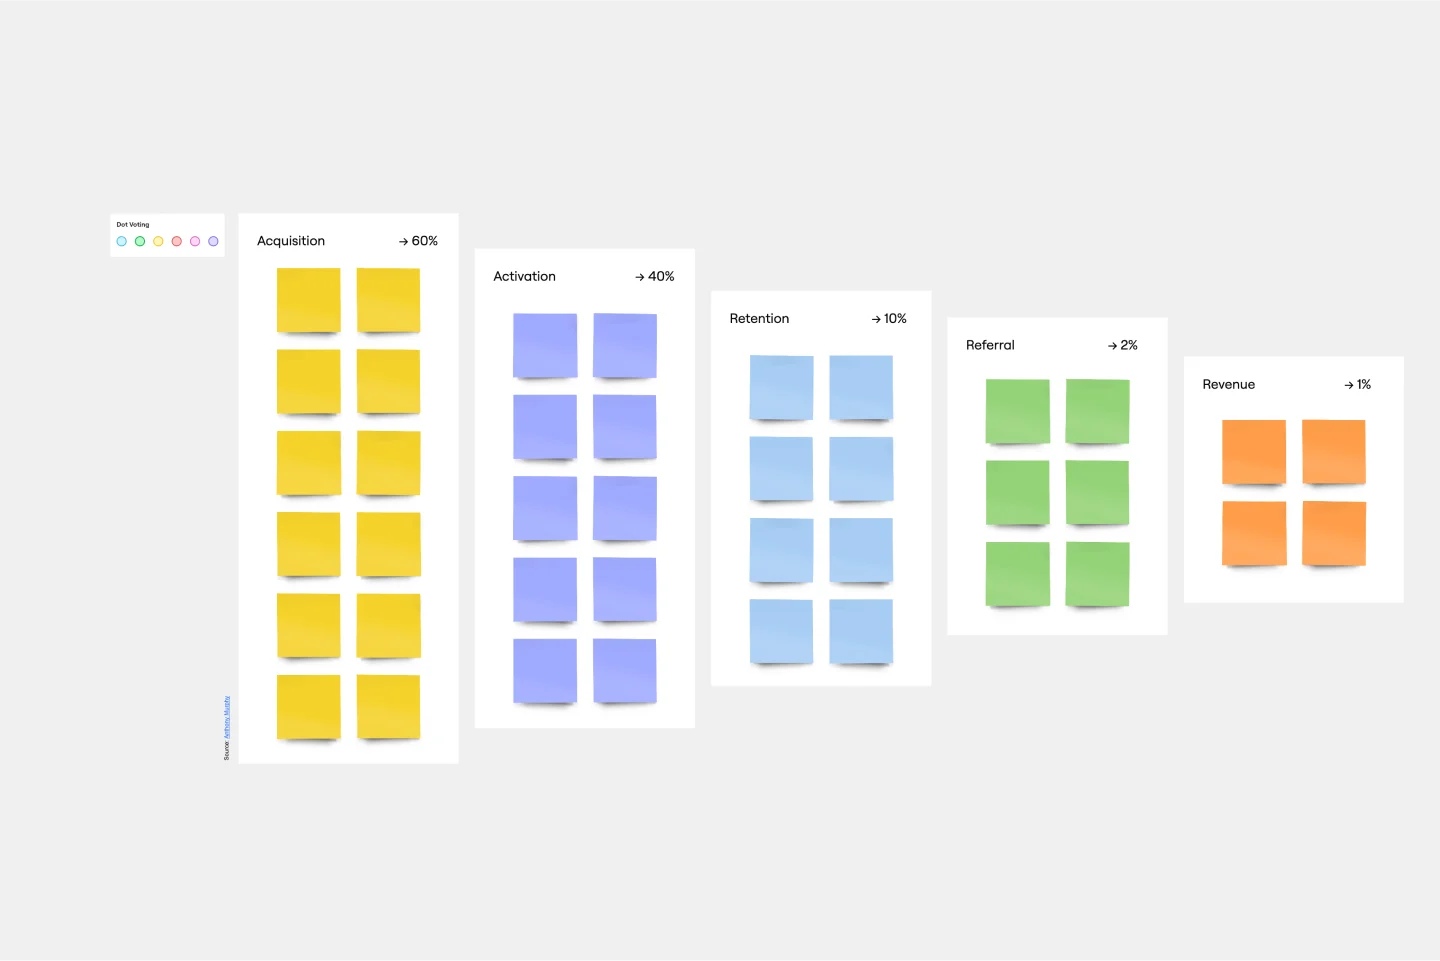
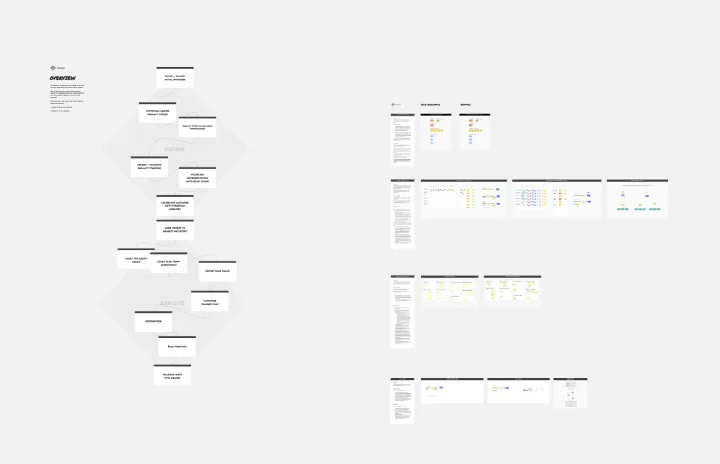
Conversion Funnel Backlog Template
Works best for:
Decision Making, Product Management, Prioritization
If you’re working on a product that has clear conversions, then it can help to structure your backlog around the conversion funnel to make sure you’re reaching your audience. Creating a conversion funnel backlog brings together information around potential pain-points in your funnel and opportunities for growth. Once you’ve identified that information, it becomes easier to prioritize. You and your team can use the conversion funnel backlog to focus on conversion, retention, and referral, or to tweak your workflow in more mature products.
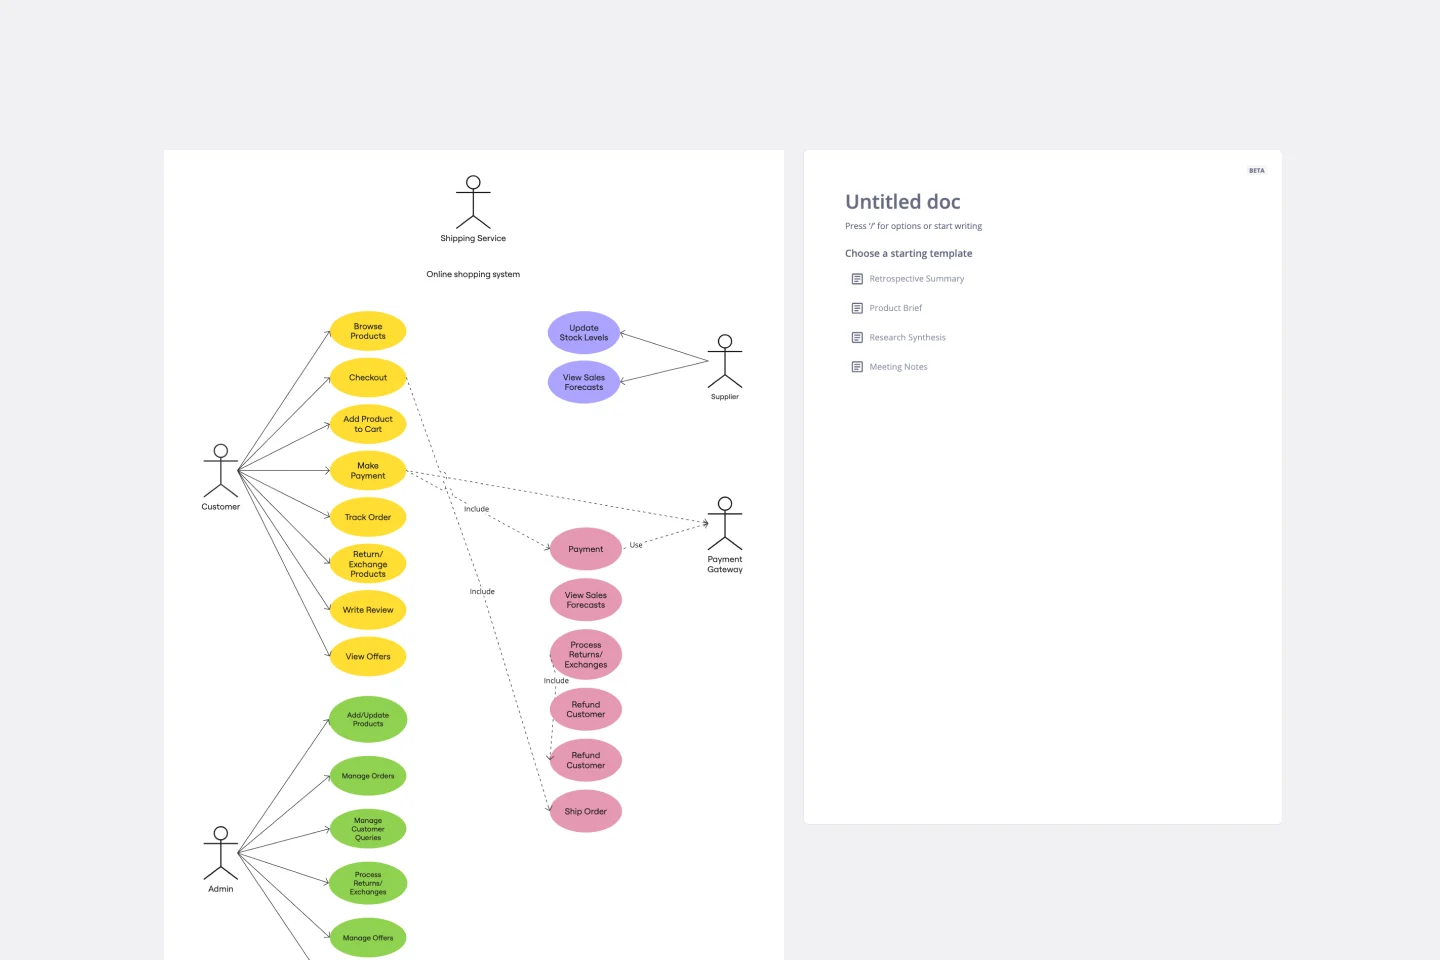
UML Use Case Online Shopping System Template
Works best for:
UML
The Online Shopping System Template simplifies the process of documenting and visualizing how users interact with an online shopping system. It provides a standard way to map out user interactions, such as product listings, inventory management, shopping carts, order processing, payments, and shipping details. By using this template, teams can collaborate effectively in real-time or at different times, adjusting the diagram to meet their project's specific needs. This not only improves clarity and efficiency but also fosters better communication among team members and stakeholders, ensuring a thorough understanding of the system's design and requirements.
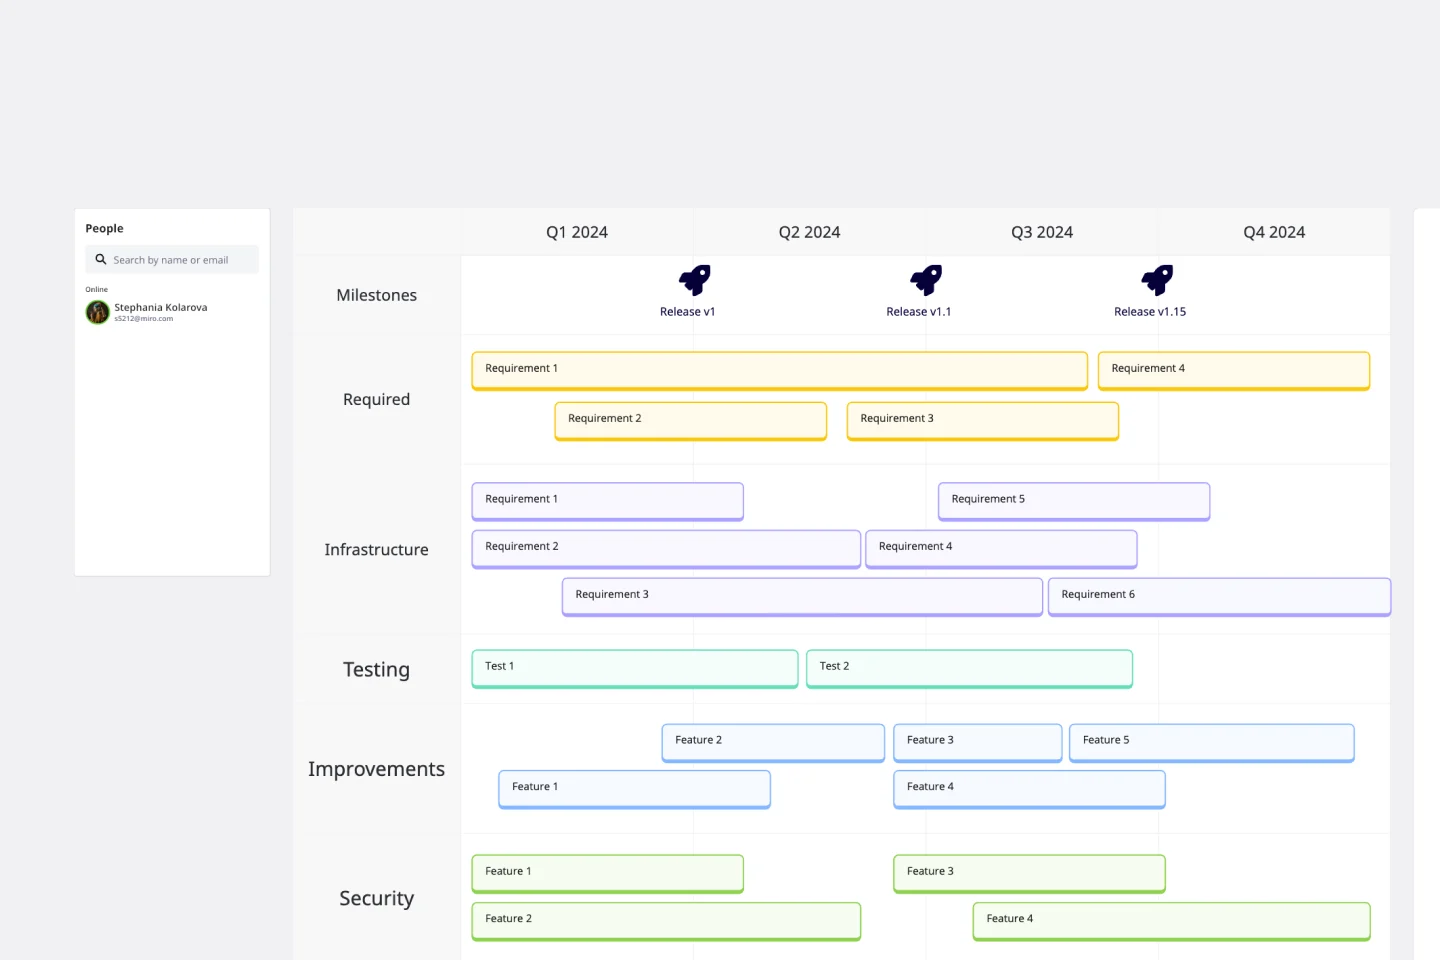
Technology Roadmap Template
Works best for:
Agile Methodology, Roadmaps, Agile Workflows
A technology roadmap helps teams document the rationale of when, why, how, and what tech-related solutions can help the company move forward. Also known as IT roadmaps, technology roadmaps show teams what technology is available to them, focusing on to-be-scheduled improvements. They allow you to identify gaps or overlap between phased-out tech tools, as well as software or programs soon to be installed. From a practical point of view, the roadmap should also outline what kinds of tools are best to spend money on, and the most effective way to introduce new systems and processes.
Product Thinking Board
Works best for:
Product Management, Planning
Product Thinking Board template encourages a user-centered approach to product development. By fostering empathy, collaboration, and experimentation, this template stimulates innovative thinking and problem-solving. With sections for user research, ideation, and prototyping, it supports iterative product design and validation. This template serves as a visual framework for product teams to engage in user-centric design thinking processes, driving the creation of products that truly meet user needs and deliver exceptional experiences.
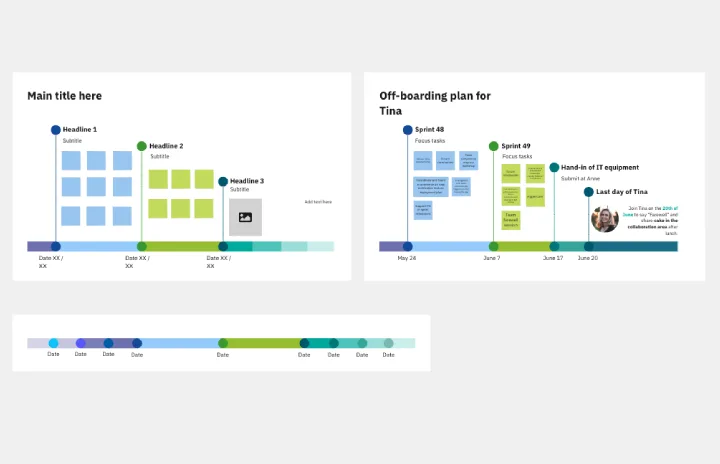
Timeline Design
Works best for:
Timeline, Planning
The Timeline Design template is perfect for creating visually engaging timelines. It helps you showcase project milestones, deadlines, and important events in a clear and attractive format. Ideal for presentations and reports, this template ensures your timeline is both informative and visually appealing.
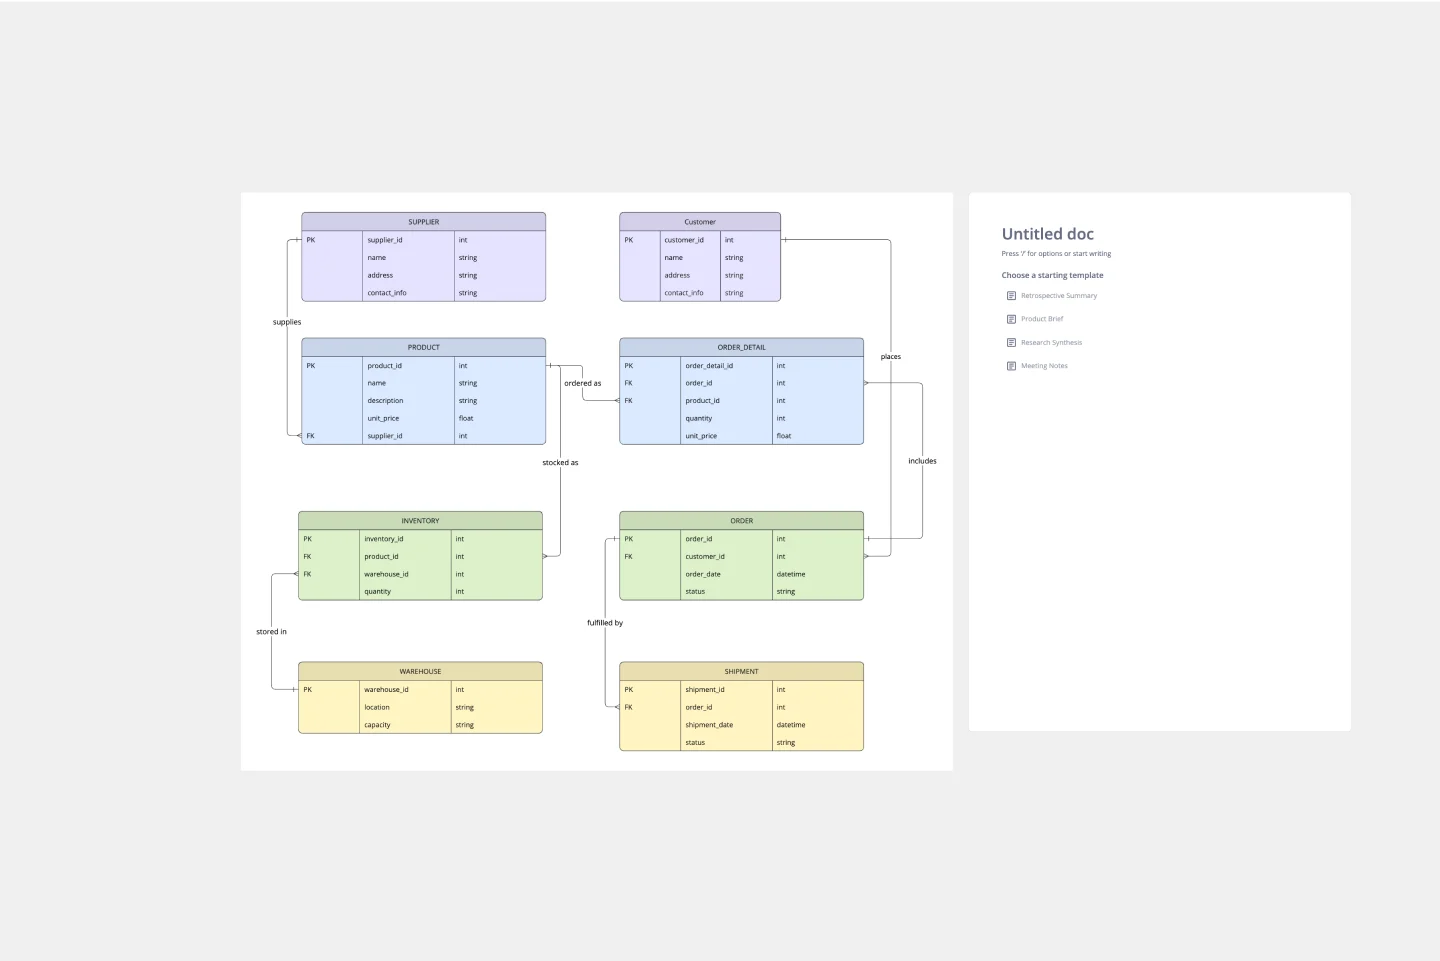
ERD Supply Chain Management System Template
Works best for:
ERD
The ERD Supply Chain Management System Template streamlines and optimizes supply chain operations. It serves as a visual support that helps businesses understand and manage the complex relationships between different entities within their supply chain, such as suppliers, products, inventory, orders, and shipments. By providing a clear visualization of these relationships, the template enables users to identify inefficiencies and areas for improvement, facilitating strategic decision-making.