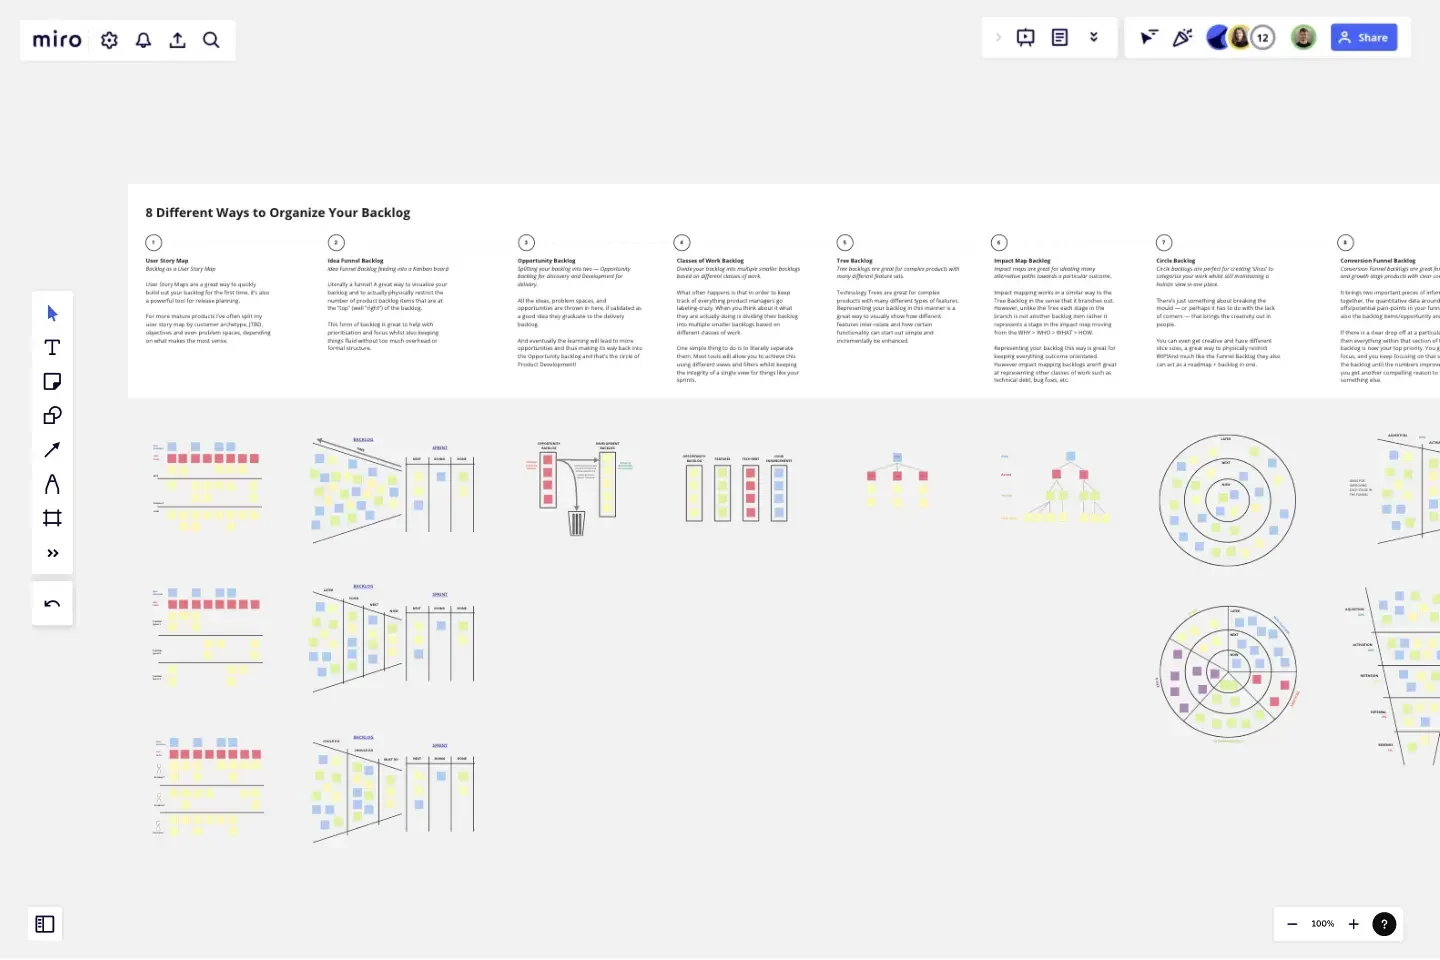
8 Different Ways to Organize Your Backlog
Often we don’t question our product backlogs, they’re a list of stuff we hope, might and would like to do, but do they always have to be represented as a list?
The 8 Different Ways to Organize Your Backlog
1. User Story Map
Backlog as a User Story MapUser Story Maps are a great way to quickly build out your backlog for the first time, it’s also a powerful tool for release planning.
For more mature products I’ve often split my user story map by customer archetype, JTBD, objectives and even problem spaces, depending on what makes the most sense.
2. Idea Funnel Backlog
Idea Funnel Backlog feeding into a Kanban board.
Literally a funnel! A great way to visualise your backlog and to actually physically restrict the number of product backlog items that are at the “top” (well “right”) of the backlog.
This form of backlog is great to help with prioritisation and focus whilst also keeping things fluid without too much overhead or formal structure.
3. Opportunity Backlog
Splitting your backlog into two — Opportunity backlog for discovery and Development for delivery.
All the ideas, problem spaces, and opportunities are thrown in here, if validated as a good idea they graduate to the delivery backlog.
And eventually the learning will lead to more opportunities and thus making its way back into the Opportunity backlog and that’s the circle of Product Development!
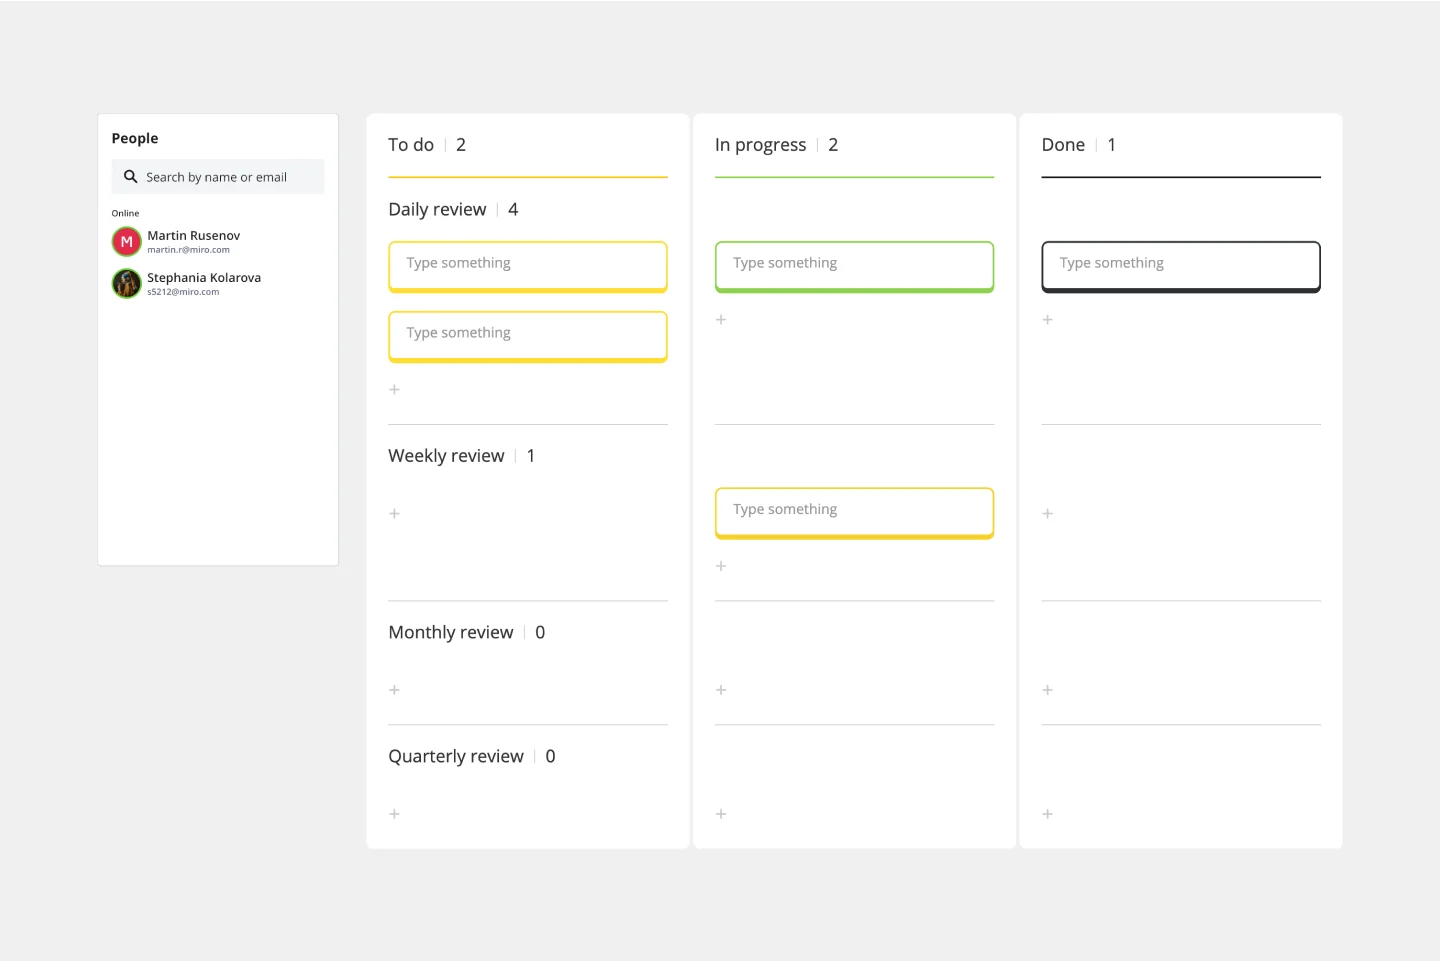
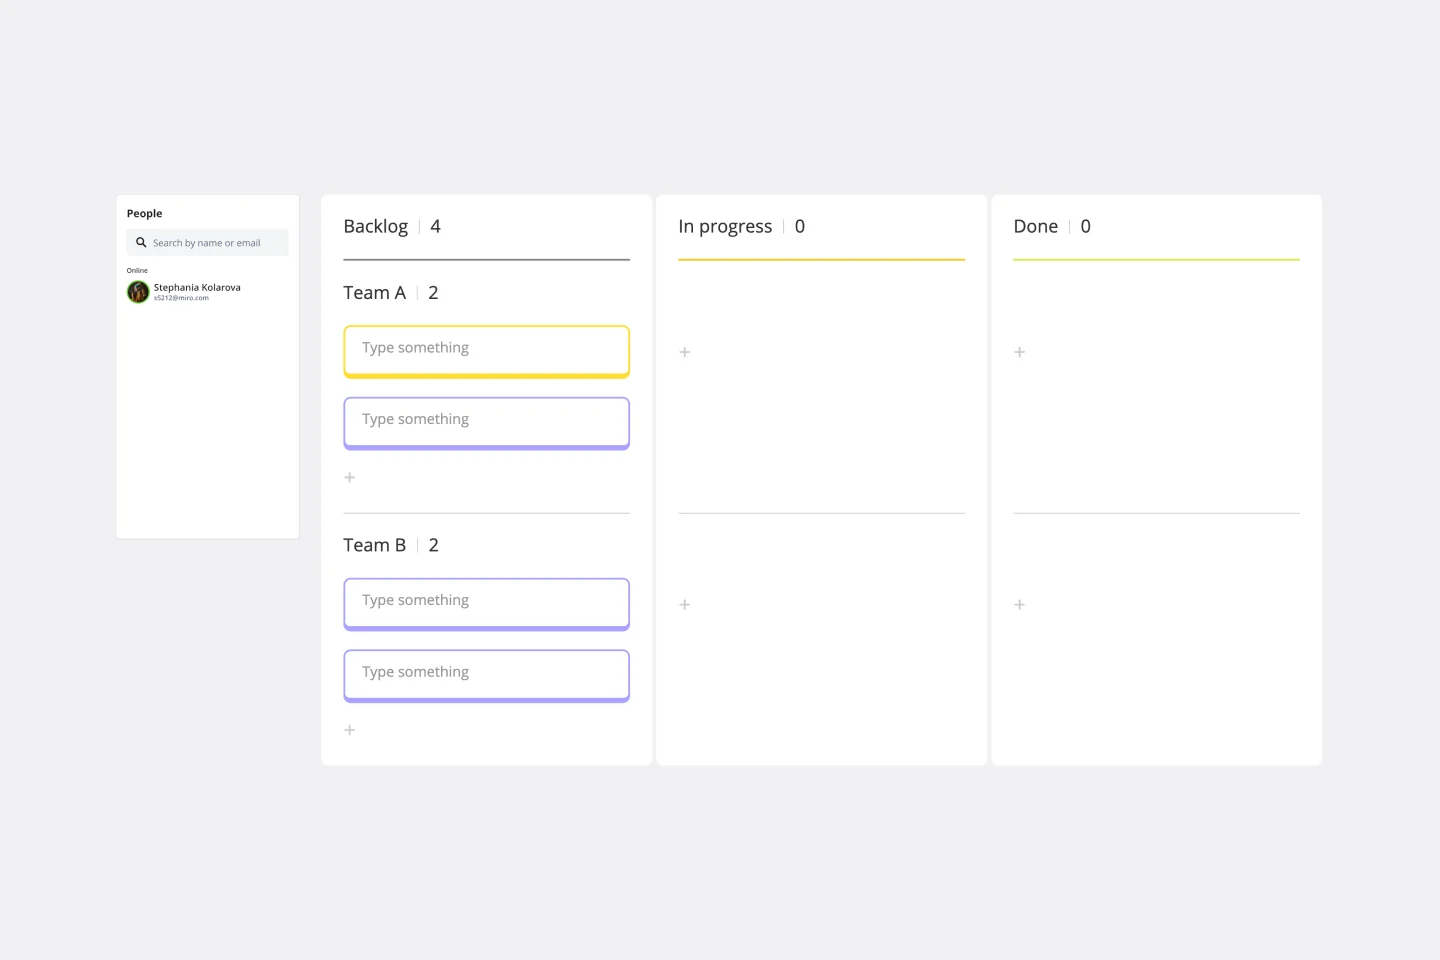
4. Classes of Work Backlog
Divide your backlog into multiple smaller backlogs based on different classes of work.
What often happens is that in order to keep track of everything product managers go labeling-crazy. When you think about it what they are actually doing is dividing their backlog into multiple smaller backlogs based on different classes of work.
One simple thing to do is to literally separate them. Most tools will allow you to achieve this using different views and filters whilst keeping the integrity of a single view for things like your sprints.
5. Tree Backlog
Tree backlogs are great for complex products with many different feature sets.
Technology Trees are great for complex products with many different types of features. Representing your backlog in this manner is a great way to visually show how different features inter-relate and how certain functionality can start out simple and incrementally be enhanced.
6. Impact Map Backlog
Impact maps are great for ideating many alternative paths towards a particular outcome.
Impact mapping works in a similar way to the Tree Backlog in the sense that it branches out. However, unlike the Tree each stage in the branch is not another backlog item rather it represents a stage in the impact map moving from the WHY > WHO > WHAT > HOW.
Representing your backlog this way is great for keeping everything outcome orientated. However impact mapping backlogs aren’t great at representing other classes of work such as technical debt, bug fixes, etc.
7. Circle Backlog
Circle backlogs are perfect for creating ‘slices’ to categorise your work whilst still maintaining a holistic view in one place.
There’s just something about breaking the mould — or perhaps it has to do with the lack of corners — that brings the creativity out in people.
You can even get creative and have different slice sizes, a great way to physically restrict WIP!And much like the Funnel Backlog they also can act as a roadmap + backlog in one.
8. Conversion Funnel Backlog
Conversion Funnel backlogs are great for early and growth stage products with clear conversions.
It brings two important pieces of information together, the quantitative data around drop-offs/potential pain-points in your funnel but also the backlog items/opportunity areas.
If there is a clear drop off at a particular point then everything within that section of the backlog is now your top priority. You get laser-focus, and you keep focusing on that section of the backlog until the numbers improve or if you get another compelling reason to focus on something else.
This template was created by Ant Murphy.
Get started with this template right now.
Action Plan Template
Works best for:
Education, Project Management, Project Planning, Kanban
Why create an action plan? Long-term business strategies and goals are only good if you can make them a reality—by accomplishing every small task along the way. An action plan lists those tasks and lays them out in clear detail. It helps you keep everything in order, make sure nothing is missed, and get stakeholders on the same page to complete a project quickly and effectively. This template will help you write an action plan that’s SMART: Specific, Measurable, Actionable, Realistic, and Time-bound.
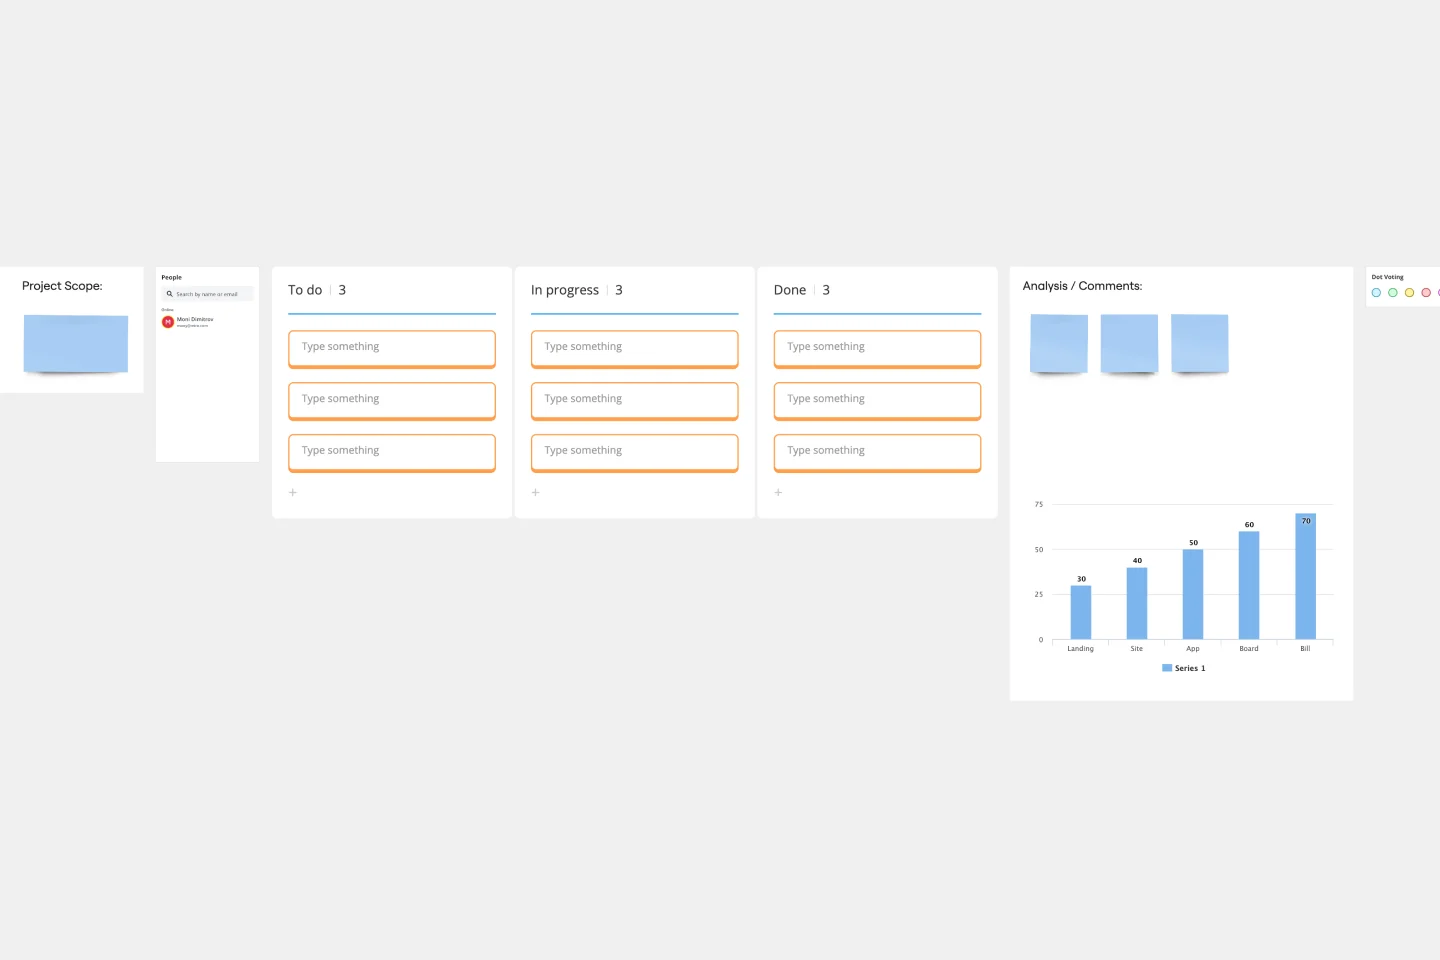
Kanban Framework Template
Works best for:
Kanban Boards, Agile Methodology, Agile Workflows
Optimized processes, improved flow, and increased value for your customers — that’s what the Kanban method can help you achieve. Based on a set of lean principles and practices (and created in the 1950s by a Toyota Automotive employee), Kanban helps your team reduce waste, address numerous other issues, and collaborate on fixing them together. You can use our simple Kanban template to both closely monitor the progress of all work and to display work to yourself and cross-functional partners, so that the behind-the-scenes nature of software is revealed.
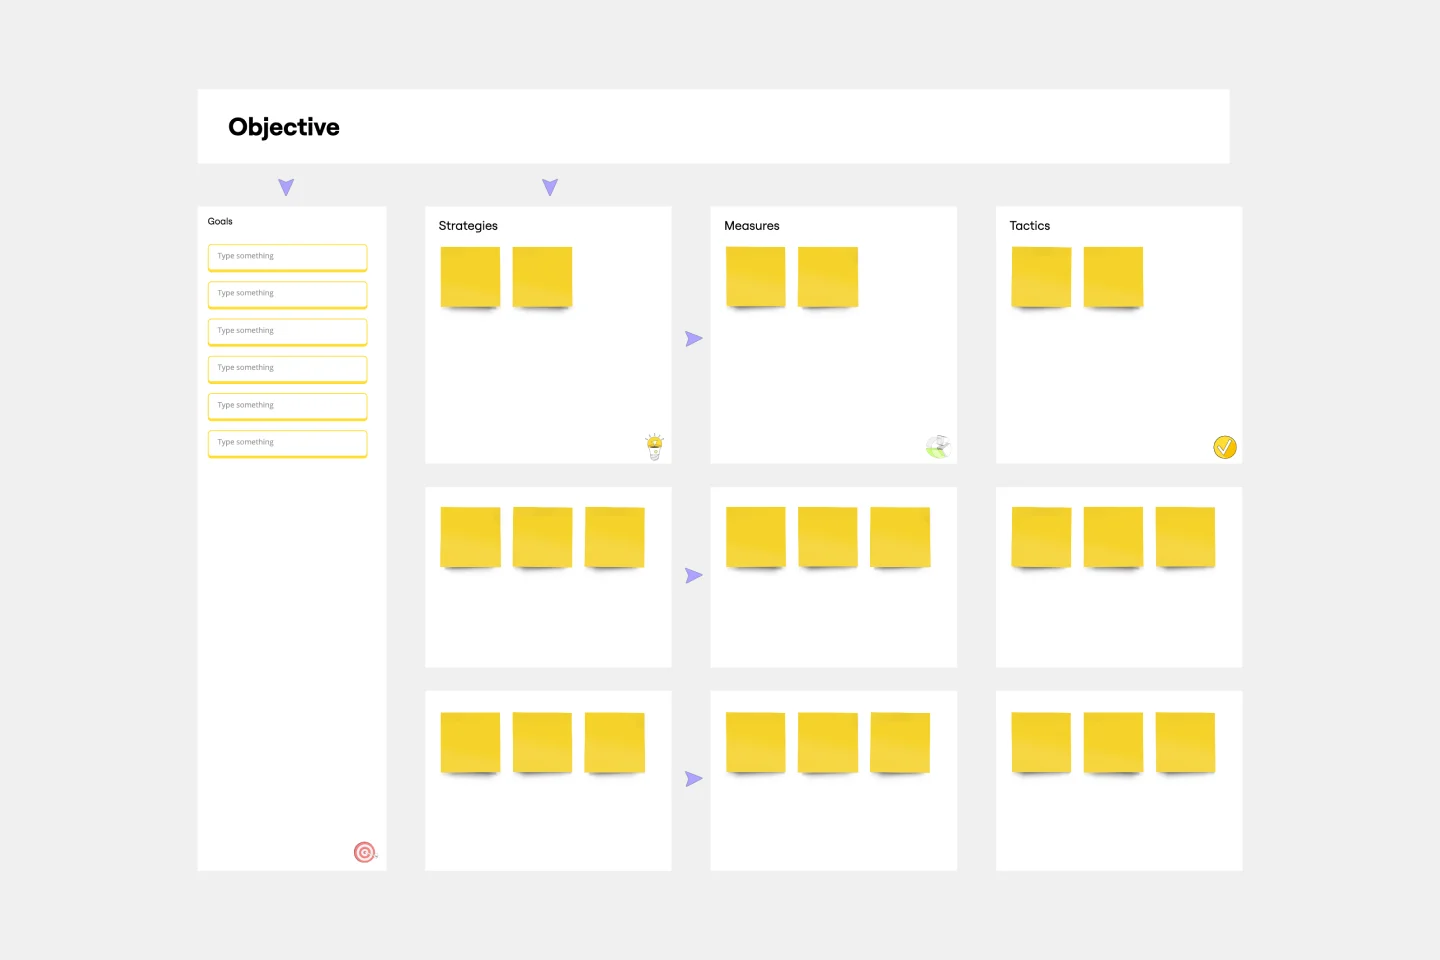
OGSM Template
Works best for:
Strategy, Planning
The OGSM template provides a readable framework, systematically breaking down business strategies into Objectives, Goals, Strategies, and Measures. This structured approach ensures that overarching visions are translated into actionable plans, fostering alignment across different teams and initiatives. One standout benefit of using this template is its ability to offer clarity. By clearly delineating between broad objectives and specific measures, stakeholders can easily comprehend and stay focused on the most critical elements of a strategy, ensuring that all efforts are directed toward the desired outcomes.
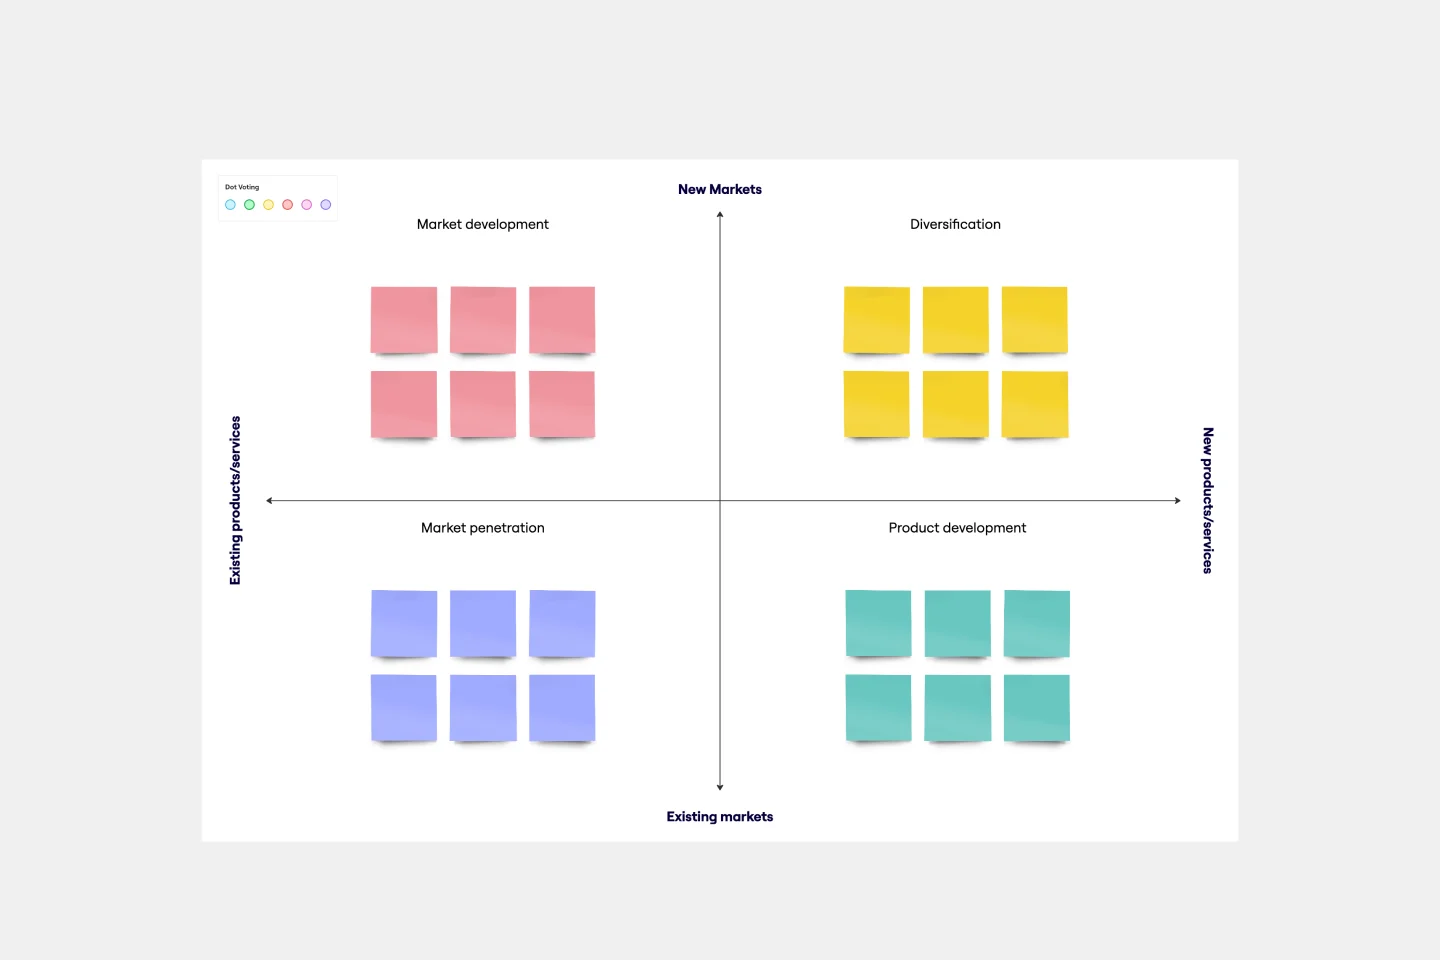
Ansoff Matrix Template
Works best for:
Leadership, Operations, Strategic Planning
Keep growing. Keep scaling. Keep finding those new opportunities in new markets—and creative new ways to reach customers there. Sound like your approach? Then this template might be a great fit. An Ansoff Matrix (aka, a product or market expansion grid) is broken into four potential growth strategies: Market Penetration, Market Development, Product Development, and Diversification. When you go through each section with your team, you’ll get a clear view of your options going forward and the potential risks and rewards of each.
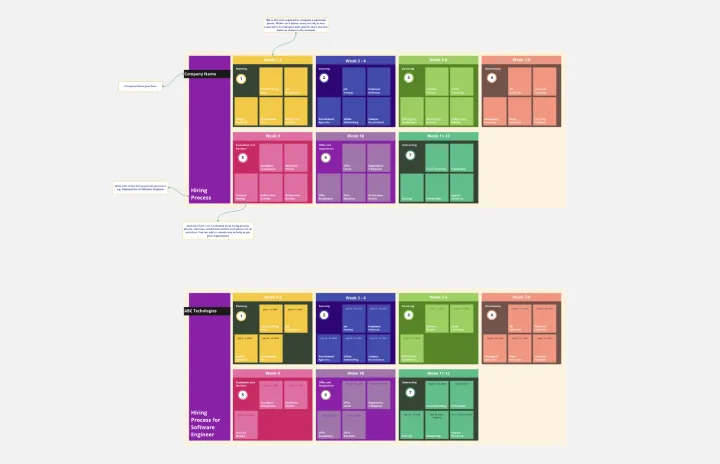
Hiring Process Timeline
Works best for:
Timeline, Planning
Streamline your recruitment process with the Hiring Process Timeline by Rizwan Khawaja. This template helps you organize every step of hiring, from job advertisement to final onboarding. Visualize timelines, track candidates, and ensure an efficient hiring workflow. Perfect for HR professionals aiming to improve their recruitment strategy and reduce time-to-hire.
Project Status Report Template
Works best for:
Project Management, Documentation, Project Planning
When a project is in motion, the project manager must keep clients and shareholders updated on the project’s progress. Rather than waste time with constant meetings, leaders can send out weekly or daily project status reports to keep everyone informed. You can use the Project Status Report Template to streamline the report creation and distribution process.