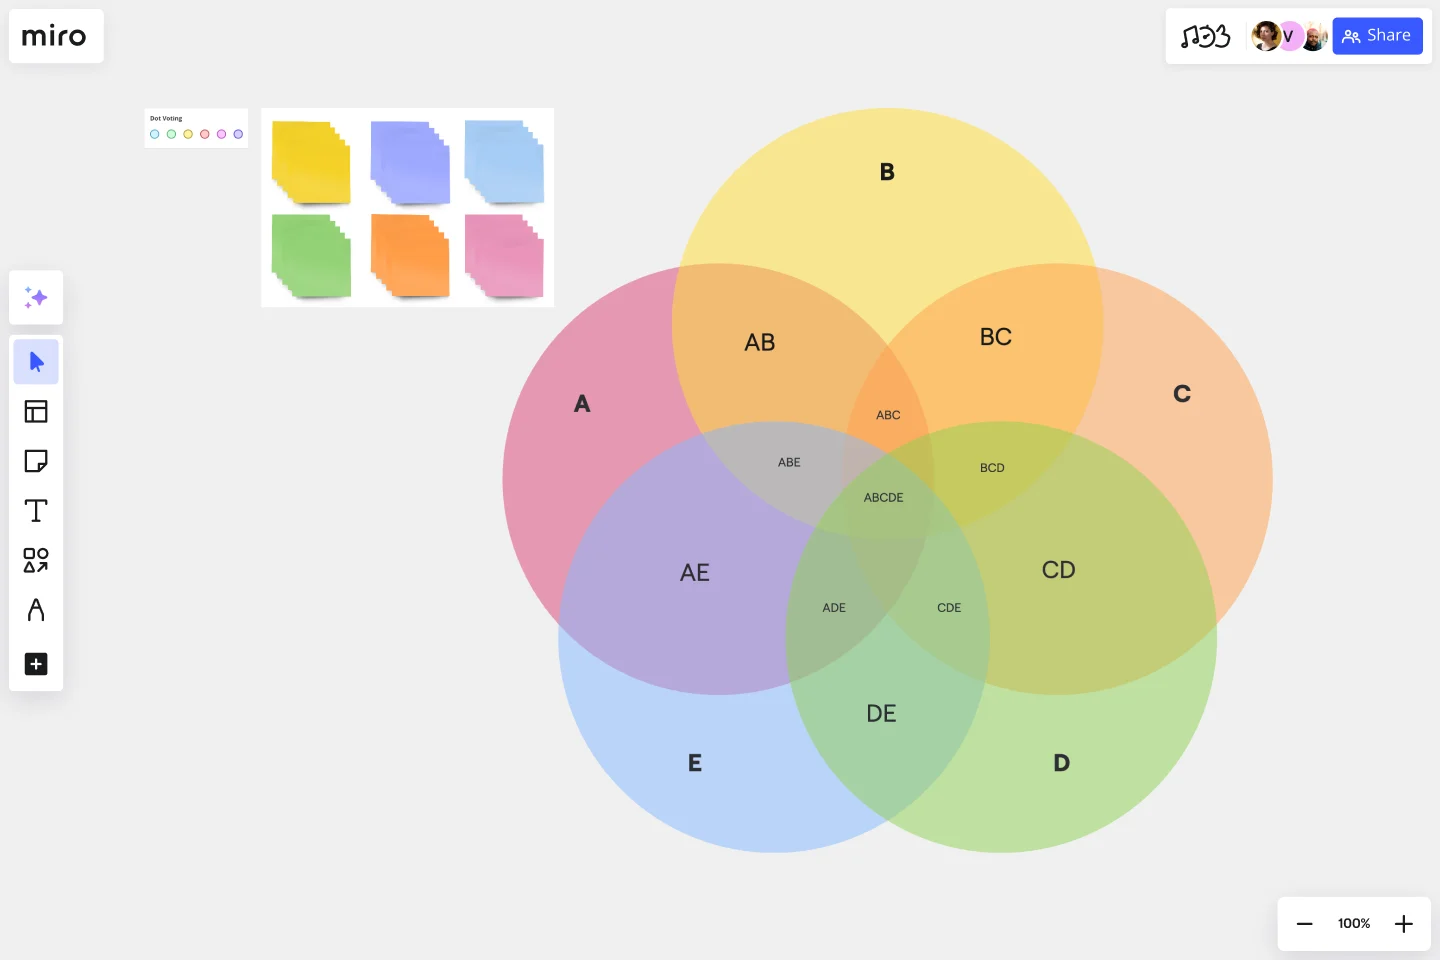
5-Circle Venn Diagram Template
Visualize relationships between many datasets, and make more informed decisions, stimulating creative thinking and fostering more productive discussions with Miro’s 5-circle Venn Diagram Template.
About the 5-circle Venn Diagram Template
To harness the power of visualization in problem-solving, planning, or brainstorming, Miro presents the 5 Circle Venn Diagram Template. This template is designed to help users identify and display the logical relationships among five groups, making the decision-making process more efficient and effective.
What's a 5-circle Venn Diagram Template?
A 5 Circle Venn Diagram Template is a diagramming tool that visually showcases the overlap and intersection of five different groups or categories. Each circle represents a category, and the overlap between circles indicates a commonality among those categories. By arranging these circles to intersect at various points, one can map out the relationship and interactions between diverse elements, revealing patterns, and potential connections.
How to use the 5-circle Venn Diagram Template
Step 1: Select the 5-circle Venn Diagram Template Choose the 5 Circle Venn Diagram Template from Miro's template library.
Step 2: Customize the template Once the template is on your Miro board, you can edit it. This includes changing the size and color of the circles, adjusting their positioning, or adding labels and descriptions.
Step 3: Add text and labels For each circle, add text that accurately represents the category. Then, in the overlapping sections of the circles, write down the commonalities between the respective categories.
Step 4: Collaborate with your team Now, you're ready for a brainstorming session. Miro allows real time collaboration, so invite your team members to contribute to the diagram. They can add their ideas, suggestions, or insights to the Miro board.
Step 6: Save and share the 5-circle Venn Diagram Once the session ends, you can save the diagram for future reference. Miro offers various export options, including JPEG, PNG, and PDF. You can also share the diagram directly from the platform via email or link, ensuring that all stakeholders can easily access the information.
Miro is the perfect Venn diagram maker with a range of available templates and the ability to customize everything, from the number of circles to labeling and colors. Create professional Venn diagrams that will help you explain complex topics with confidence.
Can a 5-circle Venn Diagram Template handle more than five categories?
While the 5-circle Venn Diagram Template is optimized for five categories, users can technically add additional circles or use other diagramming tools offered by Miro to manage a higher number of categories.
Is the 5-circle Venn Diagram Template suitable for remote collaboration?
Absolutely. Miro's platform is designed for seamless remote collaboration. Multiple team members can work on the same diagram simultaneously in real time, making it an excellent tool for distributed teams.
Can users save and share the 5-circle Venn Diagram created in Miro?
Yes. Diagrams created using Miro's 5-circle Venn Diagram Template can be easily saved and shared. Miro offers a range of export options, including JPEG, PNG, and PDF, and diagrams can be shared directly from the platform via email or link.
Is it possible to customize the 5-circle Venn Diagram Template in Miro?
Miro's templates, including the 5-circle Venn Diagram, are fully customizable. Users can adjust the circles' size, color, and positioning, add or delete text fields, and incorporate additional elements as needed.
Get started with this template right now.
3-Circle Venn Diagram
Works best for:
Education, Diagrams, Brainstorming
Venn diagrams have been a staple of business meetings and presentations since the 1800s, and there’s a good reason why. Venn diagrams provide a clear, effective way to visually showcase relationships between datasets. They serve as a helpful visual aid in brainstorming sessions, meetings, and presentations. You start by drawing a circle containing one concept, and then draw an overlapping circle containing another concept. In the space where the circles overlap, you can make note of the concepts’ similarities. In the space where they do not, you can make note of their differences.
2-Circle Venn Diagram Template
The 2 Circle Venn Diagram Template is a dynamic, intuitive tool designed to represent the logical relationships between two data sets visually. For teams, this template proves valuable in enabling efficient collaboration, clear communication, and shared understanding.
4-Circle Venn Diagram Template
Works best for:
Diagramming, Mapping, Brainstorming
The 4-Circle Venn Diagram Template has an easy, interactive, and dynamic way to visualize complex relationships between data sets. Empower your team's collaboration and communication with this powerful tool.
