3-Circle Venn Diagram
Visually understand the relationships, similarities, and differences between three different groups using our fully customizable 3-circle Venn diagram template.
About the 3-Circle Venn Diagram Template
Miro’s 3-circle Venn diagram template is a visual tool for providing a clear and effective way to showcase relationships between datasets. By overlapping two or more circles, Venn diagrams are great for visualizing the differences and similarities between multiple datasets.
It’s therefore no surprise that they’re useful for assessing probability in statistics, mathematics, and engineering. Because they can help break down complex ideas into visually appealing and digestible ways, Venn diagrams are especially useful for brainstorming and problem-solving.
Using the 3-circle Venn diagram template saves you time from having to build one from scratch. We’ll walk you through how to make the most of it.
How to use the 3-circle Venn diagram template
To get started, click on the blue “use template” button to open the 3-circle Venn diagram template in Miro. When you’re ready, follow these steps:
1. Add data to each circle
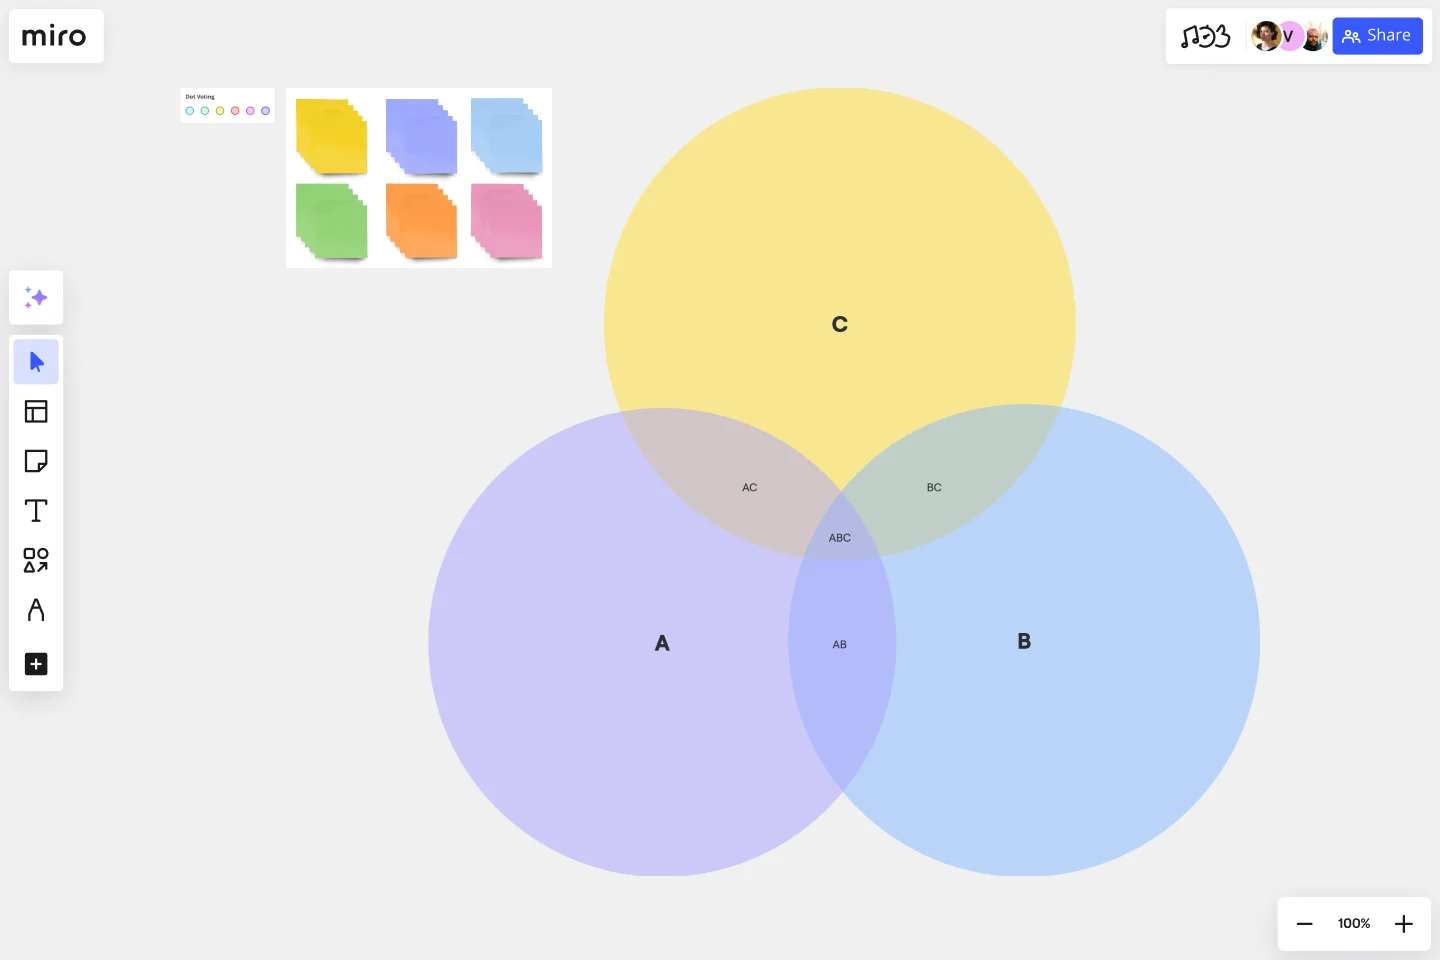
As its name implies, the 3-circle Venn diagram template comes with three circles ready for you to fill in. Identify what groups you want to compare in your Venn diagram and assign them to each circle: A, B, and C. In each circle, list the items that belong to that group.
For example, let’s say you’re comparing the qualities of an apple, a pear, and an orange. You could use circle A to list an apple’s qualities, circle B to list a pear’s qualities, and circle C to list an orange’s.
2. Identify the differences
Let’s say you’re comparing apples, pears, and oranges based on their color. You could write “red” in circle A, “green” in circle B, and “orange” in circle C. Since each fruit has a unique color, you’ll notice that none of them are part of overlapping circles. These are your differences. Double-click the text boxes in each circle to replace the pre-written text with your own.
3. Identify the similarities
Identify what all three fruits have in common and make sure that you’ve placed those qualities in the overlapping section of the circle. For example, you might write “contains seeds” as a similarity. Double-click on the text box in the overlapping section to edit the pre-written text.
4. Customize the template
Once you’ve added all the information you need to compare your three objects or concepts, it’s time to customize the look and feel. It’s easy to change up shapes, sizes, and font types in the 3-circle Venn diagram template — whether you want to align your diagram with brand colors, present your information more clearly, or simply make it more visually appealing.
Want to try creating your Venn diagram from scratch? Explore our Venn diagram tool to learn more.
Benefits of using Miro’s 3-circle Venn diagram template
Miro makes it easy to create Venn diagrams online with your team and discuss them in real time or asynchronously. It only takes seconds to add the 3-circle Venn diagram template, saving you time from having to create one from scratch while allowing you to dive straight into the customization process. Easily edit text, drag and drop your own images, and tag your teammates in comments.
With an infinite canvas, you can also add as many sticky notes, shapes, and images as you need to add context to your Venn diagram. On top of that, Miro integrates with over 130 apps, including project management tools like Jira and Trello and entire suites like Microsoft 365 and Google Workspace. That means you get to use the 3-circle Venn diagram template alongside other tools you already love.
Is Miro’s 3-circle Venn diagram template free?
Yes, Miro’s 3-circle Venn diagram template is free and customizable. Simply click on “use template” to open the template in Miro and start filling it in, editing the look and feel, and sharing it with teammates when you’re ready.
When should I use Miro’s 3-circle Venn diagram template?
One of Venn diagrams' most well-known use cases is determining probability — which is especially common in fields like data analytics, engineering, and other scientific fields. Speaking of science, they’re helpful for visual problem-solving complex algorithms in the world of software and computer science. That said, Venn diagrams are also popular in the arts, such as studying the similarities and differences between various languages and language groups. In other words, you can use Venn diagrams anytime you have to compare two or more groups.
What are the key components of a Venn diagram?
There are six key components: sets, union, intersection, symmetric difference, complement, and relative complement. Sets refer to the data you’re comparing, such as numbers, ideas, or even objects. Union refers to everything that we’re considering in the Venn diagram — also known as the universal set. The intersection refers to what the datasets have in common — where the circles overlap. The symmetric difference includes everything except the intersection. The complement refers to everything that doesn’t belong to a particular set, while the relative complement refers to everything that’s in one set but not another.
Get started with this template right now.
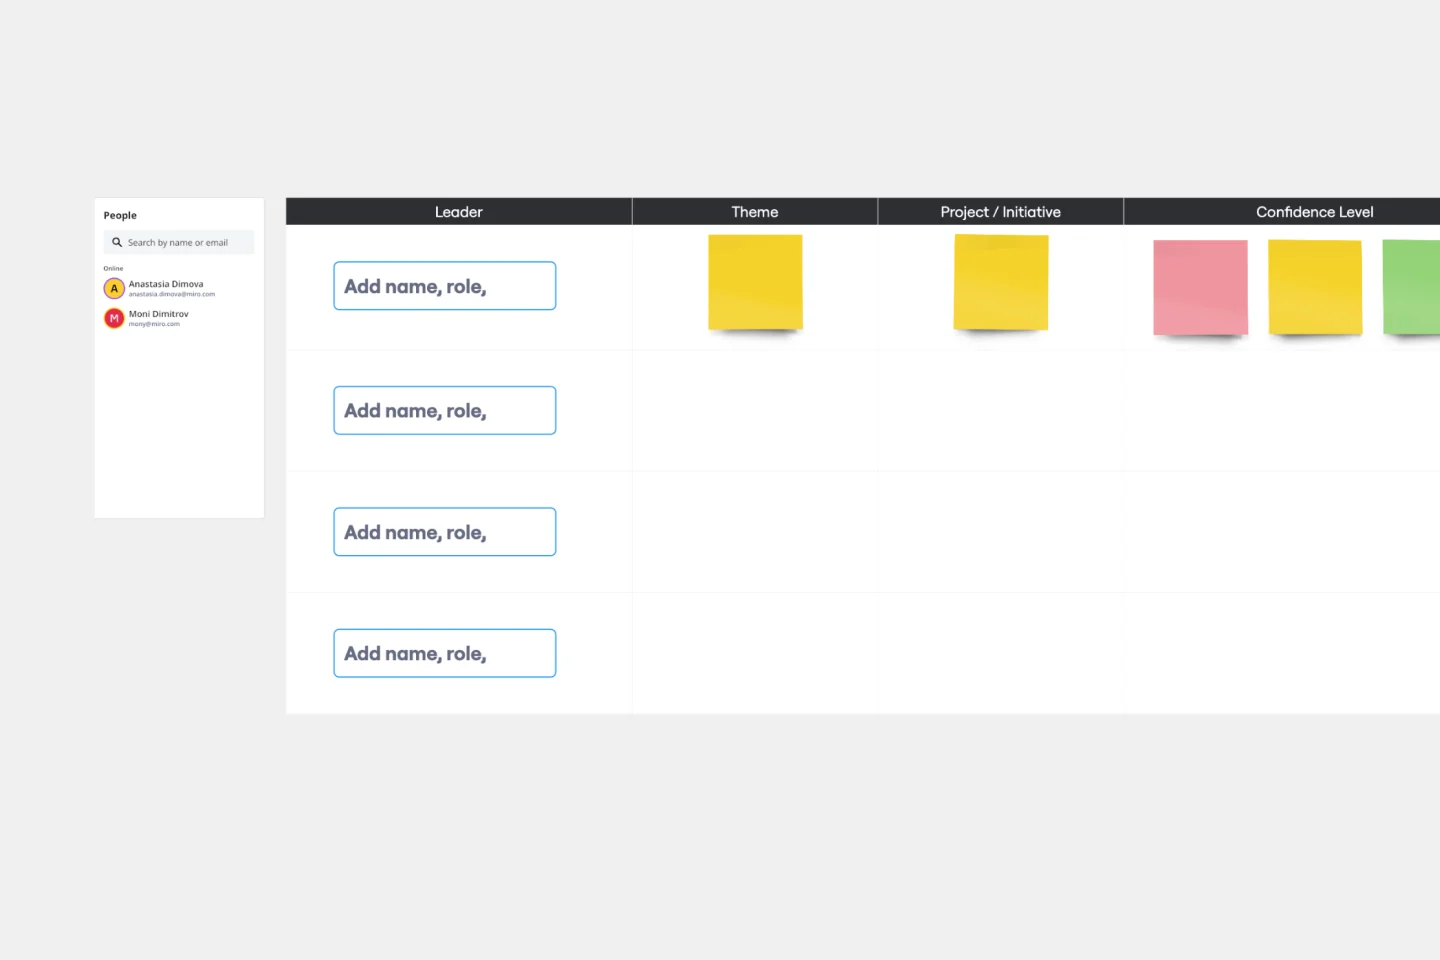
Status Report Template
Works best for:
Project Management, Documentation, Strategic Planning
A status report provides a snapshot of how something is going at a given time. You can provide a status report for a project, a team, or a situation, as long as it emphasizes and maps out a project’s chain of events. If you’re a project manager, you can use this report to keep historical records of project timelines. Ideally, any project stakeholder should be able to look at a status report and answer the question, “Where are we, and how did we get here?” Use this template as a starting point to summarize how something is progressing against a projected plan or outcome.
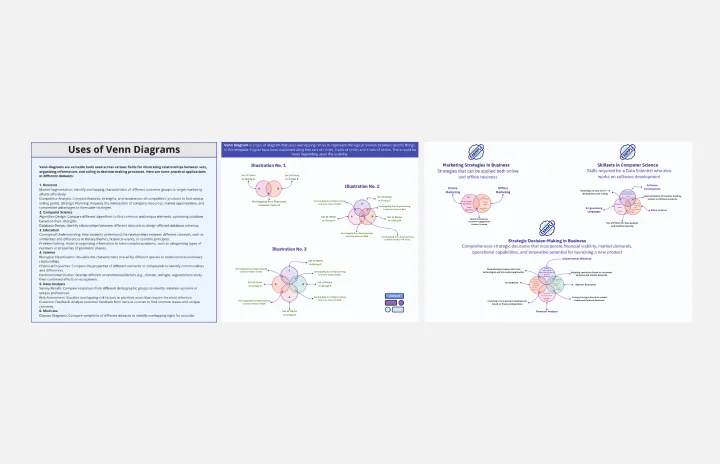
Venn Diagram Practical Applications
Works best for:
Venn Diagram
The Venn Diagram for Practical Applications template helps you apply Venn diagrams to real-world scenarios. Use this template to solve problems, identify relationships, and make decisions based on clear visual analysis. It's perfect for practical tasks such as project planning, resource allocation, and strategic decision-making. This tool is ideal for business professionals, educators, and anyone looking to apply theoretical concepts to practical situations.
Mental Model Template
Works best for:
Business Management, Mind Mapping, Diagrams
Smart solutions and strong, strategic decisions. The best organizations make both, and a mental model is designed to help them do it. We give you a fast and easy way to try it out — just fill out our ready-made, flexible template and add sticky notes, shapes, and arrows to create a powerful map.
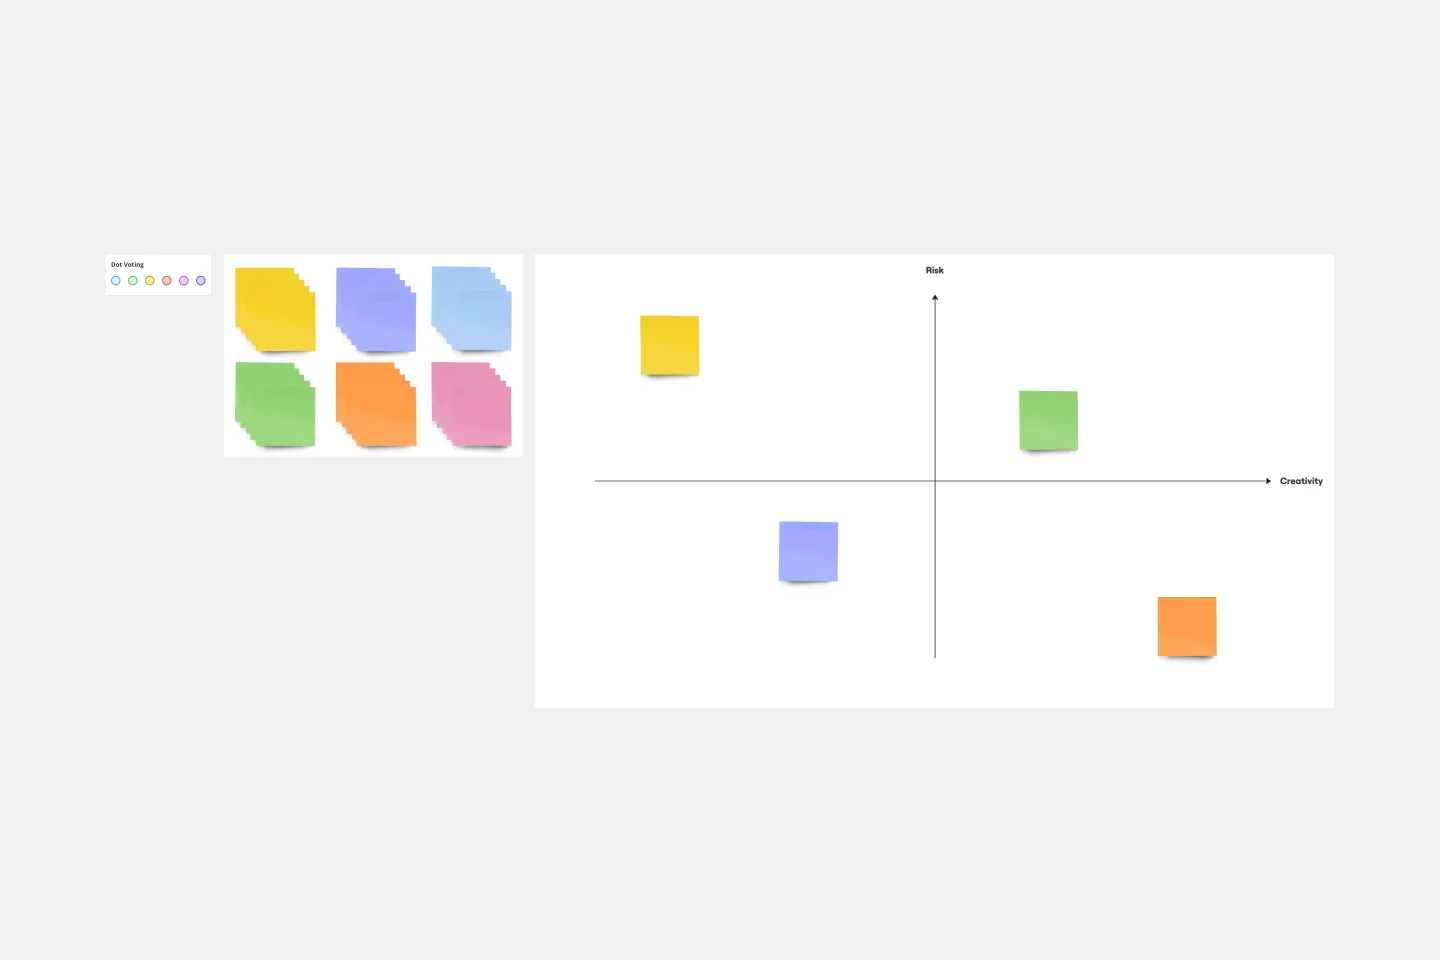
Assumption Grid Template
Works best for:
Leadership, Decision Making, Strategic Planning
Someone wise once said that nothing in life is certain. But the waters of the business world? It can seem especially uncertain and unclear. An Assumption Grid can help you navigate those waters and make your decisions confidently. It organizes your business ideas according to the certainty and risk of each — then your team can discuss them and make judgment calls, prioritize, mitigate risk, and overcome uncertainties. That’s why an Assumption Grid is a powerful tool for getting past the decision paralysis that every team occasionally faces.
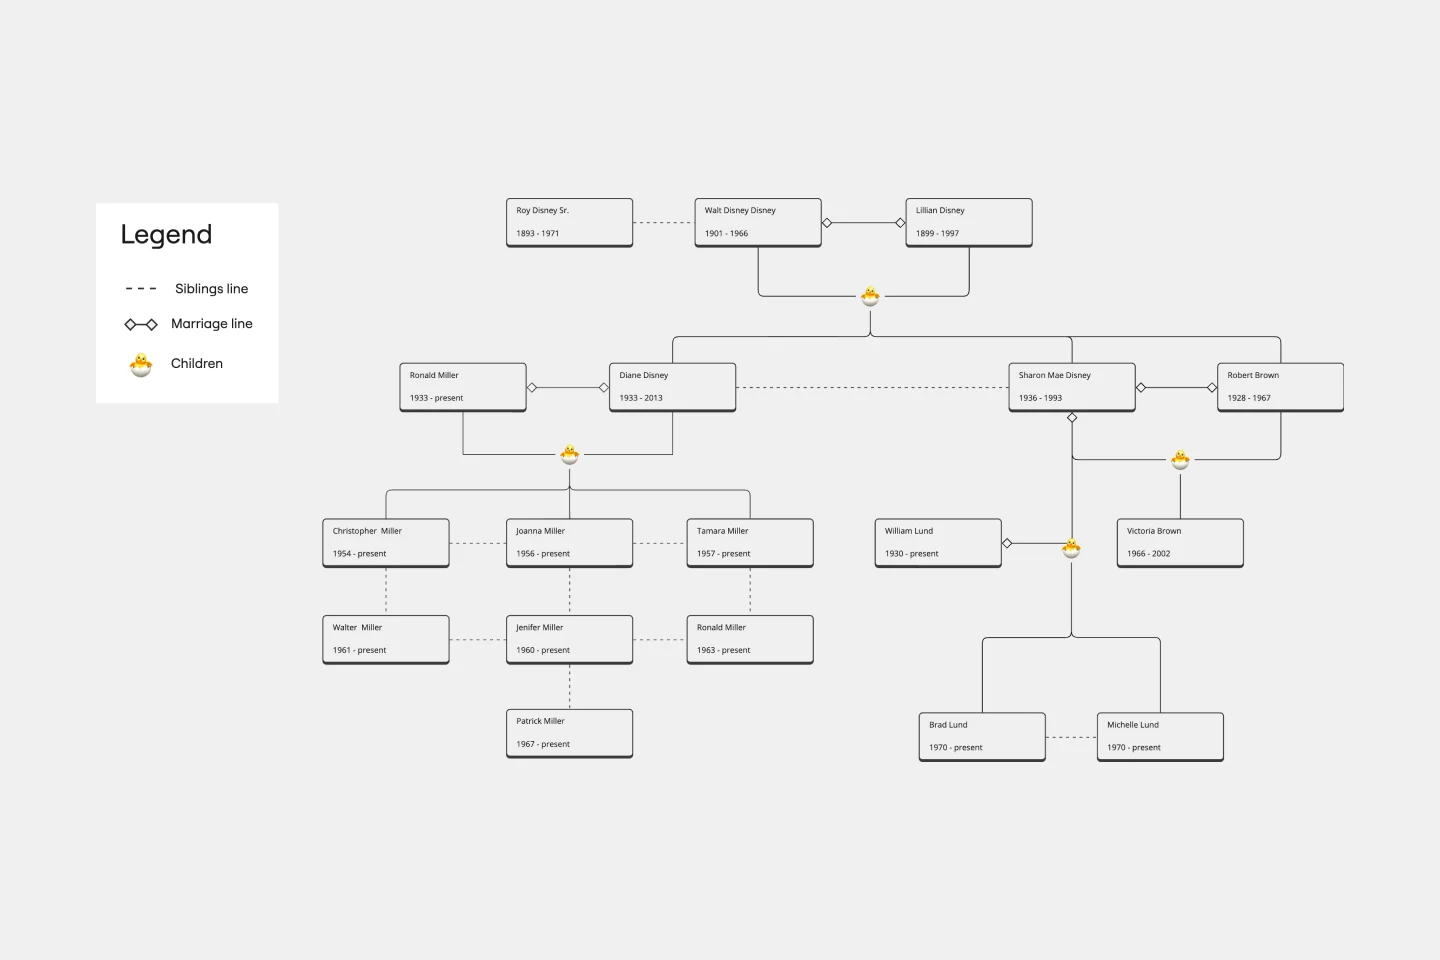
Family Tree Template
Works best for:
Education, Mapping
Family trees help you make sense of complicated family relationships, even generations back. With this Family Tree Template, you can quickly and easily add your siblings, parents, and extended family members. Plus, add extra information, notes, and even images to create a vibrant family tree.
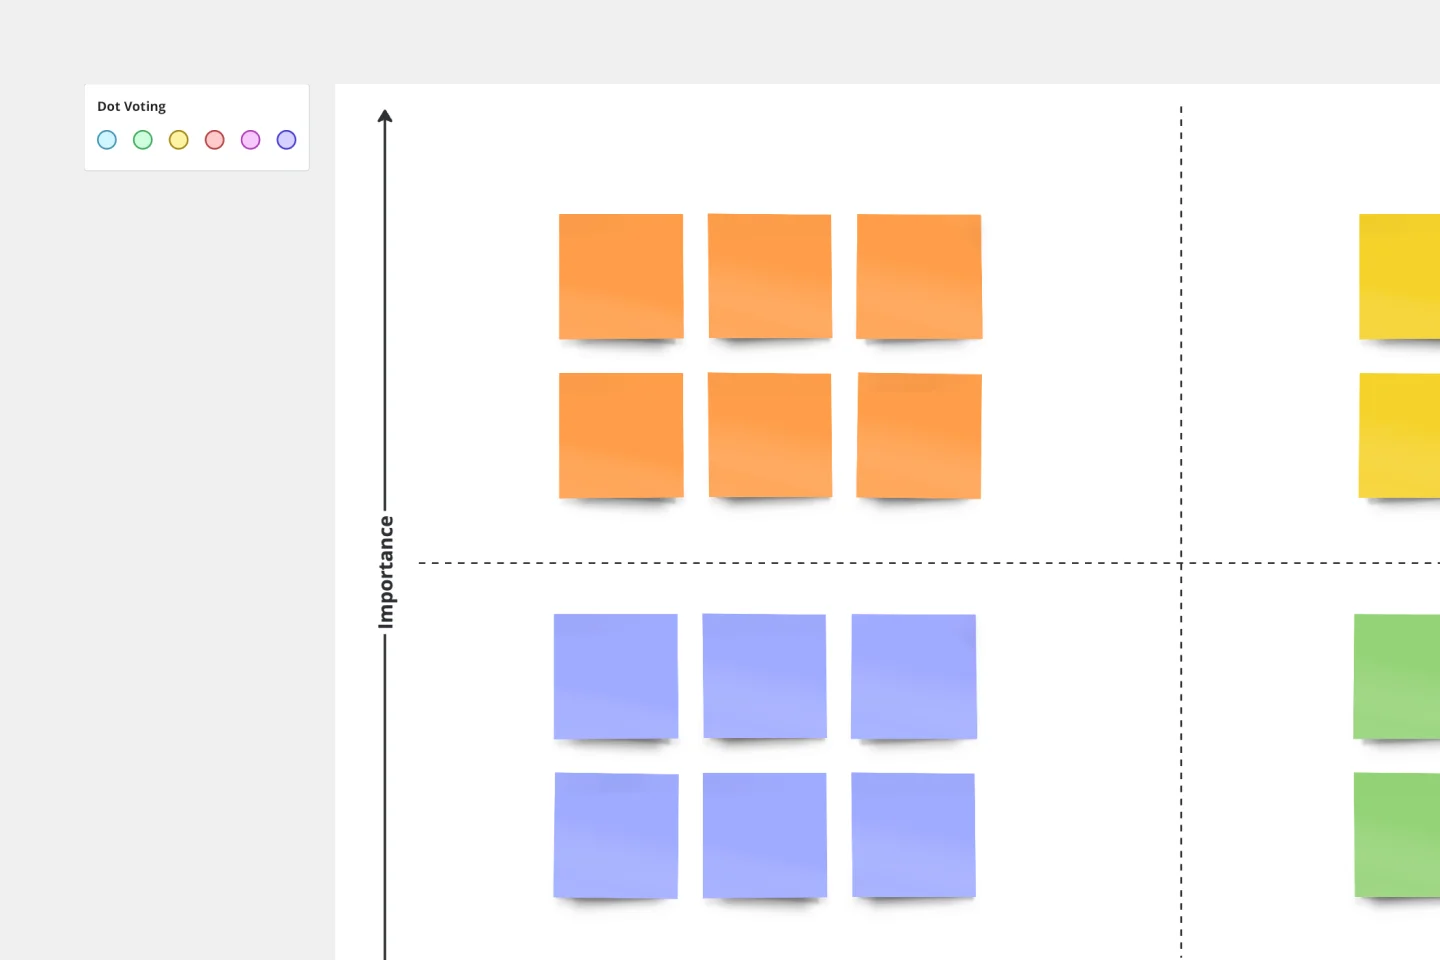
2x2 Prioritization Matrix Template
Works best for:
Operations, Strategic Planning, Prioritization
Ready to set boundaries, prioritize your to-dos, and determine just what features, fixes, and upgrades to tackle next? The 2x2 prioritization matrix is a great place to start. Based on the lean prioritization approach, this template empowers teams with a quick, efficient way to know what's realistic to accomplish and what’s crucial to separate for success (versus what’s simply nice to have). And guess what—making your own 2x2 prioritization matrix is easy.